Beautiful Sapna Vip Call Girls Hauz Khas 9711199012 Call /Whatsapps
What a waste2012 final
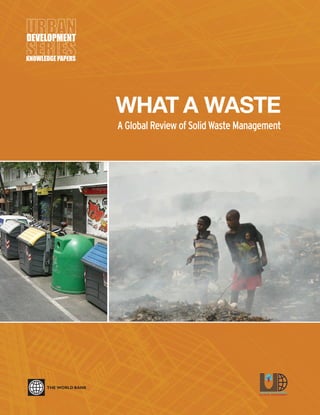
1. WHAT A WASTE
A Global Review of Solid Waste Management
KNOWLEDGE PAPERS
For more information about the
Urban Development Series, contact:
Urban Development and Local Government Unit
Sustainable Development Network
The World Bank
1818 H Street, NW
Washington, DC, 20433
USA
Email: urbanhelp@worldbank.org
Website: www.worldbank.org/urban
March 2012, No. 15
WHATAWASTE:AGLOBALREVIEWOFSOLIDWASTEMANAGEMENT
2. Cover photo on right and on this page: Conakry landfill, Guinea (Charles Peterson photographer).
Cover photo on far left: separate containers for recyclables and non-recyclables, Barcelona, Spain (Perinaz Bhada-Tata photographer).
Previous Knowledge Papers in This Series
Lessons and Experiences from
Mainstreaming HIV/AIDS into Urban/
Water (AFTU1 & AFTU2) Projects
Nina Schuler, Alicia Casalis, Sylvie Debomy,
Christianna Johnnides, and Kate Kuper,
September 2005, No. 1
Occupational and Environmental
Health Issues of Solid Waste
Management: Special Emphasis on
Middle and Lower-Income Countries
Sandra Cointreau, July 2006, No. 2
A Review of Urban Development Issues
in Poverty Reduction Strategies
Judy L. Baker and Iwona Reichardt,
June 2007, No. 3
Urban Poverty in Ethiopia: A Multi-
Faceted and Spatial Perspective
Elisa Muzzini, January 2008, No. 4
Urban Poverty: A Global View
Judy L. Baker, January 2008, No. 5
Preparing Surveys for Urban
Upgrading Interventions:
Prototype Survey
Instrument and User Guide
Ana Goicoechea, April 2008, No. 6
Exploring Urban Growth Management:
Insights from Three Cities
Mila Freire, Douglas Webster,
and Christopher Rose, June 2008, No. 7
Private Sector Initiatives
in Slum Upgrading
Judy L. Baker and Kim McClain,
May 2009, No. 8
The Urban Rehabilitation of the
Medinas: The World Bank Experience
in the Middle East and North Africa
Anthony G. Bigio and Guido Licciardi,
May 2010, No. 9
Cities and Climate Change:
An Urgent Agenda
Daniel Hoornweg, December 2010, No. 10
Memo to the Mayor: Improving Access
to Urban Land for All Residents —
Fulfilling the Promise
Barbara Lipman, with Robin Rajack,
June 2011, No. 11
Conserving the Past as a Foundation
for the Future: China-World Bank
Partnership on Cultural Heritage
Conservation
Katrinka Ebbe, Guido Licciardi
and Axel Baeumler, September 2011, No. 12
Guidebook on Capital Investment
Planning for Local Governments
Olga Kaganova, October 2011, No. 13
3. WHAT A WASTE
A Global Review of Solid
Waste Management
Daniel Hoornweg and Perinaz Bhada-Tata
March 2012, No. 15
KNOWLEDGE PAPERS
5. Foreword vii
Acknowledgements viii
Executive Summary ix
Abbreviations and Acronyms xi
Country Classification According to Region xii
Country Classification According to Income xiii
1. Introduction 1
2. Global Waste Management Practices 4
3. Waste Generation 8
4. Waste Collection 13
5. Waste Composition 16
6. Waste Disposal 22
7. Waste and the Environment 25
A Note on the Reliability of Solid Waste Data 32
TABLE OF CONTENTS Maxim Tupikov /Shutterstock.com
6. iv URBAN DEVELOPMENT SERIES – KNOWLEDGE PAPERS
Annexes
A. Map of Regions 36
B. Map of Income Distribution 38
C. Availability of MSW Data by Country 40
D. Countries Excluded for Lack of Data 45
E. Estimated Solid Waste Management Costs 46
F. MSW Generation Data for Cities Over 100,000 47
G. MSW Collection Data for Cities Over 100,000 63
H. MSW Disposal Methods for Cities Over 100,000 71
I. MSW Composition Data for Cities Over 100,000 78
J. MSW Generation by Country — Current Data and Projections for 2025 80
K. MSW Collection Rates by Country 84
L. MSW Disposal Methods by Country 87
M. MSW Composition by Country 90
N. IPCC Classification of MSW Composition 93
O. The Global City Indicators Program 94
References 95
7. WHAT A WASTE: A GLOBAL REVIEW OF SOLID WASTE MANAGEMENT v
List of Tables
1. Comparison of solid waste management practices by income level 5
2. Generators and types of solid waste 7
3. Current waste generation per capita by region 9
4. Waste generation projections for 2025 by region 10
5. Current waste generation per capita by income level 10
6. Waste generation projections for 2025 by income 11
7. Sources for 2025 projections of solid waste generation 12
8. Average MSW generation rates by income 12
9. Types of waste and their sources 16
10. Types of waste composition by income level 19
11. MSW disposal by income 23
12. MSW disposal in two contrasting regions 24
13. Landfill classifications 29
14. Landfill methane emissions and total GHG emissions for selected countries 30
15. Technical GHG mitigation opportunities by waste management component 31
List of Figures
1. Waste generation by region 9
2. Waste generation by income level 11
3. Urban waste generation by income level and year 12
4. Waste collection rates by income 15
5. Waste collection rates by region 15
6. Waste composition in China 17
7. Global solid waste composition 17
8. Waste composition by income 19
9. Solid waste composition by income and year 20
10. Waste composition by region 21
11. Total MSW disposed of worldwide 22
12. Low-income countries waste disposal 24
13. Upper middle-income countries waste disposal 24
14. Waste hierarchy 27
List of Boxes
1. What a Waste 1999: What’s changed (and what hasn’t) in the last decade 2
2. Definitions of Municipal Solid Waste 4
3. Components of an Integrated Solid Waste Management Plan 25
4. Integrated Sustainable Waste Management Framework 26
10. Acknowledgements
This report was written by Daniel Hoornweg and Perinaz Bhada-Tata; and managed by Abha Joshi-
Ghani, Manager of the Urban Development and Local Government Unit and Zoubida Allaoua, Director
of the Finance, Economics and Local Government Department. The ‘Waste and Climate Change’
section is from Charles Peterson. The authors would like to thank Christa Anderson, Julianne Baker
Gallegos, Carl Bartone, Marcus Lee, Catalina Marulanda, John Norton, Charles Peterson, Paul Procee,
and Sintana Vergara for their useful feedback and comments. The report was also discussed and
reviewed by the World Bank’s Waste Management Thematic Group. Adelaide Barra, Xiaofeng Li,
Jeffrey Lecksell and Claudia Lorena Trejos Gomez provided support and research assistance.
11. EXECUTIVE SUMMARY
As the world hurtles toward its urban
future, the amount of municipal solid
waste (MSW), one of the most important
by-products of an urban lifestyle, is growing
even faster than the rate of urbanization.
Ten years ago there were 2.9 billion urban
residents who generated about 0.64 kg
of MSW per person per day (0.68 billion
tonnes per year). This report estimates
that today these amounts have increased
to about 3 billion residents generating 1.2
kg per person per day (1.3 billion tonnes
per year). By 2025 this will likely increase
to 4.3 billion urban residents generating
about 1.42 kg/capita/day of municipal solid
waste (2.2 billion tonnes per year).
Municipal solid waste management is the most
important service a city provides; in low-income
countries as well as many middle-income countries,
MSW is the largest single budget item for cities
and one of the largest employers. Solid waste
is usually the one service that falls completely
within the local government’s purview. A city that
cannot effectively manage its waste is rarely able
to manage more complex services such as health,
education, or transportation.
Poorly managed waste has an enormous impact
on health, local and global environment, and
economy; improperly managed waste usually
results in down-stream costs higher than what it
would have cost to manage the waste properly in the
first place. The global nature of MSW includes its
contribution to GHG emissions, e.g. the methane
from the organic fraction of the waste stream, and
the increasingly global linkages of products, urban
practices, and the recycling industry.
This report provides consolidated data on MSW
generation, collection, composition, and disposal
by country and by region. Despite its importance,
reliable global MSW information is not typically
available. Data is often inconsistent, incomparable
and incomplete; however as suggested in this report
there is now enough MSW information to estimate
Ghabawi landfill, Amman, Jordan
Golf course:
post closure use
of landfill site
Photo: Perinaz Bhada-Tata
Photo: Ron Perry/Oki Golf
12. x URBAN DEVELOPMENT SERIES – KNOWLEDGE PAPERS
global amounts and trends. The report also makes
projections on MSW generation and composition
for 2025 in order for decision makers to prepare
plans and budgets for solid waste management
in the coming years. Detailed annexes provide
available MSW generation, collection, compo-
sition, and disposal data by city and by country.
Globally, waste volumes are increasing quickly –
even faster than the rate of urbanization. Similar
to rates of urbanization and increases in GDP, rates
of MSW growth are fastest in China, other parts
of East Asia, and parts of Eastern Europe and the
Middle East. Municipal planners should manage
solid waste in as holistic a manner as possible.
There is a strong correlation between urban solid
waste generation rates and GHG emissions. This
link is likely similar with other urban inputs/
outputs such as waste water and total energy use.
Reviewing MSW in an integrated manner with a
more holistic approach, focusing on urban form
and lifestyle choice may yield broader benefits.
Pollution such as solid waste, GHG emissions
and ozone-depleting substances are by-products of
urbanization and increasing affluence.
Improving MSW is one of the most effective ways
to strengthen overall municipal management and
is usually a prerequisite for other, more compli-
cated, municipal services. Waste workers, both
formal and informal, have a significant impact on
overall MSW programming. While in more affluent
countries ageing workers are a growing challenge,
the effective integration of waste pickers, particu-
larly in low-income countries, is critical.
This report is a follow-up to What a Waste: Solid Waste
Management in Asia, a Working Paper Published by
the East Asia and the Pacific Region Urban and
Local Government Sector of the World Bank in
1999. The report has been expanded to include the
entire world, given data availability and increased
inter-dependence between nations and linkages in
global trade, particularly that of secondary materials.
Men pick up used
cardboard boxes to
sell for recycling
in the San Joaquin
open-air market in
Salvador, Brazil
Photo: Alejandro Lipszyc/World Bank
13. WHAT A WASTE: A GLOBAL REVIEW OF SOLID WASTE MANAGEMENT xi
Abbreviations and Acronyms
AFR Africa region
C&D Construction and demolition
CDM Clean Development Mechanism
EAP East Asia and Pacific region
ECA Europe and Central Asia region
GDP Gross Domestic Product
GHG Greenhouse gas
HIC High-income country
ICI Industrial, commercial, and institutional
IPCC Intergovernmental Panel on Climate Change
ISWM Integrated solid waste management
Kg/capita/day kilograms per capita per day
LCR Latin America and the Caribbean region
LIC Low-income country
LMIC Lower middle-income country
MENA Middle East and North Africa region
METAP Mediterranean Environmental Technical Assistance Program
MRF Materials recovery facility
MSW Municipal solid waste
mtCO2
e Million tonnes of carbon dioxide equivalent
OECD Organisation for Economic Co-operation and Development
PAHO Pan-American Health Organization
RDF Refuse–derived fuel
SAR South Asia region
SWM Solid waste management
tCO2
e Tons of carbon dioxide equivalent
UMIC Upper middle-income country
14. xii URBAN DEVELOPMENT SERIES – KNOWLEDGE PAPERS
Africa
(AFR)
East Asia
& Pacific
(EAP)
Eastern
& Central Asia
(ECA)
Latin America
& the Caribbean
(LAC)
Middle East
& North Africa
(MENA)
Organisation for
Economic Co-operation
and Development (OECD)
South Asia
(SAR)
Angola Brunei Darussalam Albania Antigua and Barbuda Algeria Andorra Bangladesh
Benin Cambodia Armenia Argentina Bahrain Australia Bhutan
Botswana China Belarus Bahamas, The Egypt, Arab Rep. Austria India
Burkina Faso Fiji Bulgaria Barbados Iran, Islamic Rep. Belgium Maldives
Burundi Hong Kong Croatia Belize Iraq Canada Nepal
Cameroon Indonesia Cyprus Bolivia Israel Czech Republic Pakistan
Cape Verde Lao PDR Estonia Brazil Jordan Denmark Sri Lanka
Central African Republic Macao, China Georgia Chile Kuwait Finland
Chad Malaysia Latvia Colombia Lebanon France
Comoros Marshall Islands Lithuania Costa Rica Malta Germany
Congo, Dem. Rep. Mongolia Macedonia, FYR Cuba Morocco Greece
Congo, Rep. Myanmar Poland Dominica Oman Hungary
Cote d’Ivoire Philippines Romania Dominican Republic Qatar Iceland
Eritrea Singapore Russian Federation Ecuador Saudi Arabia Ireland
Ethiopia Solomon Islands Serbia El Salvador Syrian Arab Republic Italy
Gabon Thailand Slovenia Grenada Tunisia Japan
Gambia Tonga Tajikistan Guatemala United Arab Emirates Korea, South
Ghana Vanuatu Turkey Guyana West Bank and Gaza Luxembourg
Guinea Vietnam Turkmenistan Haiti Monaco
Kenya Honduras Netherlands
Lesotho Jamaica New Zealand
Liberia Mexico Norway
Madagascar Nicaragua Portugal
Malawi Panama Slovak Republic
Mali Paraguay Spain
Mauritania Peru Sweden
Mauritius St. Kitts and Nevis Switzerland
Mozambique St. Lucia United Kingdom
Namibia
St. Vincent and the
Grenadines
United States
Niger Suriname
Nigeria Trinidad and Tobago
Rwanda Uruguay
Sao Tome and Principe Venezuela, RB
Senegal
Seychelles
Sierra Leone
South Africa
Sudan
Swaziland
Tanzania
Togo
Uganda
Zambia
Zimbabwe
Country Classification According to Region
15. WHAT A WASTE: A GLOBAL REVIEW OF SOLID WASTE MANAGEMENT xiii
Lower Income (LI) Lower Middle Income (LMI) Upper Middle Income (UMI) High Income (HIC)
Chad Bulgaria Colombia Barbados
Comoros Cameroon Costa Rica Belgium
Congo, Dem. Rep. Cape Verde Cuba Brunei Darussalam
Eritrea China Dominica Canada
Ethiopia Congo, Rep. Dominican Republic Croatia
Gambia Cote d'Ivoire Fiji Cyprus
Ghana Ecuador Gabon Czech Republic
Guinea Egypt, Arab Rep. Georgia Denmark
Haiti El Salvador Grenada Estonia
Kenya Guatemala Jamaica Finland
Lao PDR Guyana Latvia France
Liberia Honduras Lebanon Germany
Madagascar India Lithuania Greece
Malawi Indonesia Malaysia Hong Kong, China
Mali Iran, Islamic Rep. Mauritius Hungary
Mauritania Iraq Mexico Iceland
Mongolia Jordan Myanmar Ireland
Mozambique Lesotho Namibia Israel
Nepal Macedonia, FYR Panama Italy
Niger Maldives Peru Japan
Rwanda Marshall Islands Poland Korea, South
Senegal Morocco Romania Kuwait
Serbia Nicaragua Russian Federation Luxembourg
Sierra Leone Nigeria Seychelles Macao, China
Tanzania Pakistan South Africa Malta
Togo Paraguay St. Kitts and Nevis Monaco
Uganda Philippines St. Lucia Netherlands
Vanuatu Sao Tome and Principe St. Vincent and the Grenadines New Zealand
Vietnam Solomon Islands Suriname Norway
Zambia Sri Lanka Tajikistan Oman
Zimbabwe Sudan Uruguay Portugal
Swaziland Venezuela, RB Qatar
Syrian Arab Republic Saudi Arabia
Thailand Singapore
Tonga Slovak Republic
Tunisia Slovenia
Turkey Spain
Turkmenistan Sweden
West Bank and Gaza Switzerland
Trinidad and Tobago
United Arab Emirates
United Kingdom
United States
Country Classification According to Income
16.
17. 1WHAT A WASTE: A GLOBAL REVIEW OF SOLID WASTE MANAGEMENT
Introduction
In 1999 the World Bank published What a Waste:
Solid Waste Management in Asia (Hoornweg and
Thomas 1999), with an estimate of waste quantities
and composition for Asia. In the intervening
decade more accurate and comprehensive data
became available for most regions of the world.
OECD-country estimates are typically reliable and
consistent—added to these were comprehensive
studies for China and India and the Pan-American
Health Organization’s study for Latin America.
Therefore a global update of the 1999 report is
possible, and timely.
Municipal solid waste managers are charged with
an enormous task: get the waste out from underfoot
and do so in the most economically, socially, and
environmentally optimal manner possible. Solid
waste management is almost always the respon-
sibility of local governments and is often their
single largest budget item, particularly in devel-
oping countries. Solid waste management and
street sweeping is also often the city’s single largest
source of employment.1
Additionally, solid waste
is one of the most pernicious local pollutants
— uncollected solid waste is usually the leading
contributor to local flooding and air and water
pollution. And if that task were not large enough,
local waste management officials also need to deal
with the integrated and international aspects of
solid waste, and increasingly with demographic
change in the work force, employment generation,
and management of staff — both formal and
informal.
1
Solid waste management — formal and informal – represents 1% to 5% of
all urban employment. As formality increases so do issues of labor organi-
zation, health and safety, ageing demographics (solid waste workers tend to
be younger), the friction between ‘sanctioned’ and ‘unsanctioned’ recycling,
and producer pay arguments and apportioning costs and responsibilities.
Managing municipal solid waste is an intensive
service. Municipalities need capacities in
procurement, contract management, profes-
sional and often unionized labor management,
and ongoing expertise in capital and operating
budgeting and finance. MSW also requires a
strong social contract between the municipality
and community. All of these skills are prerequi-
sites for other municipal services.
The original What a Waste Report provided waste
estimates for South and East Asia. This waste
stream represents about 33% of the world’s total
quantities. Most growth predictions made in What
a Waste: Solid Waste Management in Asia were
reasonably accurate and in most cases, even taking
into account the recent economic contraction,
waste growth estimates were conservative. This is
especially true in China. In 2004, China surpassed
the US as the world’s largest waste generator. In
2030, China will likely produce twice as much
municipal solid waste as the United States.
The main objective of this updated What a Waste
Report is to provide current municipal solid waste
Ferry men parking their boats on Buriganga River, Dhaka.
Photo taken as part of Development 360 project.
Photo: Scott Wallace
Illustration: Brian Fray
19. WHAT A WASTE: A GLOBAL REVIEW OF SOLID WASTE MANAGEMENT 3
items (which results in less packaging), and have
higher levels of reuse and recycling. Today, more
than 50 percent of the world’s population lives in
cities, and the rate of urbanization is increasing
quickly. By 2050, as many people will live in cities
as the population of the whole world in 2000. This
will add challenges to waste disposal. Citizens
and corporations will likely need to assume more
responsibility for waste generation and disposal,
specifically, product design and waste separation.
Also likely to emerge will be a greater emphasis on
‘urban mining’ as the largest source of materials
like metal and paper may be found in cities.
Waste is mainly a by-product of consumer-based
lifestyles that drive much of the world’s economies.
In most cities, the quickest way to reduce waste
volumes is to reduce economic activity—not
generally an attractive option. Solid waste is
the most visible and pernicious by-product of a
resource-intensive, consumer-based economic
lifestyle. Greenhouse gas emissions, water
pollution and endocrine disruptors are similar
by-products to our urban lifestyles. The long term
sustainability of today’s global economic structure
is beyond the scope of this paper. However, solid
waste managers need to appreciate the global
context of solid waste and its interconnections to
economies and local and global pollution.
This report makes projections for MSW gener-
ation in 2025, based on expected population and
economic growth rates. As countries, particularly
India and China, continue their rapid pace of
urbanization and development, global solid waste
quantities are projected to increase considerably.
Illustration: Brian Fray
21. WHAT A WASTE: A GLOBAL REVIEW OF SOLID WASTE MANAGEMENT 5
Activity Low Income Middle Income High Income
Source Reduction No organized programs, but reuse and
low per capita waste generation rates are
common.
Some discussion of source reduction, but
rarely incorporated into an organized
program.
Organized education programs emphasize
the three ‘R’s’ — reduce, reuse, and recycle.
More producer responsibility & focus on
product design.
Collection Sporadic and inefficient. Service is limited
to high visibility areas, the wealthy, and
businesses willing to pay. High fraction
of inerts and compostables impact
collection—overall collection below 50%.
Improved service and increased collection
from residential areas. Larger vehicle
fleet and more mechanization. Collection
rate varies between 50 to 80%. Transfer
stations are slowly incorporated into the
SWM system.
Collection rate greater than 90%.
Compactor trucks and highly mechanized
vehicles and transfer stations are common.
Waste volume a key consideration. Aging
collection workers often a consideration in
system design.
Recycling Although most recycling is through
the informal sector and waste picking,
recycling rates tend to be high both for
local markets and for international markets
and imports of materials for recycling,
including hazardous goods such as e-waste
and ship-breaking. Recycling markets
are unregulated and include a number of
‘middlemen’. Large price fluctuations.
Informal sector still involved; some
high technology sorting and processing
facilities. Recycling rates are still
relatively high. Materials are often
imported for recycling. Recycling markets
are somewhat more regulated. Material
prices fluctuate considerably.
Recyclable material collection services and
high technology sorting and processing
facilities are common and regulated.
Increasing attention towards long-term
markets.
Overall recycling rates higher than low
and middle income. Informal recycling
still exists (e.g. aluminum can collection.)
Extended product responsibility common.
Composting Rarely undertaken formally even though
the waste stream has a high percentage
of organic material. Markets for, and
awareness of, compost lacking.
Large composting plants are often
unsuccessful due to contamination and
operating costs (little waste separation);
some small-scale composting projects at
the community/ neighborhood level are
more sustainable. Composting eligible
for CDM projects but is not widespread.
Increasing use of anaerobic digestion.
Becoming more popular at both backyard
and large-scale facilities. Waste stream
has a smaller portion of compostables than
low- and middle-income countries. More
source segregation makes composting
easier. Anaerobic digestion increasing in
popularity. Odor control critical.
Incineration Not common, and generally not successful
because of high capital, technical, and
operation costs, high moisture content in
the waste, and high percentage of inerts.
Some incinerators are used, but
experiencing financial and operational
difficulties. Air pollution control equipment
is not advanced and often by-passed.
Little or no stack emissions monitoring.
Governments include incineration as a
possible waste disposal option but costs
prohibitive. Facilities often driven by
subsidies from OECD countries on behalf of
equipment suppliers.
Prevalent in areas with high land costs
and low availability of land (e.g., islands).
Most incinerators have some form of
environmental controls and some type of
energy recovery system. Governments
regulate and monitor emissions. About
three (or more) times the cost of landfilling
per tonne.
Landfilling/
Dumping
Low-technology sites usually open
dumping of wastes. High polluting
to nearby aquifers, water bodies,
settlements. Often receive medical waste.
Waste regularly burned. Significant health
impacts on local residents and workers.
Some controlled and sanitary landfills
with some environmental controls. Open
dumping is still common. CDM projects for
landfill gas are more common.
Sanitary landfills with a combination of
liners, leak detection, leachate collection
systems, and gas collection and treatment
systems. Often problematic to open new
landfills due to concerns of neighboring
residents. Post closure use of sites
increasingly important, e.g. golf courses
and parks.
Costs
(see Annex E)
Collection costs represent 80 to 90% of
the municipal solid waste management
budget. Waste fees are regulated by some
local governments, but the fee collection
system is inefficient. Only a small
proportion of budget is allocated toward
disposal.
Collection costs represent 50% to 80%
of the municipal solid waste management
budget. Waste fees are regulated by some
local and national governments, more
innovation in fee collection, e.g. included
in electricity or water bills. Expenditures
on more mechanized collection fleets and
disposal are higher than in low-income
countries.
Collection costs can represent less
than 10% of the budget. Large budget
allocations to intermediate waste
treatment facilities. Up front community
participation reduces costs and increases
options available to waste planners (e.g.,
recycling and composting).
TABLE 1
Comparison of Solid Waste Management Practices by Income Level (adapted from What a Waste 1999)
22. 6 URBAN DEVELOPMENT SERIES – KNOWLEDGE PAPERS
Locally, waste collection vehicles are large
sources of emissions and both incineration and
landfilling contribute GHG emissions. Uncol-
lected waste can provide breeding areas and food
to potentially disease carrying vectors such as
insects and rodents, with their associated health
and nuisance issues. Waste management cannot
be effectively managed without due consider-
ation for issues such as the city’s overall GHG
emissions, labor market, land use planning, and
myriad related concerns.
Despite progress in solid waste management
practices in the decade since the original What a
Waste Report was published, fundamental insti-
tutional, financial, social, and environmental
problems still exist. Although each country and
city has their own site-specific situations, general
observations can be made across low-, middle-,
and high-income countries, as delineated in
Table 1.
The average city’s municipal waste stream is
made up of millions of separate waste items.
For a compilation of the different definitions for
Municipal Solid Waste, please refer to Box 2. In
many cases, items in a city’s waste stream origi-
nated from other countries that have countless
factories and independent producers. Some of
the larger waste fractions, such as organics (food
and horticultural waste) and paper are easier
to manage, but wastes such as multi-laminates,
hazardous (e.g. syringes), and e-waste, pose dispro-
portionately large problems. Industry programs,
such as voluntary plastic-type labeling, are largely
ineffective (no facilities exist to differentiate
containers by numbers, either mechanically or by
waste-worker) and deposit-return systems often
meet industry and consumer resistance. Hybrid,
ad hoc, and voluntary take-back programs are
emerging, however they are generally inefficient
and municipalities are often forced to subsidize
the disposal costs of these items.
In the last ten to twenty years an additional
challenge has emerged for the waste manager: the
growing global vagaries of secondary materials
markets. Many municipal recycling programs in
Europe and North America were started with the
recycling markets relatively close to source. More
recently, marketing of secondary-materials has
emerged as a global business. The price paid per
tonne of waste paper in New York City is often
based on what the purchase price is in China.
The majority of waste recycled in Buenos Aires,
for example, is shipped to China. The volatility
of secondary materials prices has increased,
making planning more difficult. The price is often
predictive of economic trends, dropping signifi-
cantly during economic downturns (when a city
is least able to afford price drops). There are
some hedging opportunities for materials pricing,
however secondary materials marketing does not
have the same degree of sophistication as other
commodities (largely due to issues of reliability,
quality, externalities, and the sheer number of
interested parties).
In the years that have passed since the original What
a Waste report was released, two comprehensive
World Bank studies on India and China have been
prepared (Hanrahan et al 2006 and Hoornweg et
al 2005). Additionally, OECD and PAHO have
released MSW data for Latin America and the
Caribbean. This version of What a Waste includes
the data presented by these reports.
MSW, as defined in this report, encompasses
residential, industrial, commercial, institutional,
municipal, and construction and demolition
(C&D) waste. Table 2 gives sources and types of
waste generated.
23. WHAT A WASTE: A GLOBAL REVIEW OF SOLID WASTE MANAGEMENT 7
TABLE 2
Generators and
Types of Solid Waste
(adapted from
What a Waste 1999)
Source Typical Waste Generators Types of Solid Wastes
Residential Single and multifamily dwellings Food wastes, paper, cardboard, plastics,
textiles, leather, yard wastes, wood,
glass, metals, ashes, special wastes (e.g.,
bulky items, consumer electronics, white
goods, batteries, oil, tires), and household
hazardous wastes (e.g., paints, aerosols,
gas tanks, waste containing mercury,
motor oil, cleaning agents), e-wastes (e.g.,
computers, phones, TVs)
Industrial Light and heavy manufacturing,
fabrication, construction sites, power
and chemical plants (excluding specific
process wastes if the municipality does
not oversee their collection)
Housekeeping wastes, packaging, food
wastes, construction and demolition
materials, hazardous wastes, ashes,
special wastes
Commercial Stores, hotels, restaurants, markets, office
buildings
Paper, cardboard, plastics, wood, food
wastes, glass, metals, special wastes,
hazardous wastes, e-wastes
Institutional Schools, hospitals (non-medical waste),
prisons, government buildings, airports
Same as commercial
Construction and Demolition New construction sites, road repair,
renovation sites, demolition of buildings
Wood, steel, concrete, dirt, bricks, tiles
Municipal Services Street cleaning, landscaping, parks,
beaches, other recreational areas, water
and wastewater treatment plants
Street sweepings; landscape and tree
trimmings; general wastes from parks,
beaches, and other recreational areas,
sludge
All of the above should be included as municipal solid waste. Industrial, commercial, and institutional (ICI) wastes are often grouped
together and usually represent more than 50% of MSW. C&D waste is often treated separately: if well managed it can be disposed
separately. The items below are usually considered MSW if the municipality oversees their collection and disposal.
Process Heavy and light manufacturing, refineries,
chemical plants, power plants, mineral
extraction and processing
Industrial process wastes, scrap materials,
off-specification products, slag, tailings
Medical waste Hospitals, nursing homes, clinics Infectious wastes (bandages, gloves,
cultures, swabs, blood and body fluids),
hazardous wastes (sharps, instruments,
chemicals), radioactive waste from cancer
therapies, pharmaceutical waste
Agricultural Crops, orchards, vineyards, dairies,
feedlots, farms
Spoiled food wastes, agricultural wastes
(e.g., rice husks, cotton stalks, coconut
shells, coffee waste), hazardous wastes
(e.g., pesticides)
24. 8 URBAN DEVELOPMENT SERIES – KNOWLEDGE PAPERS
Waste Generation
At a Glance:
` MSW generation levels are expected to double by 2025.
` The higher the income level and rate of urbanization, the greater the amount of solid waste
produced.
` OECD countries produce almost half of the world’s waste, while Africa and South Asia regions
produce the least waste.
Current global MSW generation levels are
approximately 1.3 billion tonnes per year, and are
expected to increase to approximately 2.2 billion
tonnes per year by 2025. This represents a signif-
icant increase in per capita waste generation rates,
from 1.2 to 1.42 kg per person per day in the next
fifteen years. However, global averages are broad
estimates only as rates vary considerably by region,
country, city, and even within cities.
MSW generation rates are influenced by economic
development, the degree of industrialization, public
habits, and local climate. Generally, the higher the
economic development and rate of urbanization,
the greater the amount of solid waste produced.
Income level and urbanization are highly correlated
and as disposable incomes and living standards
increase, consumption of goods and services corre-
spondingly increases, as does the amount of waste
generated. Urban residents produce about twice as
much waste as their rural counterparts.
Waste Generation by Region
Waste generation varies as a function of affluence,
however, regional and country variations can be
significant, as can generation rates within the
same city. Annex A. Map of Regions illustrates
the regional classification used in this report.
Throughout the report, when Africa is mentioned
as a region, we refer to Sub-Saharan Africa. Data
are particularly lacking for Sub-Saharan Africa.
Waste generation in sub-Saharan Africa is approxi-
mately 62 million tonnes per year. Per capita waste
generation is generally low in this region, but spans
a wide range, from 0.09 to 3.0 kg per person per day,
with an average of 0.65 kg/capita/day. The countries
with the highest per capita rates are islands, likely
due to waste generated by the tourism industry, and
a more complete accounting of all wastes generated.
The annual waste generation in East Asia and the
Pacific Region is approximately 270 million tonnes
per year. This quantity is mainly influenced by
waste generation in China, which makes up 70%
of the regional total. Per capita waste generation
ranges from 0.44 to 4.3 kg per person per day for
Collecting paper
to be recycled,
Mumbai, India
Photo:JerooBhada
25. WHAT A WASTE: A GLOBAL REVIEW OF SOLID WASTE MANAGEMENT 9
the region, with an average of 0.95 kg/capita/day
(Hoornweg et al 2005).
In Eastern and Central Asia, the waste generated
per year is at least 93 million tonnes. Eight countries
in this region have no available data on waste gener-
ation in the literature. The per capita waste gener-
ation ranges from 0.29 to 2.1 kg per person per day,
with an average of 1.1 kg/capita/day.
Latin America and the Caribbean has the most
comprehensive and consistent data (e.g. PAHO’s
Regional Evaluation of Solid Waste Management,
2005). The total amount of waste generated per
year in this region is 160 million tonnes, with per
capita values ranging from 0.1 to 14 kg/capita/
day, and an average of 1.1 kg/capita/day. Similar
to the high per capita waste generation rates
on islands in Africa, the largest per capita solid
waste generation rates are found in the islands of
the Caribbean.
In the Middle East and North Africa, solid waste
generation is 63 million tonnes per year. Per capita
waste generation is 0.16 to 5.7 kg per person per
day, and has an average of 1.1 kg/capita/day.
The OECD countries generate 572 million tonnes
of solid waste per year. The per capita values
range from 1.1 to 3.7 kg per person per day with
an average of 2.2 kg/capita/day.
Region
Waste Generation Per Capita (kg/capita/day)
Lower Boundary Upper Boundary Average
AFR 0.09 3.0 0.65
EAP 0.44 4.3 0.95
ECA 0.29 2.1 1.1
LAC 0.11 142
1.1
MENA 0.16 5.7 1.1
OECD 1.10 3.7 2.2
SAR 0.12 5.1 0.45
TABLE 3
Current Waste
Generation Per
Capita by Region
(see Annex J)
SAR
5%
OECD
44%
MENA
6%
LAC
12%
ECA
7%
EAP
21%
AFR
5%
Figure 1. Current Waste Generation by Region
FIG. 1
Waste Generation
by Region
In South Asia, approximately 70 million tonnes of
waste is generated per year, with per capita values
ranging from 0.12 to 5.1 kg per person per day and
an average of 0.45 kg/capita/day.
Table 3 shows current waste generation per capita
by region, indicating the lower boundary and upper
boundary for each region, as well as average kg per
capita per day of waste generated within each region.2
Figure 1 illustrates global waste generation per
region, where OECD countries make up almost half
2
This table is not corrected for extraneous outliers, such as the 14.40 kg/
capita/day upper bound in Latin America and the Caribbean [Trinidad and
Tobago].
26. 10 URBAN DEVELOPMENT SERIES – KNOWLEDGE PAPERS
TABLE 4
Waste Generation
Projections for
2025 by Region
Income Level
Waste Generation Per Capita (kg/capita/day)
Lower Boundary Upper Boundary Average
High 0.70 14 2.1
Upper Middle 0.11 5.5 1.2
Lower Middle 0.16 5.3 0.79
Lower 0.09 4.3 0.60
TABLE 5
Current Waste
Generation
Per Capita
by Income Level
Region
Current Available Data Projections for 2025
Total Urban
Population
(millions)
Urban Waste Generation Projected Population Projected Urban Waste
Per Capita
(kg/capita/day)
Total
(tons/day)
Total Popula-
tion (millions)
Urban Popula-
tion (millions)
Per Capita
(kg/capita/day)
Total
(tons/day)
AFR 260 0.65 169,119 1,152 518 0.85 441,840
EAP 777 0.95 738,958 2,124 1,229 1.5 1,865,379
ECA 227 1.1 254,389 339 239 1.5 354.810
LCR 399 1.1 437,545 681 466 1.6 728,392
MENA 162 1.1 173,545 379 257 1.43 369,320
OECD 729 2.2 1,566,286 1,031 842 2.1 1,742,417
SAR 426 0.45 192,410 1,938 734 0.77 567,545
Total 2,980 1.2 3,532,252 7,644 4,285 1.4 6,069,703
of the world’s waste, while Africa and South Asia
figure as the regions that produce the least waste.
Table 4 shows estimates of waste generation for the
year 2025 as expected according to current trends
in population growth in each region.
Waste Generation
by Country Income Level 3
High-income countries produce the most waste
per capita, while low income countries produce
the least solid waste per capita. Although the
total waste generation for lower middle income
countries is higher than that of upper middle
income countries, likely skewed as a result of
China’s inclusion in the lower middle income
3
Countries are classified into four income levels according to World Bank
estimates of 2005 GNI per capita. High: $10,726 or above; Upper middle:
$3,466-10,725; Lower middle: $876-3,465; and Lower: $875 or less.
group, the average per capita waste generation
amounts for the various income groups reflect
the income level of the countries (see Figure 2).
The high, upper-middle, lower-middle, and low
income designations are somewhat inaccurate
as these classifications are country-wide, and in
several countries average national affluence can
be very different from average affluence of the
urban populations. Only the affluence of urban
residents is important in projecting MSW rates.
For example, India and especially China have
disproportionately high urban waste generation
rates per capita relative to overall economic status
as they have large relatively poor rural populations
that tend to dilute national figures. Annex B. Map
of Income Distribution illustrates the global classi-
fication for income used in this report.
Table 5 shows current waste generation per
capita by income level, indicating the lower
27. WHAT A WASTE: A GLOBAL REVIEW OF SOLID WASTE MANAGEMENT 11
boundary and upper boundary for each region,
as well as average kg per capita per day of
waste generated within each group according to
country income level.
Figure 2 presents global waste generation by country
per income level, showing decreasing average rates of
per capita waste generation according to income level.
Table 6 shows estimates of waste generation for the
year 2025 as expected according to current trends
in population growth as determined by country
income level.
Methodology for collecting current data:
MSW generation data by country were collected
from official government publications, reports
by international agencies, and articles in peer-
reviewed journals. Where possible, this report has
used the same source for a group of countries so
that the data are relatively standardized by method-
ology and year. For example, MSW generation
data for high-income countries are from OECD
publications; countries in Latin America and the
Caribbean from PAHO studies; and some Middle
Eastern countries from METAP data.
In cases where only per capita waste generation rates
were available, the total urban population for that year
(World Bank, World Development Indicators) was
used to calculate the total urban MSW generation.
Where only total MSW generation numbers were
available,totalurbanpopulationforthatyearwasused
to calculate per capita waste generation, assuming that
most of the waste generated is in urban areas and only
a small fraction comes from rural areas.
For several African countries, data were not readily
available. Hence, a per capita amount of 0.5 kg/
capita/day is assumed for urban areas for 2005. This
estimate is based on the USAID 2009 publication
on Environmental Guidelines for Small-Scale Activities in
Africa (EGSSAA), 2nd Ed. and World Bank studies.
For further information on MSW generation rates
by country, please see Annex J. When reviewing
Lower
Income
6%
Lower Middle
Income
29%
Upper Middle
Income
19%
High
Income
46%
Figure 2. Waste Generation by Country Income
TABLE 6
Waste Generation
Projections for 2025
by IncomeRegion
Current Available Data Projections for 2025 (from Annex J)
Total Urban
Population
(millions)
Urban Waste Generation Projected Population Projected Urban Waste
Per Capita
(kg/capita/
day)
Total
(tons/day)
Total Popula-
tion
(millions)
Urban
Population
(millions)
Per Capita
(kg/capita/
day)
Total
(tons/day)
Lower Income 343 0.60 204,802 1,637 676 0.86 584,272
Lower Middle Income 1,293 0.78 1,012,321 4,010 2,080 1.3 2,618,804
Upper Middle Income 572 1.16 665,586 888 619 1.6 987,039
High Income 774 2.13 1,649,547 1,112 912 2.1 1,879,590
Total 2,982 1.19 3,532,256 7,647 4,287 1.4 6,069,705
FIG. 2
Waste Generation
by Income
28. 12 URBAN DEVELOPMENT SERIES – KNOWLEDGE PAPERS
the values presented in this report, it’s important
to keep in mind that values for waste generation at
a regional level can differ markedly because of the
influence from a single country, such as the US,
China or India.
Methodology for calculating 2025 projections:
Projections for urban municipal solid waste gener-
ation in 2025 were made by factoring expected
growth in population and GDP and estimated
per capita waste generation. Projections for each
country were made based on the level of expected
GDP(high-,middle-,orlow-income)andanaverage
range of MSW generation based on that income
level. Modest adjustments for current experience
and waste generation practices were made where
appropriate. Similar to ‘energy intensity’ urban
residents also exhibit ‘waste intensity’.
For further information on the sources used for
the 2025 projections please refer to Table 7.
Table 8 illustrates the range of MSW based on
country income level. These values are supported
by Table 6.
TABLE 7
Sources for 2025
Projections of
Solid Waste
Generation
FIG. 3
Urban Waste
Generation
by Income Level
and Year
TABLE 8
Average MSW
Generation Rates
by Income
Variable Data Source
Current GDP (current US$, 2005) World Development Indicators
GDP Projections by Region IEA Annual Energy Outlook (2005)
Urban Population Projections United Nations World Urbanization Prospects (2007)
Income Level Average MSW Generation (kg/cap/day)
Low-Income 0.6 – 1.0
Middle-Income 0.8 – 1.5
High-Income 1.1 – 4.5
0
200
400
600
800
1,000
1,200
Projected 20252010
High
Income
Upper Middle
Income
Lower Middle
Income
Lower
Income
WasteGenerated(millionstons/day)
Urban Population (millions) 343 676 1,293 2,080 573 619 774 912
Waste (kg/capita/year) 219 343 288 344 423 628 777 840
Country Income Group
75
213
369
956
243
360
602
686
Figure 3. Urban Waste Generation
30. 14 URBAN DEVELOPMENT SERIES – KNOWLEDGE PAPERS
but rather is placed out for collection in separate
containers without first being ‘mixed’ together.
Often, especially in developing countries, MSW
is not separated or sorted before it is taken for
disposal, but recyclables are removed by waste
pickers prior to collection, during the collection
process, and at disposal sites.
The degree of source separation impacts the total
amount of material recycled and the quality of
secondarymaterialsthatcanbesupplied.Recyclables
recovered from mixed waste, for example, tend to
be contaminated, reducing marketing possibilities.
However, source separation and separate collection
can add costs to the waste collection process.
Collection programs need to be differentiated by
type of generator. Often more attention is devoted
to residential waste even though this is usually less
than 50% of the total waste stream. Waste generated
bytheICIsectortendstobecollectedbetter,because
of more efficient containerization and purpose-built
vehicles, and benefits from the collection of fees.
Residential waste collection, on the other hand,
tends to be more expensive to collect per tonne as
waste is more dispersed. Annex G provides data for
MSW collection in cities over 100,000.
The percent of MSW collected varies by national
incomeandbyregion.Higherincomecountriestend
to have higher collection efficiency although less of
the solid waste management budget goes towards
collection. In low-income countries, collection
services make up the bulk of a municipality’s SWM
budget (as high as 80 to 90% in many cases), yet
collection rates tend to be much lower, leading to
lower collection frequency and efficiency. In high-
income countries, although collection costs can
represent less than 10% of a municipality’s budget,
collection rates are usually higher than 90% on
average and collection methods tend to be mecha-
nized, efficient, and frequent. While total collection
budgets are higher, they are proportionally lower
as other budget items increase. For further infor-
mation on estimated solid waste management costs
according to income level, please refer to Annex E.
The degree and sophistication of waste picking
influences overall collection. In cities like Buenos
Aires, waste pickers tend to remove recyclables
Separate
garbage
containers,
Singapore
Photo:CyrusTata
31. WHAT A WASTE: A GLOBAL REVIEW OF SOLID WASTE MANAGEMENT 15
after the waste is placed curbside. The resulting
scattered waste is more costly to collect: in some
cases the value of recyclables are less than the
extra costs associated with collecting the disturbed
waste. In some cities informal waste pickers have
strong links to the waste program and municipally
sanctioned crews can be prevented from accessing
the waste as informal waste pickers process the
waste. Waste pickers can be formally or informally
organized into groups or unions with varying
degrees of autonomy and political voice.
Containerization is an important aspect for waste
collection, particularly from residential generators. If
waste is not set out for collection in closed containers
it can be disturbed by vermin such as dogs and rats,
and it can become water-logged, or set afire.
Frequency of collection is an important aspect
readily under a municipality’s control. From a
health perspective, no more than weekly collection
is needed. However in some cities, largely because
of culture and habituation, three-times per day
residentialcollectionisoffered(e.g.Shanghai).Good
waste collection programming requires an ongoing
iterative approach between collection crews and
generators (usually households). Therefore, waste
generators should be aware of the true costs of
collection, and ideally be charged for these directly.
MSW Collection by Income
The data show that the average waste collection
rates are directly related to income levels.
Low-income countries have low collection rates,
around 41%, while high-income countries have
higher collection rates averaging 98%. Figure 4
shows the average collection percentage by income.
Annex K details MSW collection rates by country.
MSW Collection by Region
Figure 5 shows MSW collection efficiency by
region. Regions with low-income countries tend
to have low collection rates. South Asia and Africa
are the lowest with 65% and 46% respectively. Not
surprisingly, OECD countries tend to have the
highest collection efficiency at 98%.
0%
10%
20%
30%
40%
50%
60%
70%
80%
90%
100%
Lower IncomeLower Middle
Income
Upper Middle
Income
High Income
Figure 4. Waste Collection by Income
0%
10%
20%
30%
40%
50%
60%
70%
80%
90%
100%
AFRSAREAPECALACMENAOECD
Figure 5. Waste Collection by Region
FIG. 4
Waste Collection Rates by Income
FIG. 5
Waste Collection Rates by Region
32. 16 URBAN DEVELOPMENT SERIES – KNOWLEDGE PAPERS
Waste Composition
At a Glance:
` Waste composition is influenced by factors such as culture, economic development, climate,
and energy sources; composition impacts how often waste is collected and how it is disposed.
` Low-income countries have the highest proportion of organic waste.
` Paper, plastics, and other inorganic materials make up the highest proportion of MSW in high-
income countries.
` By region, EAP has the highest proportion of organic waste at 62%, while OECD countries have
the least at 27%, although total amount of organic waste is still highest in OECD countries.
` Although waste composition is usually provided by weight, as a country’s affluence increases,
waste volumes tend to be more important, especially with regard to collection: organics
and inerts generally decrease in relative terms, while increasing paper and plastic increases
overall waste volumes.
In the municipal solid waste stream, waste is
broadly classified into organic and inorganic. In
this study, waste composition is categorized as
organic, paper, plastic, glass, metals, and ‘other.’
These categories can be further refined, however,
these six categories are usually sufficient for general
solid waste planning purposes. Table 9 describes
the different types of waste and their sources.
An important component that needs to be
considered is ‘construction and demolition waste’
(C&D), such as building rubble, concrete and
masonry. In some cities this can represent as much
as 40% of the total waste stream. However, in this
report, C&D waste is not included unless specifi-
cally identified. A separate case-by-case review is
recommended for specific cities.
Industrial, Commercial and Institutional (ICI)
waste also needs further local refinement. Many
industrial processes have specific wastes and
by-products. In most cities this material, with its
relatively easier flow and quality control, is the first
material to be recycled. Some industrial process
waste requires specific treatment. For most MSW
management plans industrial by-products are not
TABLE 9
Types of Waste
and Their Sources
Type Sources
Organic Food scraps, yard (leaves, grass, brush) waste, wood, process residues
Paper
Paper scraps, cardboard, newspapers, magazines, bags, boxes,
wrapping paper, telephone books, shredded paper, paper beverage cups. Strictly speaking paper is organic but
unless it is contaminated by food residue, paper is not classified as organic.
Plastic Bottles, packaging, containers, bags, lids, cups
Glass Bottles, broken glassware, light bulbs, colored glass
Metal Cans, foil, tins, non-hazardous aerosol cans, appliances (white goods), railings, bicycles
Other Textiles, leather, rubber, multi-laminates, e-waste, appliances, ash, other inert materials
33. WHAT A WASTE: A GLOBAL REVIEW OF SOLID WASTE MANAGEMENT 17
Others
47%
Metal
1% Glass
2%
Plastic
4%
Paper
5%
Organic
41%
Others
10%
Metal
1%
Glass
2%
Plastic
13%
Paper
9%
Organic
65%
Figure 6. Waste Composition in China
2000: Population Using Coal 2000: Population Using Gas
Municipal Waste Genereated from Population Using Coal for household heating = 49,500,000 tons
Municipal Waste Genereated from Population Using Gas for household heating = 100,500,000 tons
Total Municipal Waste Generation in 2000 = 150,000,000 tonsSource: Hoornweg 2005
included in waste composition analyses, however
household and general waste should be included
since it is usually disposed at common facilities,
and in most cities waste from the ICI sector repre-
sents the largest fraction of the waste collected.
Wastecompositionisinfluencedbymanyfactors,such
as level of economic development, cultural norms,
geographical location, energy sources, and climate.
As a country urbanizes and populations become
wealthier, consumption of inorganic materials (such
as plastics, paper, and aluminum) increases, while the
relative organic fraction decreases. Generally, low-
and middle-income countries have a high percentage
of organic matter in the urban waste stream, ranging
from 40 to 85% of the total. Paper, plastic, glass,
and metal fractions increase in the waste stream
of middle- and high-income countries. For data on
MSW composition in cities with a population of over
100,000, please refer to Annex I.
Figure 8 illustrates the differences between low- and
high-income countries: organics make up 64% of the
MSW stream for low-income countries and paper
only 5%, whereas in high-income countries it is 28%
and 31% respectively. The IPCC uses its own classi-
fication of MSW composition based on region (See
Annex N). In high-income countries, an integrated
approach for organic waste is particularly important,
as organic waste may be diverted to water-borne
sewers, which is usually a more expensive option.
Geography influences waste composition by
determining building materials (e.g. wood versus
steel), ash content (often from household heating),
amount of street sweepings (can be as much as
10% of a city’s waste stream in dry locations), and
horticultural waste. The type of energy source
FIG. 6
Waste
Composition
in China
FIG. 7
Global
Solid Waste
Composition
Figure 7. Global Solid Waste Composition
Other
18%
Metal
4%
Glass
5%
Plastic
10%
Paper
17%
Organic
46%
34. 18 URBAN DEVELOPMENT SERIES – KNOWLEDGE PAPERS
in a location can have an impact on the compo-
sition of MSW generated. This is especially true
in low-income countries or regions where energy
for cooking, heating, and lighting might not come
from district heating systems or the electricity
grid. For example, Figure 6 shows the difference
in waste composition in China between a section
of the population that uses coal and another that
uses natural gas for space heating. The ‘other’
category is clearly higher: 47% when coal is used,
and an ash residue is included, as opposed to 10%
when natural gas is used for home heating.
Climate can also influence waste generation in
a city, country, or region. For example, in Ulan
Bator, Mongolia, ash makes up 60% of the MSW
generatedinthewinter,butonly20%inthesummer
(UNEP/GRID-Arendal 2004). Precipitation is also
important in waste composition, particularly when
measured by mass, as un-containerized waste can
absorb significant amounts of water from rain and
snow. Humidity also influences waste composition
by influencing moisture content.
Methodology
This report includes waste composition data that
was available for 105 countries from various sources.
Please see Annex M for further information on
MSW composition data by country. Waste compo-
sition data is generally available as percentages
of the various waste streams, commonly divided
into the categories shown in Table 10. In some
cases, ‘other’ wastes are further disaggregated into
textiles, rubber, ash, etc. However, for the purposes
of standardization and simplification the ‘other’
category in this report includes all of these wastes.
Although the definitions and methodologies for
determining composition are not always provided
or standardized in the waste studies referenced, the
compositions for MSW are assumed to be based
on wet weight. Each waste category was calculated
using waste generation figures from individual
countries. The total waste composition figures by
income and by region were then aggregated.
Figure 7 shows the MSW composition for the entire
world in 2009. Organic waste comprises the majority
of MSW, followed by paper, metal, other wastes,
plastic, and glass. These are only approximate values,
given that the data sets are from various years.
Waste Composition by Income
As Figures 8 a-d show, the organic fraction tends
to be highest in low-income countries and lowest
in high-income countries. Total amount of organic
waste tends to increase steadily as affluence increases
at a slower rate than the non-organic fraction.
Low-income countries have an organic fraction of
64% compared to 28% in high-income countries.
The data presented in Figure 9 illustrates solid
waste composition by income as compared between
current values and values projected for 2025. Annex
J provides data for MSW projections for 2025 by
income level.
Table 10 represents a compilation of composition
values of current day data presented in Annex M,
and specific reports for larger countries such as
China and India. Estimates for waste composition
in 2025 are based on trends observed in OECD
countries and authors’ projections.
Waste Composition by Region
MSW composition by region is shown in Figures 10
a-g. The East Asia and the Pacific Region has the
highest fraction of organic waste (62%) compared to
OECD countries, which have the least (27%). The
amount of paper, glass, and metals found in the
MSW stream are the highest in OECD countries
(32%, 7%, and 6%, respectively) and lowest in the
South Asia Region (4% for paper and 1% for both
glass and metals). Annex J provides data for MSW
projections for 2025 by region.
35. WHAT A WASTE: A GLOBAL REVIEW OF SOLID WASTE MANAGEMENT 19
Figure 8. Waste Composition by Income
b. Waste Composition in Lower Middle-Income Countries
Source:
Other
15%
Metal
2%
Glass
3%
Plastic
12%
Paper
9%
Organic
59%
a. Waste Composition in Low-Income Countries
Other
17%
Metal
3%
Glass
3%
Plastic
8%
Paper
5%
Organic
64%
d. Waste Composition in High-Income Countries
Other
17%
Metal
6%
Glass
7%
Plastic
11%
Paper
31%
Organic
28%
c. Waste Composition in Upper Middle-Income Countries
Other
13%
Metal
3%
Glass
5%
Plastic
11%
Paper
14%
Organic
54%
CURRENT ESTIMATES*
Income Level Organic (%) Paper (%) Plastic (%) Glass (%) Metal (%) Other (%)
Low Income 64 5 8 3 3 17
Lower Middle Income 59 9 12 3 2 15
Upper Middle Income 54 14 11 5 3 13
High Income 28 31 11 7 6 17
2025 ESTIMATES**
Income Level Organic (%) Paper (%) Plastic (%) Glass (%) Metal (%) Other (%)
Low Income 62 6 9 3 3 17
Lower Middle Income 55 10 13 4 3 15
Upper Middle Income 50 15 12 4 4 15
High Income 28 30 11 7 6 18
TABLE 10
Types of Waste
Composition by
Income Level
FIG. 8
Waste Composition
by Income
*Source year: varies, see Annex C on Data Availability.
**Source: By author from global trends, and Annex J.
36. 20 URBAN DEVELOPMENT SERIES – KNOWLEDGE PAPERS
Figure 9. Solid Waste Composition
Source: Current data vary by country.
*Total annual waste volume in millions of tonnes
Others
17%
Other
13%
Other
15%
Other
17%
Metal
6%
Metal
3%
Metal
2%
Metal
3%
Glass
7%
Glass
5%
Glass
3%
Glass
3%
Plastic
11%
Plastic
11%
Plastic
12%
Plastic
8%
Paper
31%
Paper
14%
Paper
9%
Paper
5%
Organic
28%
Organic
54%
Organic
59%
Organic
64%
High Income
Lower Middle
Income
Low Income
CURRENT 2025
Upper Middle
Income
Other
18%
Other
15%
Other
15%
Other
17%
Metal
6%
Metal
4%
Metal
3%
Metal
3%
Glass
7%
Glass
4%
Glass
4%
Glass
3%
Plastic
11%
Plastic
12%
Plastic
13%
Plastic
9%
Paper
30%
Paper
15%
Paper
10%
Paper
6%
Organic
28%
Organic
50%
Organic
55%
Organic
62%
75 MT* 201 MT
243 MT 426 MT
369 MT 956 MT
602 MT 686 MT
FIG. 9
Solid Waste
Composition
by Income
and Year
37. WHAT A WASTE: A GLOBAL REVIEW OF SOLID WASTE MANAGEMENT 21
FIG. 10
Waste Composition
by Region
Other
12%Metal
2%
Glass
4%
Plastic
12%
Paper
16%
Organic
54%
Figure 10. Global Solid Waste Composition
b. EAP Waste Composition
Other
10%Metal
2%
Glass
3%
Plastic
13%
Paper
10%
Organic
62%
a. AFR Waste Composition
Other
13%
Metal
4%
Glass
4%
Plastic
13%
Paper
9%
Organic
57%
d. SAR Composition
Other
37%
Metal
1%
Glass
1% Plastic
7%
Paper
4%
Organic
50%
c. ECA Waste Composition
Other
19%
Metal
5%
Glass
7%
Plastic
8%
Paper
14%
Organic
47
f. OECD Waste Composition
g. LAC Waste Composition
Other
17%
Metal
6%
Glass
7%
Plastic
11%
Paper
32%
Organic
27%
e. MENA Waste Composition
Other
10%
Metal
3%
Glass
3%
Plastic
9%
Paper
14%
Organic
61%
38. 22 URBAN DEVELOPMENT SERIES – KNOWLEDGE PAPERS
Waste Disposal
At a Glance:
` Landfilling and thermal treatment of waste are the most common methods
of MSW disposal in high-income countries.
` Although quantitative data is not readily available, most low- and lower middle-income
countries dispose of their waste in open dumps.
` Several middle-income countries have poorly operated landfills; disposal should
likely be classified as controlled dumping.
Waste disposal data are the most difficult to collect.
Many countries do not collect waste disposal data
at the national level, making comparisons across
income levels and regions difficult. Furthermore,
in cases where data is available, the methodology
of how disposal is calculated and the definitions
used for each of the categories is often either not
known or not consistent. For example, some
countries only give the percentage of waste that is
dumped or sent to a landfill, the rest falls under
‘other’ disposal. In other cases, compostable and
recyclable material is removed before the waste
reaches the disposal site and is not included in
waste disposal statistics. Please refer to Annex H
for MSW disposal data for cities with populations
over 100,000.
Methodology
Waste disposal data was available for 87 countries
through various sources. Annex L presents MSW
disposal methods data by country. Waste disposal
data sets are generally available as percentages of the
various waste disposal options, commonly divided
into the categories shown in Table 10. Although
the definitions and methodologies for calculating
waste disposal methods and quantities are not
always provided or standardized in waste studies,
the disposal of MSW is assumed to be based on wet
weight. Each waste disposal category was calculated
using waste generation figures for the individual
country. The total waste disposal figures by income
and by region were then aggregated.
Figure 11 shows current annual global MSW
disposal for the entire world. These are only
approximate values, given that the data is from
various years.
MSW Disposal by Income
Table 11 shows in further detail how MSW disposal
varies according to country income level.
Figures 12 and 13 illustrate the differences in
MSW disposal methods according to country
income level, in particular low-income and upper
middle-income countries.
0
50
100
150
200
250
300
350
400
OtherCompostDumpWTERecycledLandfill
Figure 11. Total MSW Disposed Worldwide
Disposal Options
AmountDisposed(millionstons/year)
FIG. 11
Total MSW Disposed of Worldwide
Ghabawi landfill, Amman, Jordan
Photo: Perinaz Bhada-Tata
39. WHAT A WASTE: A GLOBAL REVIEW OF SOLID WASTE MANAGEMENT 23
TABLE 11
MSW Disposal
by Income
(million tonnes)
High Income Upper Middle Income
Dumps 0.05 Dumps 44
Landfills 250 Landfills 80
Compost 66 Compost 1.3
Recycled 129 Recycled 1.9
Incineration 122 Incineration 0.18
Other 21 Other 8.4
Low Income Lower Mid dle Income
Dumps 0.47 Dumps 27*
Landfills 2.2 Landfills 6.1
Compost 0.05 Compost 1.2
Recycled 0.02 Recycled 2.9
Incineration 0.05 Incineration 0.12
Other 0.97 Other 18
*This value is relatively high due to the inclusion of China.
40. 24 URBAN DEVELOPMENT SERIES – KNOWLEDGE PAPERS
Figure 12. Low-Income Countries Waste Disposal
Source: Hoornweg 2005
Other
26%
Income
1%
Recycled
0%
Compost
1%
Landfills
59%
Dumps
13%
Figure 13. Upper Middle-Income Countries Waste Disposal
Source: Hoornweg 2005
Other
6%
Income
0%
Recycled
1%
Compost
1%
Landfills
59%
Dumps
33%
Table 12 contrasts the world’s richest (OECD) and
poorest (Africa) regions. Populations in the two
regions are roughly equal, yet the OECD region
produces about 100 times the waste of Africa
(these disparities are parallel to regional differ-
ences in GHG emissions). Africa’s collected waste
is almost exclusively dumped or sent to landfills,
while more than 60% of OECD’s waste is diverted
from landfill.
FIG. 13
Upper Middle-Income Countries Waste Disposal
FIG. 12
Low-Income Countries Waste Disposal
TABLE 12
MSW Disposal
in two contrasting
regions (million
tonnes)
AFR OECD
Dumps 2.3 Dumps —
Landfills 2.6 Landfills 242
Compost 0.05 Compost 66
Recycled 0.14 Recycled 125
Incineration 0.05 Incineration 120
Other 0.11 Other 20
41. 25WHAT A WASTE: A GLOBAL REVIEW OF SOLID WASTE MANAGEMENT
Waste and the Environment
Integrated Solid Waste Management
Integrated solid waste management (ISWM)
reflects the need to approach solid waste in a
comprehensive manner with careful selection and
sustained application of appropriate technology,
working conditions, and establishment of a ‘social
license’ between the community and designated
waste management authorities (most commonly
local government). ISWM is based on both a
high degree of professionalism on behalf of solid
waste managers; and on the appreciation of the
critical role that the community, employees, and
local (and increasingly global) ecosystems have in
effective SWM. ISWM should be driven by clear
objectives and is based on the hierarchy of waste
management: reduce, reuse, recycle — often adding
a fourth ‘R’ for recovery. These waste diversion
options are then followed by incineration and
landfill, or other disposal options. Please refer to
Box 3 for a detailed list describing the components
of an ISWM Plan.
Components of an Integrated Solid Waste Management Plan
An integrated Solid Waste Management plan should
include the following sections:
`` All municipal policies, aims, objectives, and initia-
tives related to waste management;
`` The character and scale of the city, natural condi-
tions, climate, development and distribution of
population;
`` Data on all waste generation, including data
covering both recent years and projections over
the lifetime of the plan (usually 15-25 years). This
should include data on MSW composition and
other characteristics, such as moisture content
and density (dry weight), present and predicted;
`` Identify all proposed options (and combination of
options) for waste collection, transportation, treat-
ment, and disposal of the defined types and quan-
tities of solid wastes (this must address options for
all types of solid waste arising);
`` Evaluation of the Best Practical Environmental
Option(s), integrating balanced assessments of all
technical, environmental, social, and financial issues;
`` The proposed plan, specifying the amount, scale,
and distribution of collection, transportation, treat-
ment and disposal systems to be developed, with
proposed waste mass flows proposed through each;
`` Specifications on the proposed on-going moni-
toring and controls that will be implemented in
conjunction with facilities and practices and ways
in which this information will be regularly reported;
`` Associated institutional reforms and regulatory
arrangements needed to support the plan;
`` Financial assessment of the plan, including anal-
ysis of both investment and recurrent costs associ-
ated with the proposed facilities and services, over
the lifetime of the plan (or facilities);
`` All the sources of finance and revenues associated
with developing and operating the plan including
estimated subsidy transfers and user fees;
`` The requirements for managing all non-MSW
arisings, what facilities are required, who will
provide them and the related services, and how
such facilities and services will be paid for;
`` The proposed implementation plan covering a
period of at least 5-10 years, with an immediate
action plan detailing actions set out for the first
2-3 years;
`` Outline of public consultations carried out during
preparation of the plan and proposed in future;
`` Outline of the detailed program to be used to site
key waste management facilities, e.g. landfills,
compost plants, and transfer stations.
`` An assessment of GHG emissions and the role of
MSW in the city’s overall urban metabolism.
BOX3
42. As outlined by the Dutch NGO, WASTE, ISWM
is based on four principles: equity for all citizens
to have access to waste management systems for
public health reasons; effectiveness of the waste
management system to safely remove the waste;
efficiency to maximize benefits, minimize costs, and
optimize the use of resources; and sustainability
of the system from a technical, environmental,
social (cultural), economic, financial, institutional,
and political perspective (van de Klundert and
Anschütz 2001).
There are three interdependent and intercon-
nected dimensions of ISWM, which need to
be addressed simultaneously when designing a
solid waste management system: stakeholders,
elements, and aspects. Please refer to Box 4 for
further details on the interconnected dimensions
of ISWM.
AnalternativeframeworkisprovidedbyUN-HABITAT,
which identifies three key system elements in ISWM:
public health, environmental protection, and resource
management (UN-Habitat 2009).
Public Health: In most jurisdictions, public
health concerns have been the basis for solid
waste management programs, as solid waste
management is essential to maintaining public
health. Solid waste that is not properly collected
and disposed can be a breeding ground for insects,
vermin, and scavenging animals, and can thus
pass on air- and water-borne diseases. Surveys
conducted by UN-Habitat show that in areas where
waste is not collected frequently, the incidence of
diarrhea is twice as high and acute respiratory
infections six times higher than in areas where
collection is frequent (UN-Habitat 2009).
Environmental Protection: Poorly collected
or improperly disposed of waste can have a detri-
mental impact on the environment. In low- and
middle-income countries, MSW is often dumped in
low-lying areas and land adjacent to slums. Lack
of enforced regulations enables potentially infec-
tious medical and hazardous waste to be mixed
with MSW, which is harmful to waste pickers and
the environment. Environmental threats include
contamination of groundwater and surface water
BOX4Integrated Sustainable Waste Management Framework
Stakeholders: include individuals or groups that
have an interest or roles. All stakeholders should be
identified and where practical involved in creating a
SWM program.
Elements (Process): include the technical aspects
of solid waste management. All stakeholders impact
one or more of the elements. The elements need to
be considered simultaneously when creating an SWM
program in order to have an efficient and effective
system.
Aspects (Policies and Impacts): encompass
the regulatory, environmental and financial realities
in which the waste management system operates.
Specific aspects can be changeable, e.g. a community
increases influence or environmental regulations are
tightened. Measures and priorities are created based
on these various local, national and global aspects.
Generation and Separation
Collection
Transfer
Treatment and Disposal
Recovery
3 R’s
Local/Regulatory Authorities
NGOs/CBOs
Service Users
Informal/Formal Sector
Donor Agencies
Stakeholders
Elements Aspects
Environmental
Political/Legal
Institutional
Socio-Cultural
Financial/Economic
Technical
and Performance
Sustainab
ility
Adapted from van de Klundert and Anschütz 2001.Adapted from van de Klundert and Anschütz 2001.
26
43. WHAT A WASTE: A GLOBAL REVIEW OF SOLID WASTE MANAGEMENT 27
by leachate, as well as air pollution from burning
of waste that is not properly collected and disposed.
Resource Management: MSW can represent a
considerable potential resource. In recent years,
the global market for recyclables has increased
significantly. The world market for post consumer
scrap metal is estimated at 400 million tonnes
annually and around 175 million tonnes annually
for paper and cardboard (UN-Habitat 2009). This
represents a global value of at least $30 billion per
year. Recycling, particularly in low- and middle-
income countries, occurs through an active,
although usually informal, sector. Producing new
products with secondary materials can save signif-
icant energy. For example, producing aluminum
from recycled aluminum requires 95% less energy
than producing it from virgin materials. As the
cost of virgin materials and their environmental
impact increases, the relative value of secondary
materials is expected to increase.
Waste Disposal Options
The waste management sector follows a generally
accepted hierarchy. The earliest known usage of
the ‘waste management hierarchy’ appears to be
Ontario’s Pollution Probe in the early 1970s. The
hierarchy started as the ‘three Rs’ — reduce, reuse,
recycle — but now a fourth R is frequently added
— recovery. The hierarchy responds to financial,
environmental, social and management consid-
erations. The hierarchy also encourages minimi-
zation of GHG emissions. See Figure 14 for the
waste hierarchy.
Least preferred option
Most preferred option
Waste Disposal
Waste Diversion
*As a minimum, waste should be disposed at a “controlled dump,” which includes site selection,
controlled access, and where practical, compaction of waste. Incineration requires a complimentary
sanitary landfill, as bottom ash, non-combustibles and by-passed waste needs to be landfilled.
Reduce
Reuse
Recycle
Recover
(digestion, composting)
Landfill
Incineration
(with energy recovery)
Controlled Dump*
FIG. 14
Waste Hierarchy
44. 28 URBAN DEVELOPMENT SERIES – KNOWLEDGE PAPERS
1. Waste Reduction: Waste or source reduction
initiatives (including prevention, minimi-
zation, and reuse) seek to reduce the quantity
of waste at generation points by redesigning
products or changing patterns of production
and consumption. A reduction in waste
generation has a two-fold benefit in terms of
greenhouse gas emission reductions. First,
the emissions associated with material and
product manufacture are avoided. The second
benefit is eliminating the emissions associated
with the avoided waste management activities.
2. Recycling and Materials Recovery: The
key advantages of recycling and recovery are
reduced quantities of disposed waste and the
return of materials to the economy. In many
developing countries, informal waste pickers
at collection points and disposal sites recover
a significant portion of discards. In China, for
example, about 20% of discards are recovered
for recycling, largely attributable to informal
waste picking (Hoornweg et al 2005). Related
GHG emissions come from the carbon dioxide
associated with electricity consumption for
the operation of material recovery facilities.
Informal recycling by waste pickers will have
little GHG emissions, except for processing
the materials for sale or reuse, which can be
relatively high if improperly burned, e.g. metal
recovery from e-waste.
3. Aerobic Composting and Anaerobic
Digestion: Composting with windrows
or enclosed vessels is intended to be an
aerobic (with oxygen) operation that avoids
the formation of methane associated with
anaerobic conditions (without oxygen).
When using an anaerobic digestion process,
organic waste is treated in an enclosed vessel.
Often associated with wastewater treatment
facilities, anaerobic digestion will generate
methane that can either be flared or used to
generate heat and/or electricity. Generally
speaking, composting is less complex, more
forgiving, and less costly than anaerobic
Maputo – Fapel,
paper mill and paper
recycling factory
Photo: Eric Miller/World Bank
45. WHAT A WASTE: A GLOBAL REVIEW OF SOLID WASTE MANAGEMENT 29
digestion. Methane is an intended by-product
of anaerobic digestion and can be collected
and combusted. Experience from many
jurisdictions shows that composting source
separated organics significantly reduces
contamination of the finished compost, rather
than processing mixed MSW with front-end or
back-end separation.
4. Incineration: Incineration of waste (with
energy recovery) can reduce the volume of
disposed waste by up to 90%. These high
volume reductions are seen only in waste
streams with very high amounts of packaging
materials, paper, cardboard, plastics and
horticultural waste. Recovering the energy
valueembeddedinwastepriortofinaldisposal
is considered preferable to direct landfilling —
assuming pollution control requirements and
costs are adequately addressed. Typically,
incineration without energy recovery (or
non-autogenic combustion, the need to
regularly add fuel) is not a preferred option
due to costs and pollution. Open-burning
of waste is particularly discouraged due
to severe air pollution associated with low
temperature combustion.
5. Landfill: The waste or residue from other
processesshouldbesenttoadisposalsite.Landfills
are a common final disposal site for waste and
should be engineered and operated to protect
the environment and public health. Landfill gas
(LFG), produced from the anaerobic decompo-
sition of organic matter, can be recovered and
the methane (about 50% of LFG) burned with
or without energy recovery to reduce GHG
emissions. Proper landfilling is often lacking,
especially in developing countries. Landfilling
usuallyprogressesfromopen-dumping,controlled
dumping, controlled landfilling, to sanitary
landfilling (see Table 13).
Waste and Climate Change
GHG emissions from MSW have emerged as a
major concern as post-consumer waste is estimated
to account for almost 5% (1,460 mtCO2
e) of total
global greenhouse gas emissions. Solid waste also
includes significant embodied GHG emissions. For
example, most of the GHG emissions associated
with paper occur before it becomes MSW. Encour-
aging waste minimization through MSW programs
can therefore have significant up-stream GHG
minimization benefits.
TABLE 13
Landfill
Classifications
Operation and Engineering Measures Leachate Management Landfill Gas Management
Semi-controlled Dumps Few controls; some directed placement
of waste; informal waste picking; no
engineering measures
Unrestricted contaminant
release
None
Controlled Dump Registration and placement/compaction
of waste; surface water monitoring; no
engineering measures
Unrestricted contaminant
release
None
Engineered Landfill/
Controlled Landfill
Registration and placement/compaction
of waste; uses daily cover material;
surface and ground water monitoring;
infrastructure and liner in place
Containment and some level of
leachate treatment; reduced
leachate volume through
waste cover
Passive ventilation or flaring
Sanitary Landfill Registration and placement/compaction
of waste; uses daily cover; measures
for final top cover and closure; proper
siting, infrastructure; liner and leachate
treatment in place and post-closure plan.
Containment and leachate
treatment (often biological
and physico-chemical
treatment)
Flaring with or without
energy recovery
46. 30 URBAN DEVELOPMENT SERIES – KNOWLEDGE PAPERS
Methane from landfills represents 12% of total
global methane emissions (EPA 2006b). Landfills
are responsible for almost half of the methane
emissions attributed to the municipal waste sector
in 2010 (IPCC 2007).4
The level of methane from
landfills varies by country, depending on waste
composition, climatic conditions (ambient temper-
ature, precipitation) and waste disposal practices.
Table 14 highlights some examples.
Organic biomass5
decomposes anaerobically in a
sanitary landfill. Landfill gas, a by-product of the
anaerobic decomposition is composed of methane
(typically about 50%) with the balance being
carbon dioxide and other gases. Methane, which
4
Wastewater management adds an equal amount of methane to the atmosphere.
5
Organic biomass excludes organic waste such as plastics that are derived
from fossil energy sources.
has a Global Warming Potential 21 times greater
than carbon dioxide, is the second most common
greenhouse gas after carbon dioxide.
Greenhousegasemissionsfromwastemanagement
can readily be reduced. Within the European
Union, the rate of GHG emissions from waste has
declined from 69 mtCO2
e per year to 32 million
tCO2
e per year from 1990 to 2007 (ISWA 2009).
Greenhouse Gas Mitigation
Opportunities
Efforts to reduce emissions from the municipal
solid waste sector include generating less waste,
improving the efficiency of waste collection,
expanding recycling, methane avoidance (aerobic
composting, anaerobic digestion with combustion
TABLE 14
Landfill Methane
Emissions and Total
GHG Emissions for
Selected Countries
Country
Methane Emissions from
Post-Consumer Municipal
Waste Disposa* (MtCO2
e)
Greenhouse Gas Emissions**
(CO2
, CH4
, N2
O) (MtCO2
e)
% Methane from Disposal
Sites Relative
to Total GHG Emissions
Brazil 16 659 2.4%
China 45 3,650 1.2%
India 14 1,210 1.1%
Mexico 31 383 8.1%
South Africa 16 380 4.3%
*EPA 2006a.
**UNFCCC 2005.
A transfer
station
in Amman,
Jordan
Photo:PerinazBhada-Tata
47. WHAT A WASTE: A GLOBAL REVIEW OF SOLID WASTE MANAGEMENT 31
of produced methane and capture, treatment
and use of landfill gas). Energy generated from
methane combustion can displace other fossil fuels
either as a process energy resource or as electricity.
Suitable technology options by waste management
component are provided in Table 15.
Policy Recommendations
for Reducing GHG Emissions
Governments have a range of policy options to
encourage waste management practices that will
reducegreenhousegasemissions.Practicalapproaches
that could be applied in most cities include:
` Public education to inform people about their
options to reduce waste generation and increase
recycling and composting.
` Pricing mechanisms, such as product charges
can stimulate consumer behavior to reduce
waste generation and increase recycling. A
product charge is a cost assessment added to the
price of a product and is tied to the cost of the
desired waste management system. Consumers
would pay for the waste management service
when they buy the product. The fees collected
would be directed to municipalities relative to the
waste generated. An example of this economic
mechanism is an excise tax on tires assessed
by most states in the US. Product charges are a
policy mechanism often better implemented by
regional or national governments.
` Another pricing mechanism well suited to
urban areas is user charges tied to quantity
of waste disposed. Consumers who separate
recyclables pay a lower fee for waste disposal.
This pricing policy can work well in locations
where waste collection is from individual
households so that waste quantities for disposal
can be readily monitored. However, it may
not be practical in many areas in developing
countries, particularly in those where there are
communal collection points associated with
multi-unit households (such as apartment user
charges tied to quantity or volume).
` Preferential procurement policies and pricing
to stimulate demand for products made with
recycled post-consumer waste. Use of compost in
public parks and other property owned by cities.
TABLE 15
Technical GHG
Mitigation
Opportunities by
Waste Management
Component
Waste Management Component Technology Options
Waste Reduction Design of longer-lasting and reusable products; reduced consumption.
Waste Collection Use of alternative, non-fossil fuels (bio-fuel, natural gas).
Recycling/Materials Recovery Materials recovery facility (MRF) to process source separated materials or mixed waste,
although source separated is the preferred option as the materials would have less
contamination from other discards.
MRFs use a combination of manual and mechanical sorting options. Waste pickers could be used
as a source of labor for manual sorting stages.
Composting/Anaerobic Digestion Institute composting programs ideally with source separated organics. As with recyclables source
separated materials reduce the contamination associated with recovery from mixed waste.
Compost the organic material after digestion to produce a useful soil conditioner and avoid
landfill disposal. Finished compost applied to soils is also an important method to reduce GHG
emissions by reducing nitrogen requirements and associated GHG emissions.
Incineration/Waste-to-energy/
Refuse–Derived Fuel (RDF)
Use the combustible fraction of waste as a fuel either in a dedicated combustion facility
(incineration) with or without energy recovery or as RDF in a solid fuel boiler.
Landfill Capture the methane generated in disposal sites and flare or use as a renewable energy resource.
48. 32 URBAN DEVELOPMENT SERIES – KNOWLEDGE PAPERS
A Note on the Reliability of Solid Waste Data
Solid waste data should be considered with a degree
of caution due to global inconsistencies in definitions,
data collection methodologies, and completeness.
The reliability of the data is influenced by:
`` Undefined words or phrases
`` Inconsistent or omitted units
`` Dates, methodologies, or sources of data not
indicated
`` Estimates made without basis
`` Incomplete or inconsistent data (please see
Annexes C and D for further information on
available data)
`` Information collected at a non-representative
moment
In most low- and middle-income countries, the
reliabilityofsolidwastedataisfurthercompromised
by large seasonal variations (e.g. seasonal rains and
un-containerized waste, horticultural variations),
incomplete waste collection and disposal (e.g. a
significant level of waste is disposed directly through
local burning or thrown in waterways and low lying
areas), and a lack of weight scales at landfill sites to
record waste quantities.
Rarely is it disclosed at what stage the waste gener-
ation rates and composition were determined, and
whether they were estimated or physically measured.
The most accurate method measures the waste
generated at source before any recycling, composting,
burning, or open dumping takes place. However,
the generation rate and composition are commonly
calculated using waste quantities arriving at the final
disposal site. This method of measurement does not
fully represent the waste stream because waste can be
diverted prior to final disposal, especially in low- and
middle-income countries where the informal sector
removes a large fraction of recyclables. Additionally,
in most low- and middle-income countries, waste
collection rates are low and formal service does not
extend to all communities, thereby reducing the
quantities of waste delivered to final disposal sites.
Measuring waste quantities for final disposal is
practical for municipal purposes. Large variation in
waste quantity and composition can be observed if
the economic situation changes, yet growing waste
quantities associated with increasing GNP are not
necessarily a true reflection of increased waste; they
might be changes in the relative recoverable value of
the secondary materials and improvements in overall
collection efficiency.
Waste composition specifies the components of the
waste stream as a percentage of the total mass or
volume. The component categories used within
this report are:
`` organics (i.e. compostables such as food, yard,
and wood wastes)
`` paper
`` plastic
`` glass
`` metal
`` others (includes ceramics, textiles, leather,
rubber, bones, inerts, ashes, coconut husks,
bulky wastes, household goods)
‘Others’ wastes should be differentiated into two
categories: other-residue and other-consumer
products. Other-residue is made up of ash, inerts,
dirt, and sweepings and is a significant component
of the waste stream in low- and middle-income
countries. Other-consumer products consist of
49. WHAT A WASTE: A GLOBAL REVIEW OF SOLID WASTE MANAGEMENT 33
bulky wastes, household appliances, electronics,
and multi-material packaging (e.g., tetrapaks and
blister packaging). This waste stream is much
more significant in high-income countries and
differs from other-residue in that the volumes
are much higher per kilogram of waste and are
generally combustible.
It is important to cite whether the percentages are
given on a dry or wet basis, because component
percentages will differ markedly depending on
moisture content. Rarely is it indicated within a
waste study whether the percentage is on a wet
or dry basis, or based on volume or mass. It is
assumed that the composition was determined
on a wet basis. Probably both mass and volume
measurements were used depending upon the
country. Low- and middle-income countries would
be more inclined to use volume since it does not
require sophisticated measuring equipment and
can be estimated. High-income countries usually
use mass as a basis since they have greater funding
resources and support to complete a more accurate
waste characterization.
Another major inconsistency among the various
waste studies is the use of imperial units versus
metric units. Frequently the imperial ton and the
metric tonne are interchanged when reporting
waste quantities. Data are also denoted by the letter
“t” to denote the unit, causing the true value to be
unknown. Within this report, all of the units are
metric, unless clearly noted. Waste densities and
moisture contents are needed to convert data to a
common frame of reference for comparison (e.g.
from mass to volume and from wet to dry). Usually
the higher the percentage of organic matter, the
higher the moisture content and often the higher
the density of the waste stream.
There are major efforts being done to correct
data inconsistencies at the city level. So far, there
is no single standard or comprehensive system
to measure and monitor city performance and
urban quality of life. In response to this need, the
Global City Indicators Program (GCIP), based in
Toronto, has been developed. The GCIP (please
see Annex O) provides a practical means for cities
to collect credible information on MSW.
Bangalore,
India
Photo:CyrusTata
50. A couple salvage old bricks
from an area demolished
for renovation in Saigon
Photo: Tran Thi Hoa