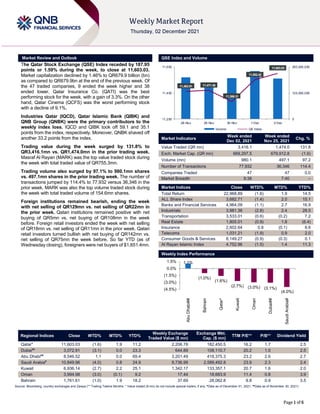
The QSE Index declined 1.59% over the week to close at 11,603.03 points. Trading volume and value surged significantly. Industries Qatar, Qatar Islamic Bank, and QNB Group were the top contributors to the weekly index loss. Foreign investors remained bearish while Qatari institutions were net buyers. The Cabinet approved allowing 100% foreign ownership of four major banks and establishing a new real estate authority. Masraf Al Rayan completed its legal merger with Al Khaliji Commercial Bank.
QNBFS Daily Market Report December 5, 2018QNB Group
The QSE Index rose 1.4% led by gains in the Real Estate and Banks & Financial Services indices. Masraf Al Rayan and Doha Bank were the top gainers rising 5.2% and 4.5% respectively, while Qatar Oman Investment Company fell 2.5%. Regional markets were mixed with Abu Dhabi rising 2.7% and Saudi Arabia falling 0.1%. Globally, UK construction PMI rose to 53.4 in November and Eurozone PPI rose 0.8% month-on-month and 4.9% year-on-year in October.
QNBFS Daily Market Report November 23, 2020QNB Group
The QE Index rose 0.9% to close at 10,202.8. Gains were led by the Banks & Financial Services and Transportation indices, gaining 2.1% and 1.7%, respectively.
The QE index in Qatar rose 0.2% led by gains in the industrial and banking indices. Gulf International Services and Qatar German Co. for Med. Dev. were the top gainers rising 2% and 1.6% respectively, while Qatar Industrial Manufacturing fell 1.8%. Trading volume declined 49.8% from the previous day. In company news, Qatar Holding purchased NYSE Euronext's 12% stake in the Qatar Exchange, and the Commercial Bank of Qatar acquired a further 3.4% stake in Alternatifbank.
QNBFS Daily Market Report January 11, 2022QNB Group
The document provides an intra-day market commentary and summary for the Qatari, GCC and global markets. Specifically:
- The QE Index in Qatar rose 0.4% led by gains in the Transportation and Industrials indices. Gulf International Services and Islamic Holding Group were the top gainers.
- Saudi Arabia's TASI index gained 0.9% led by the Media and Commercial sectors. Dubai's DFM index gained 0.3% while Abu Dhabi's ADX declined 0.3%. Kuwait and Oman's indices also ended higher.
- Regional indices were mixed with Qatar gaining while Abu Dhabi declined. Trading values declined in Qatar but rose
The QE index in Qatar rose 0.2% led by gains in the insurance and industrial indices. Islamic Holding Group and Gulf International Services were the top gainers rising 10% and 7.1% respectively. Mesaieed Petrochemical declined 4.1%. Regional indices were mixed with Saudi Arabia down 0.4% while Dubai rose 2.7%. In Qatar news, deposit growth outpaced loan growth in February and the country is expected to sign $50 billion in construction contracts in 2014 for World Cup infrastructure. The $6.5 billion Al Karaana petrochemical project is targeting Asian markets.
The QSE Index in Qatar gained 0.1% on the day. Gains were led by the Real Estate and Banks & Financial Services indices. QNB Group and Barwa Real Estate Co. were the top gainers while Qatar Islamic Bank fell the most. Overall trading activity was lower than the 30-day average. In other GCC markets, indices fell in Saudi Arabia, Dubai, Abu Dhabi, Kuwait, Oman and Bahrain. Global economic data showed mixed results with UK public finances improving but foreign direct investment into China declining more than expected.
The QSE Index declined 1.9% on higher selling pressure from Qatari shareholders. Islamic Holding Group and Gulf International Services were the top losers, falling 10.0% and 6.2% respectively. Volume of shares traded fell 34.2% to 16.3mn. Ratings agencies Fitch downgraded the outlook on three Bahraini banks to negative. Global economic data was mixed with US personal income and spending rising but French consumer spending declining.
The QSE Index declined 1.1% led by losses in the Telecom and Real Estate indices. Qatar Industrial Manufacturing Co. and Qatar Gas Transport Co. were the top losers, falling 6.3% and 5.6% respectively. Among gainers, Qatar General Insurance & Reins. Co. rose 4.9%. Trading volume fell 35.9% compared to the previous day. Fitch upgraded 7 Qatari banks' ratings due to changed support assessment.
The Qatar Exchange Index gained 2.25% over the week to close at 10,109.50 points. Trading value and volume increased substantially compared to the prior week. Al Khalij Commercial Bank was the best performing stock, up 11.79% for the week. Emerging markets remain under pressure from the potential tapering of US quantitative easing programs, which could slow global growth. Regional markets have fared better than emerging markets in recent weeks.
QNBFS Daily Market Report September 22, 2020QNB Group
The document summarizes stock market activity in Qatar and other GCC countries on September 21, 2020. The QE Index in Qatar declined 1.5% led by declines in the real estate and transportation sectors. Top losers were Qatari German Company for Medical Devices and Qatar First Bank. In other GCC countries, stock markets were mixed with gains in Kuwait and losses elsewhere. Regional indices, volumes and other market indicators are also summarized.
The QE Index rose 2.7% to close at 14,476.5. Gains were led by the Banks & Financial Services and Industrials indices, gaining 3.9% and 1.3%, respectively.
QNBFS Daily Market Report January 26, 2022QNB Group
The QE Index rose 0.2% to close at 12,548.5. Gains were led by the Transportation and Banks & Financial Services indices, gaining 1.3% and 0.3%, respectively.
The QE Index rose 2.5% to close at 13,272.4. Gains were led by the Banks & Financial Services and Telecoms indices, gaining 4.7% and 1.7%, respectively.
QNBFS Daily Market Report February 21, 2022QNB Group
The QE Index declined 0.5% to close at 12,668.1. Losses were led by the Consumer Goods & Services and Banks & Financial Services indices, falling 0.9% and 0.7%, respectively.
QNBFS Daily Market Report October 19, 2021QNB Group
The QE Index declined 0.1% to close at 11,743.4. Losses were led by the Industrials and Banks & Financial Services indices, falling 0.5% and 0.1%, respectively.
The daily market report provided an overview of market activity in Qatar, GCC countries, and global economic data. In Qatar, the QE Index rose 2.3% led by gains in banks and transportation stocks. Volume traded increased 120.9% from the previous day. QNB Group and Salam International were the top gainers while Ahli Bank fell the most. In other GCC countries, stock markets in Saudi Arabia, Dubai, and Abu Dhabi rose while Kuwait's market was closed. Earnings releases were provided for companies in Saudi Arabia, Dubai, and India. The earnings calendar listed upcoming earnings dates for Qatari companies.
2 June 2013: The QE index gained marginally to close at 9,239.2. Gains were led by the Transportation and Telecoms indices, gaining 3.6% and 1.8% respectively. Top gainers were Qatar Navigation and Qatar Gas Transport Co., rising 4.7% and 3.6% respectively. Among the top losers, Islamic Holding Group fell 2.6%, while QNB Group declined 2.5%
The QE Index rose 0.4% to close at 9,252.1. Gains were led by the Consumer Goods & Services and Banks & Financial Services indices, gaining 1.1% and 0.6%, respectively.
The QSE Index lost 0.58% over the week to close at 12,443.49 points. Trading value increased 16.27% to QR3.16 billion due to increased activity in the Real Estate sector. ERES was the top traded stock by value and volume. Foreign institutions remained net buyers while Qatari investors were net sellers.
The QE Index gained 0.57% over the week to close at 9,298.75 points, while market capitalization rose 0.61% to QR512.2 billion. Trading value decreased 29.22% to QR1,290.7 million as volume fell 41.77% to 28.3 million shares. Islamic Holding Group was the best performer, up 12.83%, while Qatar Cinema & Film Distribution declined the most at 8.80%. Regional markets were mixed, with Qatar outperforming declines in Dubai and Abu Dhabi. Foreign investors remained net sellers of QR100 million for the week.
QNBFS Weekly Market Report January 21, 2021QNB Group
The QSE Index lost 1.63% last week, with market capitalization decreasing by 0.9%. Of the 48 listed companies, 18 ended higher while 28 fell and 2 remained unchanged. Masraf Al Rayan, Qatar Islamic Bank, and QNB Group were the primary contributors to the weekly index losses. Trading value and volume both decreased last week. MARK reported a 2.2% YoY decline in net profit for 4Q2020, below estimates, while QIBK's net profit rose 1.0% YoY, in line with estimates. The market and corporate news provided updates on upcoming AGMs and bond issues from QNB Group and QIBK's financial results and dividend proposal.
The QE Index gained 1.88% over the week to close at 9,761.03 points. Trading value decreased 12.01% to QR1.27 billion, while volume increased 12.82% to 30.8 million shares. Foreign institutions turned bullish with net buying of QR42 million, while local institutions were net sellers of QR4.7 million. The document provides forecasts for key QE companies' third quarter 2013 earnings per share and notes most medium-sized banks will propose a combination of cash and stock dividends for fiscal year 2013.
The Qatar Exchange Index lost 2.94% over the week to close at 9,580.77 points, as market capitalization decreased by 2.85% to QR522 billion. Of the 42 listed companies, 8 increased while 32 declined and 2 remained unchanged. Trading value decreased 17.39% to QR1.4 billion while trading volume fell 36.38% to 27.3 million shares. Foreign institutions were net sellers of QR103.7 million worth of equities. We remain positive on the long-term outlook for Qatari equities and recommend accumulating strong companies on dips.
The QSE Index gained 0.46% over the week to close at 11,347.15, with market capitalization increasing slightly to QR598.9 billion. Trading value rose 1.51% to QR2.34 billion, led by the Banks and Financial Services sector. Trading volume increased 6.88% to 57.9 million shares, led by the Real Estate sector. Foreign institutions turned bullish and net bought QR384.9 million worth of stocks, while Qatari institutions net sold QR211.7 million worth.
The Qatar Stock Exchange Index gained 0.75% over the week to close at 11,858.01 points. Trading value increased by 14.67% to reach QR1.01 billion compared to the prior week. The Banks and Financial Services sector accounted for the largest portion of trading value and volume. Several companies reported quarterly earnings results, with MERS posting higher quarterly profit but QOIS and QISI seeing large declines in net income. Major projects were also announced, including a QR1.8 billion financing agreement for logistics infrastructure and a QR2.2 billion deal to support a water reservoir project.
- The QSE Index lost 1.76% over the week to close at 11,879.56 points as market capitalization decreased by 2%. Trading value and volume also declined significantly week-over-week.
- QNBK, IQCD, and QEWS were the largest drags on the index, while BRES and ERES contributed positively. Foreign investors remained bearish last week while Qatari investors were bullish.
- The Qatari economy is expected to remain robust driven by government spending on infrastructure projects despite lower oil prices. GDP growth is forecast to be around 6.5% over the next two years.
The QE Index gained 0.90% over the week to close at 10,375.06 points. Trading value decreased 11.79% to QR2.3 billion, while volume declined 1.94% to 80.4 million shares. Regional indices were mixed, with Dubai up 1.9% and Kuwait down 0.7%. Doha Bank plans to raise QR2 billion in Tier 1 capital, while Commercial Bank of Qatar received approval to raise QR2 billion in additional Tier 1 capital. Ooredoo priced a $1.25 billion sukuk issue.
QNBFS Weekly Market Report January 5, 2016QNB Group
The Qatar Stock Exchange Index gained 2.69% over the week to close at 10,717.34 points. Trading value increased 16.4% to QR1.1 billion, while trading volume decreased 4.5% to 39.2 million shares. Ezdan Holding, Masraf Al Rayan and Qatar Insurance Co. were the top contributors to the weekly index gain, while Commercial Bank of Qatar deducted points. Foreign institutions remained net buyers during the week at QR175.7 million.
QNBFS Daily Market Report December 24, 2023QNB Group
The QE Index rose 0.8% to close at 10,285.3. Gains were led by the Transportation and Banks & Financial Services indices, gaining 1.4% and 1.2%, respectively.
QNBFS Daily Technical Trader Qatar - October 10, 2023 التحليل الفني اليومي لب...QNB Group
The document provides a daily technical analysis of the QE Index and QATAR INSURANCE CO stock. For the QE Index, it notes the index remains in a downtrend but is approaching a support level of 9,700, where long positions could be taken. It provides expected resistance and support levels. For QATAR INSURANCE CO stock, it notes the stock has not fallen as much as others and the uptrend remains intact above moving averages, though liquidity is low. It provides expected price targets and resistance/support levels for the stock. Definitions of technical analysis terms like candlesticks, support, and simple moving average are also included.
QNBFS Daily Market Report October 04, 2023QNB Group
The QE Index rose 0.2% to close at 10,273.3. Gains were led by the Transportation and Consumer Goods & Services indices, gaining 1.7% and 0.1%, respectively.
QNBFS Daily Technical Trader Qatar - October 04, 2023 التحليل الفني اليومي لب...QNB Group
The General Index failed to sustain its breakout above the double-bottom formation’s neckline and continued with its decline into the formation’s territory.
QNBFS Daily Technical Trader Qatar - September 28, 2023 التحليل الفني اليومي ...QNB Group
The General Index failed to sustain its breakout above the double-bottom formation’s neckline and continued with its decline into the formation’s territory.
QNBFS Daily Market Report September 24, 2023QNB Group
- The QE Index in Qatar rose 0.3% led by gains in the Transportation and Industrials indices. Qatar Navigation and Al Khaleej Takaful Insurance were the top gainers.
- Regional markets were mixed with Saudi Arabia down 1% but Abu Dhabi up marginally. Economic data from the US and Europe was mixed.
- In Qatar news, QR500mn in bills were sold at a yield of 5.755% and Gulf International Services approved final merger agreements. Ooredoo also signed an MoU to support businesses in Qatar free zones.
QNBFS Daily Technical Trader Qatar - September 24, 2023 التحليل الفني اليومي ...QNB Group
The General Index failed to sustain its breakout above the double-bottom formation’s neckline and continued with its decline into the formation’s territory.
QNBFS Daily Technical Trader Qatar - September 19, 2023 التحليل الفني اليومي ...QNB Group
The General Index failed to sustain its breakout above the double-bottom formation’s neckline and continued with its decline into the formation’s territory.
QNBFS Daily Market Report September 17, 2023QNB Group
The QE Index declined 0.5% to close at 10,319.3. Losses were led by the Industrials and Consumer Goods & Services indices, falling 1.4% and 1.1%, respectively.
QNBFS Daily Technical Trader Qatar - September 07, 2023 التحليل الفني اليومي ...QNB Group
The General Index failed to
sustain its breakout above the
double-bottom formation’s
neckline and continued with
its decline into the
formation’s territory.
Seminar: Gender Board Diversity through Ownership NetworksGRAPE
Seminar on gender diversity spillovers through ownership networks at FAME|GRAPE. Presenting novel research. Studies in economics and management using econometrics methods.
OJP data from firms like Vicinity Jobs have emerged as a complement to traditional sources of labour demand data, such as the Job Vacancy and Wages Survey (JVWS). Ibrahim Abuallail, PhD Candidate, University of Ottawa, presented research relating to bias in OJPs and a proposed approach to effectively adjust OJP data to complement existing official data (such as from the JVWS) and improve the measurement of labour demand.
"Does Foreign Direct Investment Negatively Affect Preservation of Culture in the Global South? Case Studies in Thailand and Cambodia."
Do elements of globalization, such as Foreign Direct Investment (FDI), negatively affect the ability of countries in the Global South to preserve their culture? This research aims to answer this question by employing a cross-sectional comparative case study analysis utilizing methods of difference. Thailand and Cambodia are compared as they are in the same region and have a similar culture. The metric of difference between Thailand and Cambodia is their ability to preserve their culture. This ability is operationalized by their respective attitudes towards FDI; Thailand imposes stringent regulations and limitations on FDI while Cambodia does not hesitate to accept most FDI and imposes fewer limitations. The evidence from this study suggests that FDI from globally influential countries with high gross domestic products (GDPs) (e.g. China, U.S.) challenges the ability of countries with lower GDPs (e.g. Cambodia) to protect their culture. Furthermore, the ability, or lack thereof, of the receiving countries to protect their culture is amplified by the existence and implementation of restrictive FDI policies imposed by their governments.
My study abroad in Bali, Indonesia, inspired this research topic as I noticed how globalization is changing the culture of its people. I learned their language and way of life which helped me understand the beauty and importance of cultural preservation. I believe we could all benefit from learning new perspectives as they could help us ideate solutions to contemporary issues and empathize with others.
Understanding how timely GST payments influence a lender's decision to approve loans, this topic explores the correlation between GST compliance and creditworthiness. It highlights how consistent GST payments can enhance a business's financial credibility, potentially leading to higher chances of loan approval.
Independent Study - College of Wooster Research (2023-2024) FDI, Culture, Glo...AntoniaOwensDetwiler
"Does Foreign Direct Investment Negatively Affect Preservation of Culture in the Global South? Case Studies in Thailand and Cambodia."
Do elements of globalization, such as Foreign Direct Investment (FDI), negatively affect the ability of countries in the Global South to preserve their culture? This research aims to answer this question by employing a cross-sectional comparative case study analysis utilizing methods of difference. Thailand and Cambodia are compared as they are in the same region and have a similar culture. The metric of difference between Thailand and Cambodia is their ability to preserve their culture. This ability is operationalized by their respective attitudes towards FDI; Thailand imposes stringent regulations and limitations on FDI while Cambodia does not hesitate to accept most FDI and imposes fewer limitations. The evidence from this study suggests that FDI from globally influential countries with high gross domestic products (GDPs) (e.g. China, U.S.) challenges the ability of countries with lower GDPs (e.g. Cambodia) to protect their culture. Furthermore, the ability, or lack thereof, of the receiving countries to protect their culture is amplified by the existence and implementation of restrictive FDI policies imposed by their governments.
My study abroad in Bali, Indonesia, inspired this research topic as I noticed how globalization is changing the culture of its people. I learned their language and way of life which helped me understand the beauty and importance of cultural preservation. I believe we could all benefit from learning new perspectives as they could help us ideate solutions to contemporary issues and empathize with others.
Falcon stands out as a top-tier P2P Invoice Discounting platform in India, bridging esteemed blue-chip companies and eager investors. Our goal is to transform the investment landscape in India by establishing a comprehensive destination for borrowers and investors with diverse profiles and needs, all while minimizing risk. What sets Falcon apart is the elimination of intermediaries such as commercial banks and depository institutions, allowing investors to enjoy higher yields.
[4:55 p.m.] Bryan Oates
OJPs are becoming a critical resource for policy-makers and researchers who study the labour market. LMIC continues to work with Vicinity Jobs’ data on OJPs, which can be explored in our Canadian Job Trends Dashboard. Valuable insights have been gained through our analysis of OJP data, including LMIC research lead
Suzanne Spiteri’s recent report on improving the quality and accessibility of job postings to reduce employment barriers for neurodivergent people.
Decoding job postings: Improving accessibility for neurodivergent job seekers
Improving the quality and accessibility of job postings is one way to reduce employment barriers for neurodivergent people.
Using Online job postings and survey data to understand labour market trends
QNBFS Weekly Market Report December 02, 2021
1. ```````
Page 1 of 6
Market Review and Outlook QSE Index and Volume
The Qatar Stock Exchange (QSE) Index receded by 187.95
points or 1.59% during the week, to close at 11,603.03.
Market capitalization declined by 1.46% to QR679.9 billion (bn)
as compared to QR679.9bn at the end of the previous week. Of
the 47 traded companies, 9 ended the week higher and 38
ended lower. Qatar Insurance Co. (QATI) was the best
performing stock for the week, with a gain of 3.3%. On the other
hand, Qatar Cinema (QCFS) was the worst performing stock
with a decline of 9.1%.
Industries Qatar (IQCD), Qatar Islamic Bank (QIBK) and
QNB Group (QNBK) were the primary contributors to the
weekly index loss. IQCD and QIBK took off 59.1 and 35.1
points from the index, respectively. Moreover, QNBK shaved off
another 33.2 points from the index.
Trading value during the week surged by 131.8% to
QR3,416.1mn vs. QR1,474.0mn in the prior trading week.
Masraf Al Rayan (MARK) was the top value traded stock during
the week with total traded value of QR755.3mn.
Trading volume also surged by 97.1% to 980.1mn shares
vs. 497.1mn shares in the prior trading week. The number of
transactions jumped by 114.4% to 77,932 versus 36,346 in the
prior week. MARK was also the top volume traded stock during
the week with total traded volume of 154.6mn shares.
Foreign institutions remained bearish, ending the week
with net selling of QR129mn vs. net selling of QR22mn in
the prior week. Qatari institutions remained positive with net
buying of QR5mn vs. net buying of QR108mn in the week
before. Foreign retail investors ended the week with net selling
of QR18mn vs. net selling of QR11mn in the prior week. Qatari
retail investors turned bullish with net buying of QR142mn vs.
net selling of QR75mn the week before. So far YTD (as of
Wednesday closing), foreigners were net buyers of $1,651.4mn.
Market Indicators
Week ended
Dec 02, 2021
Week ended
Nov 25, 2021
Chg. %
Value Traded (QR mn) 3,416.1 1,474.0 131.8
Exch. Market Cap. (QR mn) 669,297.5 679,912.8 (1.6)
Volume (mn) 980.1 497.1 97.2
Number of Transactions 77,932 36,346 114.4
Companies Traded 47 47 0.0
Market Breadth 9:38 7:40 –
Market Indices Close WTD% MTD% YTD%
Total Return 22,968.89 (1.6) 1.9 14.5
ALL Share Index 3,682.71 (1.4) 2.0 15.1
Banks and Financial Services 4,964.09 (1.1) 2.7 16.9
Industrials 3,981.36 (2.8) 2.4 28.5
Transportation 3,533.01 (0.6) (0.2) 7.2
Real Estate 1,805.01 (0.9) 1.8 (6.4)
Insurance 2,602.64 0.8 (0.1) 8.6
Telecoms 1,031.21 (1.9) 0.9 2.0
Consumer Goods & Services 8,149.27 (0.9) (0.3) 0.1
Al Rayan Islamic Index 4,752.96 (1.5) 1.4 11.3
Weekly Index Performance
Regional Indices Close WTD% MTD% YTD%
Weekly Exchange
Traded Value ($ mn)
Exchange Mkt.
Cap. ($ mn)
TTM P/E** P/B** Dividend Yield
Qatar* 11,603.03 (1.6) 1.9 11.2 2,206.78 182,450.5 16.2 1.7 2.5
Dubai##
3,072.91 (3.1) 0.0 23.3 644.89 108,110.7 20.2 1.0 2.5
Abu Dhabi##
8,546.52 1.1 0.0 69.4 3,201.49 418,375.3 23.2 2.6 2.7
Saudi Arabia#
10,849.96 (4.0) 0.8 24.9 9,736.99 2,589,492.8 23.9 2.3 2.4
Kuwait 6,936.14 (2.7) 2.2 25.1 1,342.17 133,357.1 20.7 1.6 2.0
Oman 3,994.98 (3.0) (0.1) 9.2 17.44 18,683.9 11.4 0.8 3.9
Bahrain 1,761.61 (1.0) 1.9 18.2 37.69 28,062.8 9.8 0.9 3.5
Source: Bloomberg, country exchanges and Zawya (** Trailing Twelve Months; * Value traded ($ mn) do not include special trades, if any; #Data as of December 01, 2021, ##Data as of November 30, 2021)
11,463.91 11,471.36
11,386.31
11,552.42
11,603.03
0
125,000,000
250,000,000
11,250
11,450
11,650
28-Nov 29-Nov 30-Nov 1-Dec 2-Dec
Volume QE Index
1.1%
(1.0%)
(1.6%)
(2.7%) (3.0%) (3.1%)
(4.0%)
(4.5%)
(3.0%)
(1.5%)
0.0%
1.5%
Abu
Dhabi##
Bahrain
Qatar*
Kuwait
Oman
Dubai##
Saudi
Arabia#
2. Page 2 of 6
Economic, Market & Company News
QNBK appoints new Chairman – QNB Group (QNBK) has
appointed HE Ali Ahmed Al-Kuwari as the Chairman with effect
from today, November 29, 2021. (QSE)
MARK elects HE Sheikh Mohammed Bin Hamad Bin Qassim
Al Thani as Chairman of the board of directors – The board
of directors of Masraf Al Rayan (MARK) announced the following
decisions:- (1) In accordance with Chapter 4, Article (19) of the
amended Articles of Association of Masraf Al Rayan, His
Excellency Sheikh Mohammed bin Hamad bin Qassim Al Thani
has been appointed a member of the Board representing Qatar
Investment Authority in place of His Excellency Mr. Ali bin Ahmed
Al Kuwari. (2) The Board of Directors of Masraf Al Rayan elected
His Excellency Sheikh/ Mohammed bin Hamad bin Qassim Al
Thani as Chairman of the Board of Directors in accordance with
Chapter 4, Aritcle (22) of the amended articles of association of
Masraf Al Rayan. (QSE)
MARK and KCBK merger Index weight update – The new
Index Free Float for Masraf Al Rayan (MARK), used in QE Index
and QE All Share Index and QE Banks and Financial Services
Index will be (6,647,126,557) shares, effective from December
06, 2021. QSE will publish the Index constituents sheets for
these indices after the close of market on December 05, 2021.
(QSE)
Cabinet nod to 100% non-Qatari ownership of capital of 4
banks – The Cabinet on Wednesday approved a draft Cabinet
resolution approving non-Qatari investor's ownership of the
capital of four banks. Under the draft resolution, a non-Qatari
investor may own up to 100% of the capital of the following
banks: QNB Group (QNBK), Qatar Islamic Bank (QIBK), Masraf
Al Rayan (MARK) and The Commercial Bank (CBQK). (Gulf-
Times.com)
Cabinet nod to establish new authority for real estate sector
– The Cabinet, chaired by Prime Minister and Minister of Interior
HE Sheikh Khalid bin Khalifa bin Abdulaziz Al Thani, has decided
to take the necessary measures to establish a new authority
concerned with regulating and developing the real estate sector.
The decision came as the Cabinet listened to a presentation by
HE the Minister of Municipality on the results of the work of the
committee concerned with the strategy for the development of
the real estate sector. Through the presentation, the minister
addressed the assessment of the main challenges in the real
estate sector and the ways to face these challenges by preparing
a strategy that consists of programs and initiatives, including
improving the governance of the sector, enhancing the
availability of real estate data, and stimulating real estate
investment. Also, the minister referred to the committee's
recommendations, including the establishment of a new
authority for the development of the real estate sector, the
development of a digital platform that collects and disseminates
real estate data and statistics on the Qatari real estate market,
and the formulation of policies in coordination with the Qatar
Central Bank to support real estate financing for individuals.
(Qatar Tribune)
MARK, KCBK complete legal merger – Masraf Al Rayan
(MARK) has completed the legal merger of Al Khaliji Commercial
Bank (KCBK), effective Wednesday, creating one of the largest
Shariah-compliant lenders in the region with more than
QR182bn in total assets. The two banks are considered one
legal entity bearing the name Masraf Al Rayan with its head
office in Lusail City. Masraf Al Rayan’s capital has increased
from QR7.5bn to QR9.3bn, and Al Khaliji shareholders receive
0.5 ordinary shares in Masraf Al Rayan as consideration for
every ordinary share held. The trading in Masraf Al Rayan shares
continues with the increased capital, while Al Khaliji stands
delisted from the Qatar Stock Exchange, effective today. With a
robust capital position, and strong liquidity, the bank is in a prime
position to accelerate Qatar’s journey towards Vision 2030 by
leveraging its increased scale, compelling product offering and
excellent talent base. The merger is a "turning point" in Qatar’s
banking sector, enabling growth for corporates facilitating
landmark deals, fostering small and medium enterprises (SME)
development and lending and supporting prosperity for its private
clients to manage and grow their wealth and for the retail
customers to reach their potential. The group has international
operations in France, the UK and the UAE. The integration of
products and services is expected to be completed during 2022.
The new board and leadership team is in place and will oversee
the process. (QSE, Gulf-Times.com)
EIU: Qatar’s macroeconomic indicators improving,
returning to positive economic growth – Qatar’s
macroeconomic indicators have improved following the
pandemic-induced slump in 2020, returning to positive economic
growth, researcher EIU has said in a recent assessment. The
country’s fiscal account will return to surplus this year owing to
recovering global oil and gas prices, easing public debt
pressures. Qatar's debt obligations are high, but its ability to fully
service them is not in doubt, supported by ample foreign
reserves and the assets of the Qatar Investment Authority (QIA,
the sovereign wealth fund). EIU’s sovereign risk remains BBB-
rated, although the underlying score has improved by four points,
to 36, reflecting EIU's assessment of improved macroeconomic
indicators. According to EIU, the Qatari riyal's peg to the dollar
will continue to be backed by healthy foreign reserves and QIA
assets. The currency risk rating remains at BB, although the
underlying score has improved by two points, to 42. The rating is
supported by a recovery in international hydrocarbons prices and
an expected shift from deficit to surplus on the current account
in 2021. (Gulf-Times.com)
Healthcare services law: Expatriates to receive healthcare
services at private facilities – With health insurance becoming
mandatory, expatriates will receive healthcare services at private
facilities, while Qatari citizens will receive healthcare services at
government facilities, a Qatar Chamber official has said. If the
service is not available in private facilities, then expatriates may
receive the healthcare services at the government facilities,
Advisor to the Minister of Health for Insurance Affairs Khalid bin
Abdulrahman Al Mughesib said. This came as Qatar Chamber’s
Insurance Committee recently held a meeting to review the Law
No. (22) for 2021 on the regulations of health care services inside
the country. (Qatar Tribune)
3. Page 3 of 6
Qatar Stock Exchange
Top Gainers Top Decliners
Source: Qatar Stock Exchange (QSE) Source: Qatar Stock Exchange (QSE)
Most Active Shares by Value (QR Million) Most Active Shares by Volume (Million)
Source: Qatar Stock Exchange (QSE) Source: Qatar Stock Exchange (QSE)
Investor Trading Percentage to Total Value Traded Net Traded Value by Nationality (QR Million)
Source: Qatar Stock Exchange (QSE) Source: Qatar Stock Exchange (QSE)
3.3%
2.5%
1.4%
1.2%
0.9%
0.0%
1.5%
3.0%
4.5%
Qatar
Insurance
Company
Investment
Holding Group
Mazaya Qatar
Real Estate
Development
Widam Food
Company
Masraf Al
Rayan
-9.1%
-5.0% -4.8%
-4.3%
-3.6%
-12.0%
-8.0%
-4.0%
0.0%
Qatar Cinema
& Film
Distribution
Company
Dlala
Brokerage &
Investment
Holding
Company
Qatar General
Insurance &
Reinsurance
Company
Al Khaleej
Takaful
Insurance
Company
Qatar
Aluminium
Manufacturing
Company
755.3
624.5
200.9
170.2 166.4
0.0
280.0
560.0
840.0
Masraf Al
Rayan
QNB Group Qatar Islamic
Bank
The
Commercial
Bank
Industries
Qatar
154.6
108.2 107.7
65.0 58.9
0.0
60.0
120.0
180.0
Masraf Al
Rayan
Salam
International
Investment
Limited
Investment
Holding Group
Qatar
Aluminium
Manufacturing
Company
Gulf
International
Services
0%
20%
40%
60%
80%
100%
Buy Sell
31.31% 27.15%
15.03%
14.88%
10.89%
11.42%
42.77% 46.54%
Qatari Individuals Qatari Institutions
Non-Qatari Individuals Non-Qatari Institutions
1,583
1,833
1,436
1,980
147
-147
-500 0 500 1,000 1,500 2,000 2,500
Qatari
Non-Qatari
Net Investment Total Sold Total Bought
4. Page 4 of 6
TECHNICAL ANALYSIS OF THE QSE INDEX
Source: Bloomberg
The QE Index gapped down and continued with its correction over the week. However, the Index managed to bounce off our expected
support level of 11,400 points, and managed to create a bullish reversal candlestick on the weekly chart. That been said, the bullish signal
needs to be confirmed with a strong move above the 11,700 level for the uptrend to continue north. The QE index did close at the 11,603.03
points and lost 1.6% from the week before.
DEFINITIONS OF KEY TERMS USED IN TECHNICAL ANALYSIS
RSI (Relative Strength Index) indicator – RSI is a momentum oscillator that measures the speed and change of price movements. The RSI oscillates between
0 to 100. The index is deemed to be overbought once the RSI approaches the 70 level, indicating that a correction is likely. On the other hand, if the RSI
approaches 30, it is an indication that the index may be getting oversold and therefore likely to bounce back.
MACD (Moving Average Convergence Divergence) indicator – The indicator consists of the MACD line and a signal line. The divergence or the convergence
of the MACD line with the signal line indicates the strength in the momentum during the uptrend or downtrend, as the case may be. When the MACD crosses
the signal line from below and trades above it, it gives a positive indication. The reverse is the situation for a bearish trend.
Candlestick chart – A candlestick chart is a price chart that displays the high, low, open, and close for a security. The ‘body’ of the chart is portion between
the open and close price, while the high and low intraday movements form the ‘shadow’. The candlestick may represent any time frame. We use a one-day
candlestick chart (every candlestick represents one trading day) in our analysis.
Doji candlestick pattern – A Doji candlestick is formed when a security's open and close are practically equal. The pattern indicates indecisiveness, and
based on preceding price actions and future confirmation, may indicate a bullish or bearish trend reversal.
Shooting Star/Inverted Hammer candlestick patterns – These candlestick patterns have a small real body (open price and close price are near to each other),
and a long upper shadow (large intraday movement on the upside). The Shooting Star is a bearish reversal pattern that forms after a rally. The Inverted
Hammer looks exactly like a Shooting Star, but forms after a downtrend. Inverted Hammers represent a potential bullish trend reversal.
5. Page 5 of 6
Source: Bloomberg
Company Name
Price
December 02
% Change
WTD
% Change
YTD
Market Cap.
QR Million
TTM P/E P/B Div. Yield
Qatar National Bank 20.23 (1.80) 13.46 186,853 15.9 2.3 2.2
Qatar Islamic Bank 17.74 (2.21) 3.68 41,918 13.2 2.1 2.3
Commercial Bank of Qatar 6.60 (0.66) 50.00 26,712 12.9 1.4 1.5
Doha Bank 3.06 0.72 29.15 9,478 15.1 0.9 2.5
Al Ahli Bank 4.00 0.50 16.04 9,719 13.8 1.5 3.8
Qatar International Islamic Bank 9.49 (1.19) 4.84 14,365 16.1 2.2 3.4
Masraf Al Rayan 4.84 0.87 6.89 45,031 16.3 2.4 3.5
Qatar First Bank 1.81 (0.44) 5.29 1,268 10.7 2.3 N/A
National Leasing 1.02 (1.17) (18.34) 502 20.1 0.7 2.5
Dlala Holding 1.41 (5.05) (21.39) 401 25.9 1.8 N/A
Qatar & Oman Investment 0.90 (1.97) 0.90 282 49.9 1.0 N/A
Islamic Holding Group 4.51 (1.36) (11.86) 255 45.1 1.8 1.1
Banking and Financial Services 336,784
Zad Holding 15.85 (0.88) 16.93 4,132 21.4 2.8 4.0
Qatar German Co. for Medical Devices 3.19 (1.54) 42.60 368 120.9 11.1 N/A
Salam International Investment 0.90 (1.64) 38.25 1,029 N/A 0.7 N/A
Baladna 1.50 (1.70) (16.03) 2,857 N/A 1.3 3.5
Medicare Group 8.33 (1.10) (5.80) 2,344 26.0 2.3 21.6
Qatar Cinema & Film Distribution 3.48 (9.13) (12.97) 218 71.0 1.6 2.9
Qatar Fuel 18.08 (0.99) (3.21) 17,976 17.7 2.1 2.5
Qatar Meat and Livestock 3.85 1.18 (39.10) 693 N/A 2.2 2.6
Mannai Corp. 4.72 0.40 57.30 2,153 5.4 1.0 0.2
Al Meera Consumer Goods 19.34 0.52 (6.62) 3,868 21.4 2.6 4.7
Consumer Goods and Services 35,638
Qatar Industrial Manufacturing 3.08 (2.47) (4.18) 1,461 11.9 0.9 3.3
Qatar National Cement 5.10 (0.45) 22.94 3,334 14.1 1.1 3.9
Industries Qatar 14.90 (3.37) 37.07 90,145 13.6 2.4 2.2
Qatari Investors Group 2.37 (1.58) 30.59 2,940 21.4 1.0 2.5
Qatar Electricity and Water 16.59 (1.83) (7.06) 18,249 13.9 1.6 3.8
Aamal 1.08 (1.73) 25.96 6,785 28.2 0.9 3.7
Gulf International Services 1.87 (1.68) 8.98 3,473 N/A 1.1 N/A
Mesaieed Petrochemical Holding 2.15 (2.62) 5.18 27,049 16.5 1.6 1.9
Invesment Holding Group 1.31 2.51 118.53 1,086 54.7 1.3 N/A
Qatar Aluminum Manufacturing 1.87 (3.60) 93.69 10,452 17.3 1.7 1.9
Industrials 164,975
Qatar Insurance 2.54 3.34 7.32 8,280 15.6 1.0 N/A
QLM Life & Medical Insurance 4.95 (1.00) N/A 1,733 N/A 2.9 N/A
Doha Insurance 1.94 (0.67) 39.15 969 13.8 0.8 5.2
Qatar General Insurance & Reinsurance 1.98 (4.82) (25.75) 1,728 13.4 0.3 N/A
Al Khaleej Takaful Insurance 4.01 (4.30) 111.01 1,022 21.0 2.0 1.2
Qatar Islamic Insurance 7.75 (0.39) 12.32 1,163 15.0 2.9 4.2
Insurance 14,894
United Development 1.53 (0.65) (7.37) 5,428 17.6 0.5 3.3
Barw a Real Estate 3.17 (0.72) (6.79) 12,335 10.1 0.6 3.9
Ezdan Real Estate 1.50 (2.48) (15.71) 39,708 103.2 1.2 N/A
Mazaya Qatar Real Estate Development 1.04 1.36 (17.50) 1,206 39.3 1.0 2.9
Real Estate 58,678
Ooredoo 6.85 (2.39) (8.88) 21,948 N/A 1.1 3.6
Vodafone Qatar 1.62 (0.80) 21.06 6,852 26.3 1.5 3.1
Telecoms 28,800
Qatar Navigation (Milaha) 7.57 (0.36) 6.75 8,672 26.2 0.6 4.0
Gulf Warehousing 4.77 (1.04) (6.43) 280 12.2 1.4 2.1
Qatar Gas Transport (Nakilat) 3.26 (0.67) 2.52 18,061 14.2 2.2 3.4
Transportation 27,013
Qatar Exchange 669,298
6. Contacts
QNB Financial Services Co. W.L.L.
Contact Center: (+974) 4476 6666
info@qnbfs.com.qa
Doha, Qatar
Saugata Sarkar, CFA, CAIA Shahan Keushgerian
Head of Research Senior Research Analyst
saugata.sarkar@qnbfs.com.qa shahan.keushgerian@qnbfs.com.qa
Disclaimer and Copyright Notice: This publication has been prepared by QNB Financial Services Co. W.L.L. (“QNBFS”) a wholly-owned subsidiary of Qatar National Bank (Q.P.S.C.). QNB FS is
regulated by the Qatar Financial Markets Authority and the Qatar Exchange. Qatar National Bank (Q.P.S.C.) is regulated by the Qatar Central Bank. This publication expresses the views and opinions
of QNBFS at a given time only. It is not an offer, promotion or recommendation to buy or sell securities or other investments, nor is it intended to constitute legal, tax, accounting, or financial advice.
QNBFS accepts no liability whatsoever for any direct or indirect losses arising from use of this report. Any investment decision should depend on the individual circumstances of the investor and be
based on specifically engaged investment advice. We therefore strongly advise potential investors to seek independent professional advice before making any investment decision. Although the
information in this report has been obtained from sources that QNBFS believes to be reliable, we have not independently verified such information and it may not be accurate or complete. QNBFS
does not make any representations or warranties as to the accuracy and completeness of the information it may contain, and declines any liability in that respect. For reports dealing with Technical
Analysis, expressed opinions and/or recommendations may be different or contrary to the opinions/recommendations of QNBFS Fundamental Research as a result of depending solely on the
historical technical data (price and volume). QNBFS reserves the right to amend the views and opinions expressed in this publication at any time. It may also express viewpoints or make investment
decisions that differ significantly from, or even contradict, the views and opinions included in this report. This report may not be reproduced in whole or in part without permission from QNBFS.
COPYRIGHT: No part of this document may be reproduced without the explicit written permission of QNBFS.
Page 6 of 6