التحليل الفني اليومي - بورصة قطر - 10 مايو 2016QNB Group
اقفل المؤشر العام للسوق على ارتفاع كما توقعنا ولكننا
متخوفين من هذا النوع من التصحيح ألعلى حيث اليزال
المؤشر العام للسوق في اتجاه عام هابط على المدى القصير
كما هو ملحوظ من الرسمين البيانيين اليومي واللحظي.
التحليل الفني اليومي - بورصة قطر - 03 ابريلQNB Group
بالرغم من ارتفاع احجام التداول ولكن المؤشر لم يتحرك
خارج النطاق االفقي الذي هو فيه منذ اكثر من اربعة اسابيع.
ولكن وبالرغم من وجود المؤشر في نطاق افقي، ولكن
المؤشر كسر تحت خط االتجاه المتصاعد
التحليل الفني اليومي - بورصة قطر - 01 يونيو 2016QNB Group
ويستمر انخفاض المؤشر، والشيء الوحيد االيجابي الذي
يمكن مالحظته هو تحرك مؤشر القوة النسبية بإيجابية
بالمقارنة مع حركة السعر في الرسم البياني اللحظي. ولكن
هذا ال يعني بالضرورة ارتفاع المؤشر ألن االتجاه العام
للمؤشر اليزال ألسفل، مما يجعلنا نرجح استخدام االرتفاعات
)المحتملة( كفرص خروج من السوق في الوقت الراهن.
التحليل الفني اليومي - بورصة قطر - 03 مايوQNB Group
انخفض المؤشر العام للسوق تحت مستوى 031033 نقطة
بقليل ولهذا فإننا لم نغير مستوى الدعم الحالي من ذلك
المستوى ولكن االهم أن يبقى المؤشر فوق مستوى 031333
نقطة. اختراق المؤشر تحت ذلك قد يؤدي الى انخفاضه
لمستويات 01833 و 01733 نقطة.
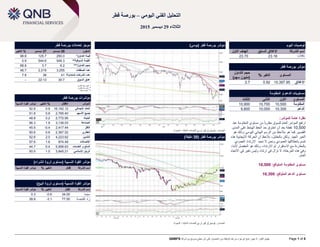
التحليل الفني اليومي - بورصة قطر - 19 اكتوبرQNB Group
اذا كسر المؤشر العام للسوق فوق مستوى 500,10 اثناء
الجلسة فمن الغالب أن تستمر الحركة ألعلى، ماذا واال فإن
المؤشر سيستمر في حركته االفقية والتي بدأت منذ حوالي
االسبوعين.
Daily Technical Trader - Qatar February 01QNB Group
The document provides a daily technical analysis report on stocks traded on the Qatar Stock Exchange (QSE). It analyzes the performance of the QSE Index and two stocks, CBQK and MCGS. The QSE Index rallied and reached the top of its short-term uptrend channel, coming closer to a previous trough from December, and some profit taking is expected. CBQK broke above important resistance levels of QR40 and QR41.20, indicating a potential change to a positive market psychology. Price targets of QR42-43 are given. MCGS displayed bullish signs such as positive divergence and momentum picking up. Price targets of QR90.40-94.20 are given if it breaks above
- The QSE Index closed down 2.34% and has declined nearly 37% since its peak in September 2014. It is projected to find support around 9,000 and potentially 8,300.
- IQCD has moved in line with falling international oil prices and may weaken further toward QR94-QR88 if it breaches QR96.20.
- The document provides technical analysis of stock and market index movements and levels, including targets, resistances, supports, indicators and averages.
التحليل الفني اليومي - بورصة قطر - 10 مايو 2016QNB Group
اقفل المؤشر العام للسوق على ارتفاع كما توقعنا ولكننا
متخوفين من هذا النوع من التصحيح ألعلى حيث اليزال
المؤشر العام للسوق في اتجاه عام هابط على المدى القصير
كما هو ملحوظ من الرسمين البيانيين اليومي واللحظي.
التحليل الفني اليومي - بورصة قطر - 03 ابريلQNB Group
بالرغم من ارتفاع احجام التداول ولكن المؤشر لم يتحرك
خارج النطاق االفقي الذي هو فيه منذ اكثر من اربعة اسابيع.
ولكن وبالرغم من وجود المؤشر في نطاق افقي، ولكن
المؤشر كسر تحت خط االتجاه المتصاعد
التحليل الفني اليومي - بورصة قطر - 01 يونيو 2016QNB Group
ويستمر انخفاض المؤشر، والشيء الوحيد االيجابي الذي
يمكن مالحظته هو تحرك مؤشر القوة النسبية بإيجابية
بالمقارنة مع حركة السعر في الرسم البياني اللحظي. ولكن
هذا ال يعني بالضرورة ارتفاع المؤشر ألن االتجاه العام
للمؤشر اليزال ألسفل، مما يجعلنا نرجح استخدام االرتفاعات
)المحتملة( كفرص خروج من السوق في الوقت الراهن.
التحليل الفني اليومي - بورصة قطر - 03 مايوQNB Group
انخفض المؤشر العام للسوق تحت مستوى 031033 نقطة
بقليل ولهذا فإننا لم نغير مستوى الدعم الحالي من ذلك
المستوى ولكن االهم أن يبقى المؤشر فوق مستوى 031333
نقطة. اختراق المؤشر تحت ذلك قد يؤدي الى انخفاضه
لمستويات 01833 و 01733 نقطة.
التحليل الفني اليومي - بورصة قطر - 19 اكتوبرQNB Group
اذا كسر المؤشر العام للسوق فوق مستوى 500,10 اثناء
الجلسة فمن الغالب أن تستمر الحركة ألعلى، ماذا واال فإن
المؤشر سيستمر في حركته االفقية والتي بدأت منذ حوالي
االسبوعين.
Daily Technical Trader - Qatar February 01QNB Group
The document provides a daily technical analysis report on stocks traded on the Qatar Stock Exchange (QSE). It analyzes the performance of the QSE Index and two stocks, CBQK and MCGS. The QSE Index rallied and reached the top of its short-term uptrend channel, coming closer to a previous trough from December, and some profit taking is expected. CBQK broke above important resistance levels of QR40 and QR41.20, indicating a potential change to a positive market psychology. Price targets of QR42-43 are given. MCGS displayed bullish signs such as positive divergence and momentum picking up. Price targets of QR90.40-94.20 are given if it breaks above
- The QSE Index closed down 2.34% and has declined nearly 37% since its peak in September 2014. It is projected to find support around 9,000 and potentially 8,300.
- IQCD has moved in line with falling international oil prices and may weaken further toward QR94-QR88 if it breaches QR96.20.
- The document provides technical analysis of stock and market index movements and levels, including targets, resistances, supports, indicators and averages.
The document provides a daily market summary and analysis of the Qatar stock market. It summarizes that the QSE Index stabilized in the previous session and would need a sustained break above 9,700 to spark confidence. It also recommends selling MCGS stock if it breaks below QR105 due to a bearish price move and momentum indicators suggesting more weakness. Overall, the document analyzes market indicators, index levels, individual stock performance and technical analysis to provide a daily overview and outlook of the Qatar stock market.
The QSE Index declined 0.8% to close at 9,959.7 led by losses in the Banks & Financial Services and Real Estate indices. Qatar General Insurance & Reinsurance Co. and Al Khalij Commercial Bank were the top losers falling 5.2% and 2.7% respectively. Islamic Holding Group gained 8.3% while Qatar Industrial Manufacturing Co. rose 2.5%. Trading volume rose 14% while the number of transactions increased 20.1%.
The QSE Index declined slightly by 0.1% led by losses in the real estate and insurance indices. Qatar General Insurance and Ahli Bank were the top losers falling 8.3% and 6.0% respectively. Zad Holding gained 10.0% while Qatar Islamic Insurance rose 7.5%. Trading volume rose by 37.1% but was lower than the 30-day average. The document also provides summaries of index movements and major stock movers in other GCC markets as well as global economic data and earnings releases.
The QSE Index gained marginally to close at 10,398.3, led by the Banks & Financial Services and Transportation indices. Zad Holding Co. and QNB Group were the top gainers, while Qatar Insurance Co. and Al Khalij Commercial Bank were the top losers. Trading volume fell by 21.7% compared to the previous day. Globally, US consumer confidence rose in December and home prices increased in October from the prior month. In Qatar news, ABQK's board will meet in January to approve budgets and dividends, and Qatar's population grew 8.5% YoY in November according to government statistics.
The document provides a daily technical analysis report on the Qatar stock market from QNBFS Research. It includes:
1) An overview of the QSE Index dropping sharply the previous session and analysis that a breach of the 9,500 support level could drag it down further.
2) Technical analysis and commentary on the stock KCBK, noting it has been in a downtrend and breaking a support level at 16.70 could take it to a new two-year low, while momentum indicators show signs of a potential upward correction.
3) Tables presenting market indicators, index levels and individual stock details like prices, moving averages and technical indicators like RSI.
QNBFS Daily Technical Trader - Qatar January 27QNB Group
This document provides a daily technical analysis report on stocks and indices in Qatar. It includes the following:
1) An analysis of the QSE Index showing mixed signals from its movement and indicators, with resistance at 9,000 and support at 8,500.
2) A technical analysis of the stock QGMD, identifying a bullish reversal pattern, resistance between 10.00-11.40 QR, and support at 9.30 QR.
3) Tables presenting market indicators, index levels, stock prices and technical indicators like moving averages and Fibonacci levels for various Qatari stocks and indices.
1) The document analyzes the Qatari stock market and provides commentary on index levels and individual stocks. It discusses recent declines in the QSE Index and identifies important support levels.
2) It also provides details on trading activity and performance of industry sub-indices. Technical analysis is given for selected stocks, including resistance/support levels and recommendations.
3) Tables provide intraday Fibonacci support and resistance levels for indexes and stocks, along with their 50, 100 and 200-day moving averages. Definitions of technical analysis terms are also included.
التحليل الفني اليومي - بورصة قطر - 31 ينايرQNB Group
من المتوقع أن يرتفع المؤشر بسبب حركة االسواق العالمية االيجابية في يوم الجمعة الماضي واسعار النفط العالمية ولقد كسر المؤشر فوق مستويين من مستويات المقاومة وذلك في
جلسة واحدة
The document provides a daily technical analysis and summary of the Qatar stock market and selected stocks. It includes:
- An overview of the QSE Index declining and expected further weakness.
- Charts and analysis of IHGS stock declining and expected to continue downward.
- Summaries of market indicators, index performance, and individual stock movements.
- Intraday support and resistance levels for indexes and selected stocks.
التحليل الفني اليومي - بورصة قطر - 02 فبرايرQNB Group
لم يستطيع المؤشر العام للسوق من التحرك بنفس نشاط االيام
السابقة حيث الحظنا حركة بعض المؤشرات والتي تدل على
احتمال بدء ضعف السوق وهذا قد يغير من نفسية المتداولين
للسلبية.
QNBFS Daily Market Report December 24, 2023QNB Group
The QE Index rose 0.8% to close at 10,285.3. Gains were led by the Transportation and Banks & Financial Services indices, gaining 1.4% and 1.2%, respectively.
QNBFS Daily Technical Trader Qatar - October 10, 2023 التحليل الفني اليومي لب...QNB Group
The document provides a daily technical analysis of the QE Index and QATAR INSURANCE CO stock. For the QE Index, it notes the index remains in a downtrend but is approaching a support level of 9,700, where long positions could be taken. It provides expected resistance and support levels. For QATAR INSURANCE CO stock, it notes the stock has not fallen as much as others and the uptrend remains intact above moving averages, though liquidity is low. It provides expected price targets and resistance/support levels for the stock. Definitions of technical analysis terms like candlesticks, support, and simple moving average are also included.
QNBFS Daily Market Report October 04, 2023QNB Group
The QE Index rose 0.2% to close at 10,273.3. Gains were led by the Transportation and Consumer Goods & Services indices, gaining 1.7% and 0.1%, respectively.
QNBFS Daily Technical Trader Qatar - October 04, 2023 التحليل الفني اليومي لب...QNB Group
The General Index failed to sustain its breakout above the double-bottom formation’s neckline and continued with its decline into the formation’s territory.
QNBFS Daily Technical Trader Qatar - September 28, 2023 التحليل الفني اليومي ...QNB Group
The General Index failed to sustain its breakout above the double-bottom formation’s neckline and continued with its decline into the formation’s territory.
QNBFS Daily Market Report September 24, 2023QNB Group
- The QE Index in Qatar rose 0.3% led by gains in the Transportation and Industrials indices. Qatar Navigation and Al Khaleej Takaful Insurance were the top gainers.
- Regional markets were mixed with Saudi Arabia down 1% but Abu Dhabi up marginally. Economic data from the US and Europe was mixed.
- In Qatar news, QR500mn in bills were sold at a yield of 5.755% and Gulf International Services approved final merger agreements. Ooredoo also signed an MoU to support businesses in Qatar free zones.
QNBFS Daily Technical Trader Qatar - September 24, 2023 التحليل الفني اليومي ...QNB Group
The General Index failed to sustain its breakout above the double-bottom formation’s neckline and continued with its decline into the formation’s territory.
QNBFS Daily Technical Trader Qatar - September 19, 2023 التحليل الفني اليومي ...QNB Group
The General Index failed to sustain its breakout above the double-bottom formation’s neckline and continued with its decline into the formation’s territory.
QNBFS Daily Market Report September 17, 2023QNB Group
The QE Index declined 0.5% to close at 10,319.3. Losses were led by the Industrials and Consumer Goods & Services indices, falling 1.4% and 1.1%, respectively.
QNBFS Daily Technical Trader Qatar - September 07, 2023 التحليل الفني اليومي ...QNB Group
The General Index failed to
sustain its breakout above the
double-bottom formation’s
neckline and continued with
its decline into the
formation’s territory.