
Recommended
Recommended
More Related Content
What's hot
What's hot (20)
Similar to Week 4 data chart and bar graphs the data chart and bar gr
Similar to Week 4 data chart and bar graphs the data chart and bar gr (20)
More from SALU18
More from SALU18 (20)
Recently uploaded
Recently uploaded (20)
Week 4 data chart and bar graphs the data chart and bar gr
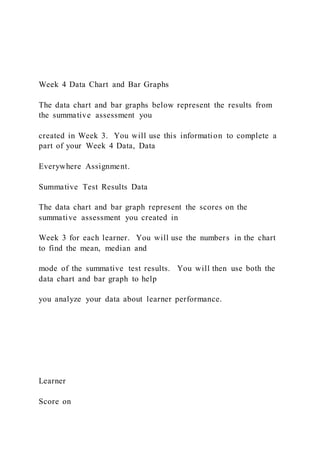
- 1. Week 4 Data Chart and Bar Graphs The data chart and bar graphs below represent the results from the summative assessment you created in Week 3. You will use this information to complete a part of your Week 4 Data, Data Everywhere Assignment. Summative Test Results Data The data chart and bar graph represent the scores on the summative assessment you created in Week 3 for each learner. You will use the numbers in the chart to find the mean, median and mode of the summative test results. You will then use both the data chart and bar graph to help you analyze your data about learner performance. Learner Score on
- 2. Summative Assessment Learner 1 88 Learner 2 43 Learner 3 75 Learner 4 96 Learner 5 90 Learner 6 63 Learner 7 85 Learner 8 87 Learner 9 91 Learner 10 75 Learner 11 96 Learner 12 52 Learner 13 100 Learner 14 63 Learner 15 75 0 20 40 60 80 100 120
- 3. Learner 1 Learner 2 Learner 3 Learner 4 Learner 5 Learner 6 Learner 7 Learner 8 Learner 9 Learner 10 Learner 11 Learner 12 Learner 13 Learner 14 Learner 15 Score on Summative Assessment Incorrect Test Questions on Summative Assessment
- 4. The bar graph below represents the questions on the summative assessment that learners answered incorrectly. You will use this information to consider how you might differentiate your instruction to support learner needs. For example, many learners appeared to struggle with question 2. Go back to your summative assessment to see what learning objective this question addressed and what you might have to do to reteach this objective. Don’t forget to consider those who have and have not mastered it when thinking about ways to differentiate your instruction. 3 10 2 0 2 4
- 5. 8 1 3 4 NUMBER OF INCORRECT ANSWERS Running head: DATA EVERYWHERE 1 DATA EVERYWHERE 4 Week 4: Data…Data Everywhere! Your Name EDU 645: Assessment for Learning Instructor's Name Date Hint: For help completing this assignment: Read Chapter 6: Summative Assessment; Chapter 9: Statistics for Educational Assessments; access the data chart, bar graphs, and test results listed in the Week 4 assignment prompt; and review the article links listed in the Week 4 assignment prompt. Hint: Delete all of these green boxes before submitting the paper to your instructor. To delete the boxes: click on the edge of each box and press delete. Data Analysis in Educational Assessment
- 6. In this section, write a brief introduction to your paper that will allow your reader to follow the organization of your paper and the focus of your discussion. You might provide a brief overview of the topic in your introduction. Hint: Ctrl + Click INTRODUCTIONS & CONCLUSIONS for help Mean, Median, and Mode Review the test results data and determine the mean, median, and mode. Include that information here. Educational Assessment Examine the bar graphs and explain what the data tells you about how learners performed on the summative assessment. Refer to the bar graph and the incorrect answer choices in your explanation. Refer to your course textbook in your discussion as well. Hint: Use evidence from your readings to support your ideas in the above and below sections. Ctrl + Click QUOTING, PARAPHRASING, & SUMMARIZING for help Hint: Ctrl + Click INTEGRATING RESEARCH For help. Hint: Ctrl + Click CITING WITHIN YOUR PAPER for help. Applying the Data Explain how you might use this data to inform your instruction. Analyze the incorrect answer choices data and link this to your summative assessment.
- 7. In response to the incorrect answer choices data, discuss how you might reteach these concepts and differentiate for those who already mastered it using flexible grouping. Explain how you might give feedback to your learners based on the test results. Making reference to your readings. Interpreting Mean, Median, and Mode Explain how the mean, median, and mode of these results are different and how they are similar. Describe different situations in which each of the mean, the mode, or the median would be the most appropriate measure of central tendency and relate it to your test results data. Explain how you might use this data when sharing results with the learners or the parents of the learners. Making reference to your readings. Conclusion Describe the importance of understanding statistics in the education profession. Explain how this understanding might improve your practice and support student learning. Be sure to use evidence from your readings to support your response. Hint: Ctrl + Click INTRODUCTIONS & CONCLUSIONS for help. References Template for an APA Webpage (with a Person as Author) referenceentry: Author’s Last Name, Initials. (Year Published). Webpage title. Website Title. Retrieved from http:// (website’s homepage) Template for an APA Webpage (with Corporate/Government
- 8. Author) referenceentry: Title of Organization. (Year Published). Webpage title. Retrieved from http:// Template for an APA Academic Journal referenceentry: Author’s Last Name, Initials. (Year Published). Article title. Journal Name, Volume #(Issue #), page range. doi: or Retrieved from http:// (journal’s homepage) Template for an APA eBook or eTextbook referenceentry: Author’s Last Name, Initials. (Year Published). Title of book: Subtitle of book. (edition, if other than the first). [Type or version of eBook]. doi: or Retrieved from http:// Use APA format to cite and reference your sources on your References page, including your course textbook. Remember, you MUST include in-text citations throughout your paper to show your reader what information you used from these outside sources. Hint: Ctrl + Click FORMATTING YOUR REFERENCES LISTfor further help. *In the final version of your assignment, be sure that you have removed all the hints (green boxes) within the template.