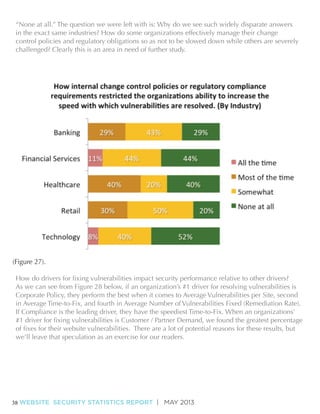
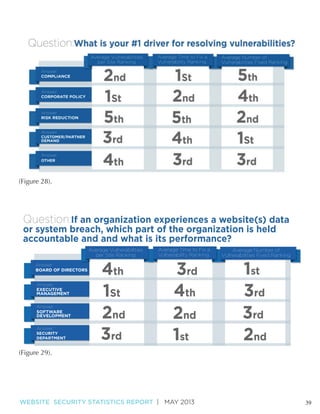
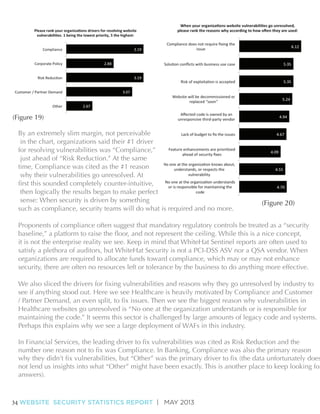
Ce rapport produit par WhiteHat en mai 2013 offre une vision pertinente des menaces web et des paramètres à prendre en compte pour assurer sécurité et disponibilité.
In this report, we put this area of application security understanding to the test by measuring how various web programming languages and development frameworks actually perform in the field. To which classes of attack are they most prone, how often and for how long; and, how do they fare against popular alternatives? Is it really true that the most popular modern languages and frameworks yield similar results in production websites?
By analyzing the vulnerability assessment results of more than 30,000 websites under management with WhiteHat Sentinel, we begin to answer these questions. These answers may enable the application security community to ask better and deeper questions, which will eventually lead to more secure websites. Organizations deploying these technologies can have a closer look at particularly risk-prone areas. Software vendors may focus on areas that are found to be lacking. Developers can increase their familiarity with the strengths and weaknesses of their technology stack. All of this is vitally important because security must be baked into development frameworks and must be virtually transparent. Only then will application security progress be made.
WhiteHat Security’s Website Security Statistics Report provides a one-of-a-kind perspective on the state of website security and the issues that organizations must address in order to conduct business online safely.
Website security is an ever-moving target. New website launches are common, new code is released constantly, new Web technologies are created and adopted every day; as a result, new attack techniques are frequently disclosed that can put every online business at risk. In order to stay protected, enterprises must receive timely information about how they can most efficiently defend their websites, gain visibility into the performance of their security programs, and learn how they compare with their industry peers. Obtaining these insights is crucial in order to stay ahead and truly improve enterprise website security.
To help, WhiteHat Security has been publishing its Website Security Statistics Report since 2006. This report is the only one that focuses exclusively on unknown vulnerabilities in custom Web applications, code that is unique to an organization, and found in real-world websites. The underlying data is hundreds of terabytes in size, comprises vulnerability assessment results from tens of thousands of websites across hundreds of the most well-known organizations, and collectively represents the largest and most accurate picture of website security available. Inside this report is information about the most prevalent vulnerabilities, how many get fixed, how long the fixes can take on average, and how every application security program may measurably improve. The report is organized by industry, and is accompanied by WhiteHat Security’s expert analysis and recommendations.
Through its Software-as-a-Service (SaaS) offering, WhiteHat Sentinel, WhiteHat Security is uniquely positioned to deliver the depth of knowledge that organizations require to protect their brands, attain compliance, and avert costly breaches.
This document is a website security statistics report from 2015 that analyzes vulnerability data from tens of thousands of websites. Some of the key findings include:
- Compliance-driven organizations have the lowest average number of vulnerabilities but the highest remediation rates, while risk reduction-driven organizations have more vulnerabilities but fix them faster.
- Feeding vulnerability results back to development teams significantly reduces vulnerabilities, speeds up fixes, and increases remediation rates.
- Performing static code analysis more frequently is correlated with faster vulnerability fix times.
- Ad hoc code reviews of high-risk applications appear to be one of the most effective activities at reducing vulnerabilities.
- There is no clear evidence that any particular "best practice"
Web security is a moving target and enterprises need timely information about the latest attack trends, how they can best defend their websites, and visibility into their vulnerability lifecycle. Through its Software-as-a-Service (SaaS) offering, WhiteHat Sentinel, WhiteHat Security is uniquely positioned to deliver the knowledge and solutions that organizations need to protect their brands, attain PCI compliance and avert costly breaches.
The WhiteHat Website Security Statistics Report provides a one-of-a-kind perspective on the state of website security and the issues that organizations must address to safely conduct business online. WhiteHat has been publishing the report, which highlights the top ten vulnerabilities, tracks vertical market trends and identifies new attack techniques, since 2006.
The WhiteHat Security report presents a statistical picture of current website vulnerabilities, accompanied by WhiteHat expert analysis and recommendations. WhiteHat’s report is the only one in the industry to focus solely on unknown vulnerabilities in custom Web applications, code unique to an organization,
This document summarizes the key findings from the WhiteHat Security Website Security Statistics Report from June 2012. The report analyzed vulnerabilities across 7,000 websites from hundreds of organizations. Some of the main findings include:
- The average number of serious vulnerabilities per website dropped significantly from 230 in 2010 to 79 in 2011.
- Cross-site scripting remained the most prevalent vulnerability, found in 55% of websites.
- Web application firewalls could have mitigated 71% of custom application vulnerabilities.
- Banking websites had the fewest vulnerabilities on average with 17 per site.
- Overall, organizations fixed 63% of serious vulnerabilities, up from 53% the prior year.
The Four(ish) Appsec Metrics You Can’t IgnoreVeracode
Which metrics should we use? You might expect an “it depends” answer, but there are some metrics that are important for any application security program, regardless of audience or goals. We’ll take a look at a few of them in this post.
This document summarizes a presentation on achieving high-fidelity security by combining packet and endpoint data. It discusses research findings that many organizations' security programs have overconfidence in prevention and detection capabilities. The research also found that organizations focus on the wrong data sources and lack tools and automation to integrate and analyze network and endpoint data. Combining both data sources can help overcome individual gaps but organizations currently analyze these data silos separately. The presentation argues that integrating packet and endpoint data through automated analysis can help improve security effectiveness.
This year WhiteHat SecurityTM celebrates its fteenth anniversary, and the eleventh year that we have produced the Web Applications Security Statistics Report. The stats shared in this report are based on the aggregation of all the scanning and remediation data obtained from applications that used the WhiteHat SentinelTM service for application security testing in 2015. As an early pioneer in the Application Security Market, WhiteHat has a large and unique collection of data to work with.
Hewlett-Packard Enterprise- State of Security Operations 2015Kim Jensen
This document summarizes findings from 118 security operations maturity assessments of 87 organizations in 18 countries. It finds that the median maturity level remains below the ideal level of 3, and 20% of organizations scored below the minimum level of 1. The top issue facing security operations is the shortage of skilled resources. While organizations are investing in new technologies, many neglect operational budgets and processes, resulting in immature capabilities. Visible breaches have increased focus on security from executive leadership and boards.
- The document discusses the need for organizations to implement application security programs to protect against growing cyber attacks targeting applications. It outlines three stages of maturity for application security programs - ad-hoc, baseline, and advanced. The ad-hoc approach focuses solely on applications for customers, while the baseline approach covers more of an organization's portfolio and includes purchased applications. Any organization can get started with application security to begin reducing risks.
- Cyberattackers target applications because they are the path of least resistance to steal data. While companies have invested in network and hardware security, applications are still insufficiently secured.
- There are three stages of maturity for application security programs - ad-hoc, baseline, and advanced. The ad-hoc approach focuses only on customer-facing applications. The baseline approach assesses more applications but still relies on manual testing. The advanced approach integrates security into the entire software development lifecycle.
- Any organization can begin to reduce risk by starting with the ad-hoc or baseline approach and working towards a more advanced application security program over time.
How close is your organization to being breached | Safe SecurityRahul Tyagi
This document discusses the need for organizations to quantify their digital business risk and cybersecurity posture using mathematical models. It introduces SAFE, a unique method developed by MIT researchers to measure an organization's cyber risk using a Bayesian network and machine learning. SAFE analyzes data from various sources to provide a breach likelihood score between 0-5, indicating how likely a breach is in the next 12 months. It also demonstrates how SAFE could have helped detect and prevent a recent ransomware attack on a large shipping company.
Mobile Security: Apps are our digital lives.Veracode
Every app that resides on our devices contains information on some aspect of our lives. What games we play, who we talk to, where we work, what utilities make our lives easier are all captured by our apps on our mobile devices. Anyone armed with this information can mimic our digital lives to friends, family, colleagues and even corporate systems. Who we are and what we know is valuable information – and not just for marketing folks like me.
<a>Webinar: What Are Employees’ Mobile Apps Doing Behind Your Back?</a>
How to measure your cybersecurity performanceAbhishek Sood
This document discusses the challenges of cybersecurity benchmarking for CIOs and introduces Security Ratings as a solution. Some of the key challenges of benchmarking include: the difficulty gathering accurate metrics over time to compare performance to peers; clearly communicating benchmarking results to boards; and identifying security issues affecting competitors. Security Ratings provide an objective, quantitative method to continuously monitor an organization's cybersecurity performance and compare to others in the same industry through daily analysis of external network data, helping CIOs address these challenges.
This paper examines the increased complexity of the healthcare industry, fueled by increasing reliance on automation, information technology, and the changing regulatory and reform environment. Healthcare organizations face an environment characterized by rapid changes in mandates, technology, and stakeholder expectations, all of which combine to increase the consequences of historical risks and generate new risks. Existing informal, siloed, and reactive risk management processes cannot effectively identify and manage the greatest, strategic-level risks facing the industry. Through years of working with commercial and government clients, Booz Allen Hamilton, a leading strategy and technology consulting firm, has developed a proven strategic risk management methodology to ensure the effective management of these strategic risks.
Today, the delegation of risk decisions to the IT team
cannot be the only solution and has to be a shared
responsibility. The board and business executives are
expected to incorporate the management of cyber risk
as part of their business strategy since they are
accountable to stakeholders, regulators and
customers. For the CROs, CISOs, and Security and Risk
Management Professionals to be on the same page,
there has to be a single source of truth for
communicating the impact that cyber risk has on
business outcomes, in a language that everyone can
understand.
Most tech and healthcare executives surveyed viewed cyber attacks as a serious threat to their business and data. While over half were moderately confident in their own security, far fewer were confident in their partners' security. In response, 98% of companies are maintaining or increasing cybersecurity resources, focusing more on response than prevention. Over half of companies now offer cybersecurity as part of their products and services. Increased media coverage has heightened awareness of cyber threats for many executives.
In a survey of U.S. technology and healthcare executives nationwide, Silicon Valley Bank found that companies believe cyber attacks are a serious threat to both their data and their business continuity.
Highlights
- 98% are maintaining or increasing resources devoted to cyber security
- 50% are increasing their cyber security resources, preparing for when, not if, cyber attacks occur
- Just 35% are completely or very confident in the security of their company information, and only 16% feel the same about their business partners
An increasing number of cyber attacks o public and private sector organizations has created an economic "ripple effect" across the globe. To solve this urgent issue, organizations need to recruit, build and train a cyber security workforce of IT professionals that can keep up with sophisticated security threats.
Índice de software sin licencia en el mundo. Luis Noguera
The document is a report from BSA | The Software Alliance on global software usage trends. Some key findings:
- The rate of unlicensed software installations decreased modestly globally from 43% in 2013 to 39% in 2015.
- Despite awareness of security risks, unlicensed usage remains high in some regions and industries.
- Effective software asset management and employee education are needed to further reduce unlicensed usage and realize cost savings while mitigating security risks.
The document discusses the risks IT infrastructure can pose to businesses and provides recommendations to improve security. It covers:
1) There are three elements of security - overall security, hacking, and privacy of data within IT systems.
2) Recent high-profile security failures show how breaches can damage reputation and business. Proper encryption, storage, and access rules for different types of data are critical to reduce risks.
3) Organizations need clear ownership and accountability for IT security and should regularly review security processes, access, and compliance with best practices. Outsourced IT providers also require oversight to ensure security standards are met.
Jacob Olcott of BitSight Technologies discusses how security leaders can better answer questions from boards about how secure an organization is. He notes that traditional metrics focus too much on compliance and auditing rather than operational effectiveness. Key metrics for boards are the detection deficit gap that measures how long it takes to detect and remove malware, and how an organization's security compares to industry peers which BitSight's ratings can provide. When presenting metrics, security leaders should limit the number presented and use visuals rather than text to avoid overwhelming boards with too much information.
This document provides an overview and buyer's guide for next generation endpoint protection (NGEP). It discusses the limitations of traditional antivirus software and the evolving threat landscape. A new behavior-based approach using NGEP is presented as a solution. Key criteria for evaluating NGEP vendors are outlined, including the critical capabilities an effective solution should provide. SentinelOne is presented as an NGEP option, highlighting its behavior monitoring approach and ability to detect, prevent, and remediate both known and unknown threats.
This document provides a guide to help organizations prepare for and respond to data breaches and incidents. It discusses the growing risk of data breaches and outlines best practices for data lifecycle management. These include implementing an effective Data Incident Plan, understanding how data flows through an organization from collection to destruction, and designating personnel responsible for data protection. The goal is to help organizations enhance security, respond quickly to incidents, and minimize negative impacts to consumers and business operations.
These slides - based on the webinar featuring David Monahan, research director for security and risk management at leading IT analyst firm Enterprise Management Associates (EMA), and David Cramer, vice president of product management for Data Center Automation and Cloud at BMC - cover how to set a strategy to protect your organization.
Attend this webinar to:
• Understand the risks of the misalignment between security and operations
• Learn what tools and technology are available to help bridge the gap between security and operations
• Build your game plan to help your organization bridge the gap
With malware attacks growing more sophisticated, swift, and dangerous by the day — and billions of dollars spent to combat them — surprisingly few organizations have a grip on the problem. Only 20 percent of security professionals surveyed by Information Security Media Group (ISMG) rated their incident response program “very effective.” Nearly two-thirds struggle to detect APTs, limiting their ability to defend today’s most pernicious threats. In addition, more than 60 percent struggle with the speed of detection, and more than 40 percent struggle with the accuracy of detection. Those shortcomings give attackers more time to steal data and embed their malware deeper into targeted systems. For the latest threat intelligence reports, visit https://www.fireeye.com/current-threats/threat-intelligence-reports.html.
These slides - based on the webinar featuring David Monahan, research director for security and risk management at leading IT analyst firm Enterprise Management Associates (EMA), and David Cramer, vice president of product management for Data Center Automation and Cloud at BMC - reveal key data on data breashes.
Few these slides to:
- Understand the risks of the misalignment between security and operations
- Learn what tools and technology are available to help bridge the gap between security and operations
- Build your game plan to help your organization bridge the gap
This document discusses different types of security assessments:
1) Technical security testing assesses security flaws through vulnerability assessments, network penetration testing, web application testing, and source code analysis.
2) Security process assessments evaluate weaknesses in security processes by reviewing frameworks like NIST CSF and COBIT.
3) Security audits involve compliance checks both internally and externally to verify proper security controls are in place.
La autora expresa su agradecimiento a su padre por siempre estar ahí para ella cuando se siente triste, respetar su forma de vestir y de ser, dejarla ser ella misma y divertirse como quiere, respetar sus espacios e interesarse por lo que le pasa, hacerla sentir que puede lograr grandes cosas, demostrarle que aunque se equivoque puede levantarse y seguir adelante, enseñarle que el amor la hace una mejor persona y aunque no siempre haya estado presente, saber que donde quiera que esté la protege y cuida mucho.
Technology integration means more than just teaching computer skills, it should support four key components of learning: active engagement, participation in groups, frequent interaction and feedback, and connections to real world experts. Effective technology integration occurs when technology use is routine, transparent, and supports curriculum goals. Technology integration can engage students through projects that challenge them intellectually and expose them to modern workplace skills, while allowing teachers to take on advisory roles and coaches.
Claudine florence three tools to use in a singing careerclaudine7874
This document provides advice for building a singing career using three main tools: originality, using instruments, and the internet. It advises being original and using your own sound rather than following trends. Using instruments can help you stand out from computer-generated music. The internet has launched many music careers by allowing artists to share their work with a global audience on platforms like SoundCloud, ReverbNation, and iTunes. It also recommends owning your unique voice and gaining insight from similar artists while staying true to your own style.
This document is from a website called Coupon Caboodle that provides local grocery store and restaurant coupons in Chicago, Illinois. Users can sign up by providing their contact information and selecting whether they want grocery store coupons, restaurant coupons, or both. After signing up, users will gain access to coupons in several formats including printable coupons, online coupon codes, mobile coupons, and the ability to load coupons onto savings cards.
2013 cost of data breach study - Global analysisBee_Ware
This document provides an executive summary of the 2013 Cost of Data Breach Study: Global Analysis report conducted by Ponemon Institute and sponsored by Symantec. The study analyzed the costs of data breaches for 277 organizations across 9 countries. Some key findings include: the average global cost of a data breach was $136 per record but costs varied significantly by country; the US and Germany had the costliest breaches at $188 and $199 per record respectively; malicious attacks were the most expensive type of breach; and factors like security measures, response plans, and notification speed impacted breach costs.
The document discusses the growing threat of hacking web applications. It notes that web applications have become vital to most organizations but can be weak links in security. It outlines the types of attackers, including black hat hackers, organized criminals, and hacktivists. Most attacks are untargeted, using automated tools to scan for known vulnerabilities. Small to medium organizations are most at risk due to underfunding security. Proper security requires ongoing commitment through practices like testing, maintenance, and using tools like web application firewalls.
The document summarizes the findings of a study that tested over 5,000 web applications for vulnerabilities. It found that 99% of applications had at least one vulnerability, and 82% had at least one high or critical vulnerability. The most common vulnerability was cross-site scripting (61%). The banking industry had the fewest vulnerabilities while retail had the most. On average, each application contained 35 vulnerabilities.
Growth of electricity_sector_in_india_from_1947-2011sudpal88
This document provides an overview of the growth of India's electricity sector from 1947 to 2011. It details the expansion of installed generation capacity from 1362 MW in 1947 to over 173626 MW in 2011 through various 5-year plans. Transmission infrastructure including transmission lines above and below 66kV has also grown substantially. The number of electrified villages has increased from around 1500 in 1947 to over 537947 in 2011, providing access to 90.6% of India's total villages. Per capita electricity consumption has also risen steadily over the years. The document presents statistics on sector-wise growth patterns in generation capacity and includes charts, graphs, tables and maps depicting historical trends in the development of India's power sector.
This document summarizes DDoS threat trends from 2013 to early 2014 based on attacks seen by Incapsula. Key findings include:
- 81% of network attacks in the last 90 days used multiple vectors simultaneously, with over a third employing 3 or more vectors. This multi-vector approach allows attackers to bypass defenses.
- Large SYN floods combined with regular SYN floods ("SYN combo attacks") accounted for around 75% of large-scale network attacks above 20Gbps.
- NTP amplification attacks increased significantly in early 2014 and became the most common vector for large attacks in February 2014.
- Application layer attacks increased 240% from 2013, with over half originating from India, China, and Iran
By 2015, there will be nearly 15 billion network-connected devices as more people use smartphones and other mobile devices for work. While IT departments see benefits to embracing the BYOD trend, there are also security challenges to allowing personal devices on business networks. Nearly half of employees with personal devices for work have let others use their devices, potentially exposing companies' data. The document advocates that businesses get prepared for BYOD through security measures and policies to handle the risks of mobile devices in the workplace.
COVID-19 free penetration tests by Pentest-Tools.comPentest-Tools.com
We offered companies free penetration tests so they could improve their security and better cope with the emerging cyberattacks.
The report covers top security issues we found and experts' recommendations to avoid attacks that disrupt businesses.
The document discusses common fallacies around application security and provides realities to counter each fallacy. It addresses 8 fallacies: 1) That application security is cost prohibitive, 2) It is too complex, 3) Covering only critical apps is enough, 4) It is only for software vendors, 5) Developers won't change processes for it, 6) One technology can handle it, 7) Network/firewall security covers apps, 8) Testing purchased software is unnecessary. The document advocates a comprehensive approach using multiple techniques like static, dynamic, and interactive testing to effectively secure applications.
This document discusses how continuous delivery of software is putting pressure on security teams to keep up with frequent releases. It describes how leading companies are using Fortify's application security solutions to scan more applications faster, better prioritize issues, and integrate security testing throughout development. By shifting security left to earlier phases, these companies find and fix vulnerabilities sooner, reducing remediation time and allowing for faster software delivery cycles to support business needs. The document surveys software security operations at several large financial, energy, and technology companies to evaluate how Fortify helps with scan setup, performance, triaging, remediation, and scalability.
Want to know how to secure your web apps from cyber-attacks? Looking to know the Best Web Application Security Best Practices? Check this article, we delve into six essential web application security best practices that are important for safeguarding your web applications and preserving the sanctity of your valuable data.
Selling Your Organization on Application SecurityVeracode
You’ve studied the best practices, charted out your course and are ready to embark on your application security journey. But there is still one roadblock that could derail your entire program if you ignore it – getting buy-in from the rest of your company. You see, application security is unlike other forms of security in that it directly impacts the productivity of multiple teams outside the IT and security teams. Who are the groups you need to work with? At what point in the planning and execution stages should you engage with these teams? And why are they so concerned with your application security strategy? The answer to these questions can be found in this short, yet informative presentation. You'll learn about the teams you need to work with, and how to best communicate and work with them to ensure the success of your application security program.
This article will look at common mistakes that organizations make on the path to achieving vulnerability management perfection, both in process and technology areas.
White Paper: 7 Security Gaps in the Neglected 90% of your ApplicationsSonatype
The combination of growing component usage, coupled with lack of security, requires us to urgently re-evaluate traditional application security approaches and identify practical next steps for closing these security gaps.
The document discusses an application security platform that provides end-to-end security across web, mobile, and legacy applications. It utilizes multiple techniques like static analysis, dynamic analysis, software composition analysis, and web perimeter monitoring to identify vulnerabilities. The platform was designed for scale as a cloud-based service to securely manage global application infrastructures. It implements structured governance programs backed by security experts to help enterprises reduce risks across their software supply chains.
Hannah and Alex discuss treating security like a product by focusing on measurable outcomes and controllable inputs rather than compliance checklists. For small organizations, this involves threat modeling, establishing relevant security controls, determining success metrics, defaulting to automation, and iterating based on feedback. For large organizations, specialized security product teams may emerge to help operational teams meet security goals, such as application security validation engineers who help developers understand and manage risk. The goal is aligning security and business objectives through a "team of teams" approach.
With cybercrime (like denial of service, malware, phishing, and SQL injection) looming large in our digitized world, penetration testing - and code and application level security testing (SAST and DAST) - are essential for organizations to identify security loopholes in applications and beyond. We provide a guide to the salient standards and techniques for full-spectrum testing to safeguard your data - and reputation.
An integrated security approach is needed to combat cybercrime by incorporating proactive planning, risk management, and gaining greater control over security. Organizations must consider security governance of suppliers, understand where they use open source software, and ensure privacy of data through assessments of applications and identifying critical data. Hewlett Packard Enterprise is committed to enhancing defenses against evolving cyber threats through security standards, policies, and legislation.
5 STEP PROCESS TO MOBILE RISK MANAGEMENT
1/ Understand how employees want to use Mobile Devices and Applications
2/ Identify potential threats
3/ Define the impact to the business based on probable threat scenarios
4/ Develop policies and procedures to protect the business to an acceptable level
5/ Implement manageable procedural and technical controls, and monitor their effectiveness
Research Article On Web Application SecuritySaadSaif6
This Is The Totally Hand Written Research Article On
Web Application Security
(Improving Critical Web-based Applications Quality Through In depth Security Analysis)
This Research Article Was Made By Me After The Hard Working Of One Month. Its Best And Suitable For Your Research Paper And Also Used In Class For Present It And For Submission.
The document discusses the need for continuous security monitoring in modern IT environments. It argues that traditional, periodic security assessments are no longer sufficient given how quickly technology and threats are evolving. Continuous security monitoring allows organizations to adapt security as quickly as their infrastructure and applications change. The document recommends starting with established frameworks like NIST SP 800-137 or the SANS 20 critical security controls and implementing tools and processes for asset management, configuration management, vulnerability management, access control, and incident response. This represents a shift from compliance-driven security to an automated, ongoing approach.
WhiteHat Security "Website Security Statistics Report" FULL (Q1'09)Jeremiah Grossman
The WhiteHat Website Security Statistics Report provides a one-of-a-kind perspective on the state of website security and the issues that organizations must address to avert attack. WhiteHat has been publishing the report, which highlights the top ten vulnerabilities, vertical market trends and new attack vectors, since 2006.
The WhiteHat report presents a statistical picture of current website vulnerabilities, accompanied by WhiteHat expert analysis and recommendations. WhiteHat’s report is the only one in the industry to focus solely on unknown vulnerabilities in custom Web applications, code unique to an organization, within real-world websites.
WhiteHat issues continued installments of the Website Security Statistics Report on a quarterly basis. To ensure the report remains useful and relevant, WhiteHat incorporates feedback and ideas from leading industry thought leaders and influencers. Based on feedback already received, the latest report includes: comparing vulnerability prevalence by severity, top ten vulnerability classes sorted by percentage likelihood and an outline of the types of technology typically encountered during WhiteHat vulnerability assessments mapped with the associated vulnerability percentage breakdown.
The document discusses how to gain buy-in for an application security program from key teams within an organization. It emphasizes that application security affects all employees and that input is needed from the development team, legal team, procurement team, marketing team, and executive team. It provides advice on how to approach each team, including consulting the development team early in the planning process, focusing conversations with the legal team on risk reduction, and leveraging the procurement team to influence vendor security practices. Gaining input and support from these internal stakeholders is crucial to the success of the application security program.
Similar to Website Security Statistics Report 2013 (20)
Les francais et la protection des données personnellesBee_Ware
Cette enquête de l’institut CSA fournit un état des lieux des préoccupations liées à la protection des données personnelles en France. Réalisée auprès de plus de 1000 personnes, cette étude met en évidence la prise de conscience des français face aux risques d’usurpation d’identité ou de vol de données sensibles.
Top ten big data security and privacy challengesBee_Ware
The document discusses the top 10 security and privacy challenges of big data. It begins by explaining how big data has expanded through streaming cloud technology, rendering traditional security mechanisms inadequate. It then outlines a 3-step process used to identify the top 10 challenges: 1) interviewing CSA members and reviewing trade journals to draft an initial list, 2) studying published solutions, and 3) characterizing remaining problems as challenges if solutions did not adequately address problem scenarios. The top 10 challenges are then grouped into 4 aspects: infrastructure security, data privacy, data management, and integrity and reactive security. The first challenge discussed in detail is securing computations in distributed programming frameworks.
This report provides an overview of global compliance with the Payment Card Industry Data Security Standard (PCI DSS) based on hundreds of assessments conducted between 2011-2013. The key findings are that only around 11% of companies assessed were fully compliant with all 12 PCI DSS requirements, and the report identifies areas where organizations commonly struggle with compliance. It recommends that organizations view PCI compliance as an ongoing process that requires executive sponsorship and should be part of wider governance, risk, and compliance efforts.
Les entreprises européennes sont elles bien armées pour affronter les cyber a...Bee_Ware
Réalisée par Steria, cette étude présente les nouvelles attaques informatiques et leur impact en termes business, financier et d’atteinte à la réputation.
Maitriser la ssi pour les systèmes industrielsBee_Ware
Ce document présente les enjeux sécuritaires liés aux systèmes informatiques industriels. Découvrez les mythes, vulnérabilités et impacts potentiels ainsi qu’une check list de bonnes pratiques à suivre.
1) The document discusses a European consumer survey on attitudes toward biometric technology, which authenticates people using physical characteristics like fingerprints, face, iris, and veins. 2) The majority of citizens across European countries support using biometrics to identify criminals and authenticate identity cards/passports. 3) However, fewer than half of European citizens favor replacing bank PIN numbers with biometrics due to privacy concerns over this highly innovative technology.
This document summarizes the findings of a study on managing complexity in identity and access management (IAM) conducted by Ponemon Institute. Some key findings:
1) Most organizations find their IAM processes overly complex and difficult to manage, with over 300 information resources and 1200 access requests per month on average.
2) Respondents believe access changes are not fulfilled in a timely manner, access requests are not always verified against policies, and IAM policies are not strictly enforced.
3) The costs of IAM failures are estimated at $105 million annually on average due to lost productivity, revenue, and technical support costs.
4) Growth of unstructured data, mobile devices, regulations,
The document provides 8 predictions for cybersecurity threats in 2014:
1) Advanced malware volume will decrease but attacks will become more targeted and stealthy.
2) A major data-destruction attack such as ransomware will successfully target organizations.
3) Attackers will increasingly target cloud data rather than enterprise networks.
4) Exploit kits like Redkit and Neutrino will struggle for dominance following the arrest of the Blackhole exploit kit author.
5) Java vulnerabilities will remain highly exploitable and exploited with expanded consequences.
6) Attackers will use professional social networks like LinkedIn to target executives and organizations.
7) Cybercriminals will target weaker links in organizations
Guide de mise en oeuvre d'une authentification forte avec une cpsBee_Ware
Destiné plus spécifiquement aux chefs de projets et aux architectes techniques et applicatifs, ce guide présente la mise en œuvre d’une authentification forte avec une carte CPS (Carte de Professionnels de Santé).
The 2013 Cost of Data Breach Study: France found that the average cost of a data breach in France increased from €122 per lost or stolen record in 2011 to €127 per record in 2012. The total average organizational cost of a data breach also rose over this period, from €2.55 million to €2.86 million. Malicious attacks were the most common cause of breaches, accounting for 42% of cases. Lost business costs, which include customer churn, increased sharply from €0.78 million in 2011 to €1.19 million in 2012. Certain organizational factors like having an incident response plan in place were found to lower the costs of a breach.
Monitoring and Managing Anomaly Detection on OpenShift.pdfTosin Akinosho
Monitoring and Managing Anomaly Detection on OpenShift
Overview
Dive into the world of anomaly detection on edge devices with our comprehensive hands-on tutorial. This SlideShare presentation will guide you through the entire process, from data collection and model training to edge deployment and real-time monitoring. Perfect for those looking to implement robust anomaly detection systems on resource-constrained IoT/edge devices.
Key Topics Covered
1. Introduction to Anomaly Detection
- Understand the fundamentals of anomaly detection and its importance in identifying unusual behavior or failures in systems.
2. Understanding Edge (IoT)
- Learn about edge computing and IoT, and how they enable real-time data processing and decision-making at the source.
3. What is ArgoCD?
- Discover ArgoCD, a declarative, GitOps continuous delivery tool for Kubernetes, and its role in deploying applications on edge devices.
4. Deployment Using ArgoCD for Edge Devices
- Step-by-step guide on deploying anomaly detection models on edge devices using ArgoCD.
5. Introduction to Apache Kafka and S3
- Explore Apache Kafka for real-time data streaming and Amazon S3 for scalable storage solutions.
6. Viewing Kafka Messages in the Data Lake
- Learn how to view and analyze Kafka messages stored in a data lake for better insights.
7. What is Prometheus?
- Get to know Prometheus, an open-source monitoring and alerting toolkit, and its application in monitoring edge devices.
8. Monitoring Application Metrics with Prometheus
- Detailed instructions on setting up Prometheus to monitor the performance and health of your anomaly detection system.
9. What is Camel K?
- Introduction to Camel K, a lightweight integration framework built on Apache Camel, designed for Kubernetes.
10. Configuring Camel K Integrations for Data Pipelines
- Learn how to configure Camel K for seamless data pipeline integrations in your anomaly detection workflow.
11. What is a Jupyter Notebook?
- Overview of Jupyter Notebooks, an open-source web application for creating and sharing documents with live code, equations, visualizations, and narrative text.
12. Jupyter Notebooks with Code Examples
- Hands-on examples and code snippets in Jupyter Notebooks to help you implement and test anomaly detection models.
[OReilly Superstream] Occupy the Space: A grassroots guide to engineering (an...Jason Yip
The typical problem in product engineering is not bad strategy, so much as “no strategy”. This leads to confusion, lack of motivation, and incoherent action. The next time you look for a strategy and find an empty space, instead of waiting for it to be filled, I will show you how to fill it in yourself. If you’re wrong, it forces a correction. If you’re right, it helps create focus. I’ll share how I’ve approached this in the past, both what works and lessons for what didn’t work so well.
For the full video of this presentation, please visit: https://www.edge-ai-vision.com/2024/06/temporal-event-neural-networks-a-more-efficient-alternative-to-the-transformer-a-presentation-from-brainchip/
Chris Jones, Director of Product Management at BrainChip , presents the “Temporal Event Neural Networks: A More Efficient Alternative to the Transformer” tutorial at the May 2024 Embedded Vision Summit.
The expansion of AI services necessitates enhanced computational capabilities on edge devices. Temporal Event Neural Networks (TENNs), developed by BrainChip, represent a novel and highly efficient state-space network. TENNs demonstrate exceptional proficiency in handling multi-dimensional streaming data, facilitating advancements in object detection, action recognition, speech enhancement and language model/sequence generation. Through the utilization of polynomial-based continuous convolutions, TENNs streamline models, expedite training processes and significantly diminish memory requirements, achieving notable reductions of up to 50x in parameters and 5,000x in energy consumption compared to prevailing methodologies like transformers.
Integration with BrainChip’s Akida neuromorphic hardware IP further enhances TENNs’ capabilities, enabling the realization of highly capable, portable and passively cooled edge devices. This presentation delves into the technical innovations underlying TENNs, presents real-world benchmarks, and elucidates how this cutting-edge approach is positioned to revolutionize edge AI across diverse applications.
Freshworks Rethinks NoSQL for Rapid Scaling & Cost-EfficiencyScyllaDB
Freshworks creates AI-boosted business software that helps employees work more efficiently and effectively. Managing data across multiple RDBMS and NoSQL databases was already a challenge at their current scale. To prepare for 10X growth, they knew it was time to rethink their database strategy. Learn how they architected a solution that would simplify scaling while keeping costs under control.
Best 20 SEO Techniques To Improve Website Visibility In SERPPixlogix Infotech
Boost your website's visibility with proven SEO techniques! Our latest blog dives into essential strategies to enhance your online presence, increase traffic, and rank higher on search engines. From keyword optimization to quality content creation, learn how to make your site stand out in the crowded digital landscape. Discover actionable tips and expert insights to elevate your SEO game.
The Microsoft 365 Migration Tutorial For Beginner.pptxoperationspcvita
This presentation will help you understand the power of Microsoft 365. However, we have mentioned every productivity app included in Office 365. Additionally, we have suggested the migration situation related to Office 365 and how we can help you.
You can also read: https://www.systoolsgroup.com/updates/office-365-tenant-to-tenant-migration-step-by-step-complete-guide/
Generating privacy-protected synthetic data using Secludy and MilvusZilliz
During this demo, the founders of Secludy will demonstrate how their system utilizes Milvus to store and manipulate embeddings for generating privacy-protected synthetic data. Their approach not only maintains the confidentiality of the original data but also enhances the utility and scalability of LLMs under privacy constraints. Attendees, including machine learning engineers, data scientists, and data managers, will witness first-hand how Secludy's integration with Milvus empowers organizations to harness the power of LLMs securely and efficiently.
What is an RPA CoE? Session 1 – CoE VisionDianaGray10
In the first session, we will review the organization's vision and how this has an impact on the COE Structure.
Topics covered:
• The role of a steering committee
• How do the organization’s priorities determine CoE Structure?
Speaker:
Chris Bolin, Senior Intelligent Automation Architect Anika Systems
5th LF Energy Power Grid Model Meet-up SlidesDanBrown980551
5th Power Grid Model Meet-up
It is with great pleasure that we extend to you an invitation to the 5th Power Grid Model Meet-up, scheduled for 6th June 2024. This event will adopt a hybrid format, allowing participants to join us either through an online Mircosoft Teams session or in person at TU/e located at Den Dolech 2, Eindhoven, Netherlands. The meet-up will be hosted by Eindhoven University of Technology (TU/e), a research university specializing in engineering science & technology.
Power Grid Model
The global energy transition is placing new and unprecedented demands on Distribution System Operators (DSOs). Alongside upgrades to grid capacity, processes such as digitization, capacity optimization, and congestion management are becoming vital for delivering reliable services.
Power Grid Model is an open source project from Linux Foundation Energy and provides a calculation engine that is increasingly essential for DSOs. It offers a standards-based foundation enabling real-time power systems analysis, simulations of electrical power grids, and sophisticated what-if analysis. In addition, it enables in-depth studies and analysis of the electrical power grid’s behavior and performance. This comprehensive model incorporates essential factors such as power generation capacity, electrical losses, voltage levels, power flows, and system stability.
Power Grid Model is currently being applied in a wide variety of use cases, including grid planning, expansion, reliability, and congestion studies. It can also help in analyzing the impact of renewable energy integration, assessing the effects of disturbances or faults, and developing strategies for grid control and optimization.
What to expect
For the upcoming meetup we are organizing, we have an exciting lineup of activities planned:
-Insightful presentations covering two practical applications of the Power Grid Model.
-An update on the latest advancements in Power Grid -Model technology during the first and second quarters of 2024.
-An interactive brainstorming session to discuss and propose new feature requests.
-An opportunity to connect with fellow Power Grid Model enthusiasts and users.
For the full video of this presentation, please visit: https://www.edge-ai-vision.com/2024/06/how-axelera-ai-uses-digital-compute-in-memory-to-deliver-fast-and-energy-efficient-computer-vision-a-presentation-from-axelera-ai/
Bram Verhoef, Head of Machine Learning at Axelera AI, presents the “How Axelera AI Uses Digital Compute-in-memory to Deliver Fast and Energy-efficient Computer Vision” tutorial at the May 2024 Embedded Vision Summit.
As artificial intelligence inference transitions from cloud environments to edge locations, computer vision applications achieve heightened responsiveness, reliability and privacy. This migration, however, introduces the challenge of operating within the stringent confines of resource constraints typical at the edge, including small form factors, low energy budgets and diminished memory and computational capacities. Axelera AI addresses these challenges through an innovative approach of performing digital computations within memory itself. This technique facilitates the realization of high-performance, energy-efficient and cost-effective computer vision capabilities at the thin and thick edge, extending the frontier of what is achievable with current technologies.
In this presentation, Verhoef unveils his company’s pioneering chip technology and demonstrates its capacity to deliver exceptional frames-per-second performance across a range of standard computer vision networks typical of applications in security, surveillance and the industrial sector. This shows that advanced computer vision can be accessible and efficient, even at the very edge of our technological ecosystem.
Digital Banking in the Cloud: How Citizens Bank Unlocked Their MainframePrecisely
Inconsistent user experience and siloed data, high costs, and changing customer expectations – Citizens Bank was experiencing these challenges while it was attempting to deliver a superior digital banking experience for its clients. Its core banking applications run on the mainframe and Citizens was using legacy utilities to get the critical mainframe data to feed customer-facing channels, like call centers, web, and mobile. Ultimately, this led to higher operating costs (MIPS), delayed response times, and longer time to market.
Ever-changing customer expectations demand more modern digital experiences, and the bank needed to find a solution that could provide real-time data to its customer channels with low latency and operating costs. Join this session to learn how Citizens is leveraging Precisely to replicate mainframe data to its customer channels and deliver on their “modern digital bank” experiences.
Driving Business Innovation: Latest Generative AI Advancements & Success StorySafe Software
Are you ready to revolutionize how you handle data? Join us for a webinar where we’ll bring you up to speed with the latest advancements in Generative AI technology and discover how leveraging FME with tools from giants like Google Gemini, Amazon, and Microsoft OpenAI can supercharge your workflow efficiency.
During the hour, we’ll take you through:
Guest Speaker Segment with Hannah Barrington: Dive into the world of dynamic real estate marketing with Hannah, the Marketing Manager at Workspace Group. Hear firsthand how their team generates engaging descriptions for thousands of office units by integrating diverse data sources—from PDF floorplans to web pages—using FME transformers, like OpenAIVisionConnector and AnthropicVisionConnector. This use case will show you how GenAI can streamline content creation for marketing across the board.
Ollama Use Case: Learn how Scenario Specialist Dmitri Bagh has utilized Ollama within FME to input data, create custom models, and enhance security protocols. This segment will include demos to illustrate the full capabilities of FME in AI-driven processes.
Custom AI Models: Discover how to leverage FME to build personalized AI models using your data. Whether it’s populating a model with local data for added security or integrating public AI tools, find out how FME facilitates a versatile and secure approach to AI.
We’ll wrap up with a live Q&A session where you can engage with our experts on your specific use cases, and learn more about optimizing your data workflows with AI.
This webinar is ideal for professionals seeking to harness the power of AI within their data management systems while ensuring high levels of customization and security. Whether you're a novice or an expert, gain actionable insights and strategies to elevate your data processes. Join us to see how FME and AI can revolutionize how you work with data!
"Choosing proper type of scaling", Olena SyrotaFwdays
Imagine an IoT processing system that is already quite mature and production-ready and for which client coverage is growing and scaling and performance aspects are life and death questions. The system has Redis, MongoDB, and stream processing based on ksqldb. In this talk, firstly, we will analyze scaling approaches and then select the proper ones for our system.
Introduction of Cybersecurity with OSS at Code Europe 2024Hiroshi SHIBATA
I develop the Ruby programming language, RubyGems, and Bundler, which are package managers for Ruby. Today, I will introduce how to enhance the security of your application using open-source software (OSS) examples from Ruby and RubyGems.
The first topic is CVE (Common Vulnerabilities and Exposures). I have published CVEs many times. But what exactly is a CVE? I'll provide a basic understanding of CVEs and explain how to detect and handle vulnerabilities in OSS.
Next, let's discuss package managers. Package managers play a critical role in the OSS ecosystem. I'll explain how to manage library dependencies in your application.
I'll share insights into how the Ruby and RubyGems core team works to keep our ecosystem safe. By the end of this talk, you'll have a better understanding of how to safeguard your code.
Building Production Ready Search Pipelines with Spark and MilvusZilliz
Spark is the widely used ETL tool for processing, indexing and ingesting data to serving stack for search. Milvus is the production-ready open-source vector database. In this talk we will show how to use Spark to process unstructured data to extract vector representations, and push the vectors to Milvus vector database for search serving.
Fueling AI with Great Data with Airbyte WebinarZilliz
This talk will focus on how to collect data from a variety of sources, leveraging this data for RAG and other GenAI use cases, and finally charting your course to productionalization.
2. INTRODUCTION
WhiteHat Security’s Website Security Statistics Report provides a one-of-a-kind perspective on the state of
website security and the issues that organizations must address in order to conduct business online safely.
Website security is an ever-moving target. New website launches are common, new code is released
constantly, new Web technologies are created and adopted every day; as a result, new attack techniques are
frequently disclosed that can put every online business at risk. In order to stay protected, enterprises must
receive timely information about how they can most efficiently defend their websites, gain visibility into the
performance of their security programs, and learn how they compare with their industry peers. Obtaining
these insights is crucial in order to stay ahead and truly improve enterprise website security.
To help, WhiteHat Security has been publishing its Website Security Statistics Report since 2006. This report
is the only one that focuses exclusively on unknown vulnerabilities in custom Web applications, code that
is unique to an organization, and found in real-world websites. The underlying data is hundreds of terabytes
in size, comprises vulnerability assessment results from tens of thousands of websites across hundreds of the
most well-known organizations, and collectively represents the largest and most accurate picture of website
security available. Inside this report is information about the most prevalent vulnerabilities, how many get
fixed, how long the fixes can take on average, and how every application security program may measurably
improve. The report is organized by industry, and is accompanied by WhiteHat Security’s expert analysis and
recommendations.
Through its Software-as-a-Service (SaaS) offering, WhiteHat Sentinel, WhiteHat Security is uniquely positioned
to deliver the depth of knowledge that organizations require to protect their brands, attain compliance, and
avert costly breaches.
ABOUT WHITEHAT SECURITY
Founded in 2001 and headquartered in Santa Clara, California, WhiteHat Security provides end-to-end
solutions for Web security. The company’s cloud website vulnerability management platform and leading
security engineers turn verified security intelligence into actionable insights for customers. Through a
combination of core products and strategic partnerships, WhiteHat Security provides complete Web security
at a scale and accuracy unmatched in the industry. WhiteHat Sentinel, the company’s flagship product line,
currently manages more than 15,000 websites – including sites in the most regulated industries, such as top
e-commerce, financial services and healthcare companies.
2 WEBSITE SECURITY STATISTICS REPORT | MAY 2013
3. N
EXECUTIVE SUMMARY
Whether you read the Verizon Data Breach Incidents Report, the Trustwave Global Security
Report, the Symantec Internet Security Threat Report, or essentially all other reports throughout
the industry, the story is the same -- websites and web applications are one of, if not the
leading target of cyber-attack. This has been the case for years. Website breaches lead directly
propagation, and loss of customers. Given modern society’s ever-increasing reliance on the web,
the impact of a breach and the associated costs are going up, and fast. While an organization
may ultimately survive a cyber-crime incident, the business disruption is often severe. It is far
preferable to do something now to avert and minimize harm before disaster strikes.
is not the answer. These controls provide nearly zero protection against today’s web-based
attacks. So while protecting the network and the host layers is still important, forward-thinking
professionals are now seeing the bigger picture of computer security for what it really is: a
software security problem.
What’s needed is more secure software, NOT more security software.
Understanding this subtle distinction is key. Organizations must demand that software be
designed in a way that makes it resilient against attack and does not require additional security
products to protect it. The question that organizations should be asking themselves is: how
do we integrate security throughout the software development life-cycle (SDLC)? How do we
procure this type of software?
As simple as these questions sound, the answers have proven elusive. Most responses by the socalled experts are based purely on personal anecdote and devoid of any statistically compelling
evidence, such as the data presented in this report. Many of these experts will cite various “bestpractices,” such as software security training for developers, security testing during QA, static
code analysis, centralized controls, Web Application Firewalls, penetration-testing, and more;
however, the term “best-practices” implies the activity is valuable in every organization at all
times. The reality, though, is that just because a certain practice works well for one organization
does not mean it will work at another. Unfortunately, this hasn’t prevented many from
and important operational considerations.
The net result: websites no less hackable today than they were yesterday.
Organizations need to better understand how various parts of the SDLC affect the introduction of
vulnerabilities, which leave the door open to breaches. For example, we would like to
WEBSITE SECURITY STATISTICS REPORT | MAY 2013
3
4. say, “organizations that provide software security training for their developers experience
25% fewer serious vulnerabilities annually than those who do not.” Or, “organizations that
perform application security testing prior to each major production release not only have fewer
statement today because the supporting data does not exist -- at least, not yet. If we had these
insights, supported by empirical evidence, it would be nothing less than a game changer.
program. Questions such as: how often do you perform security tests on your code during QA?
vulnerability outcomes and breaches is far more complicated than we ever imagined.
respects overall website security continues to show steady signs of improvement despite the
stream of news headlines.
4 WEBSITE SECURITY STATISTICS REPORT | MAY 2013
5. Next, this report will detail various software security controls (or “best-practices”) our
customers said were in place, and will directly correlate those responses with WhiteHat Sentinel
vulnerability data:
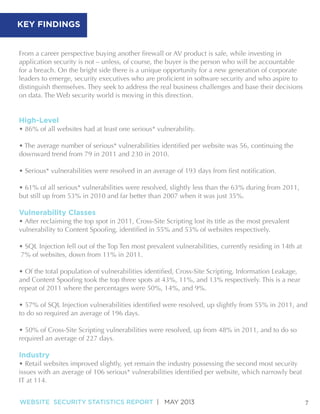
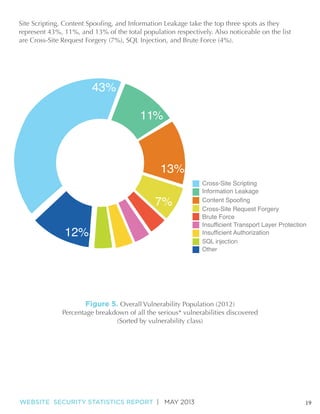
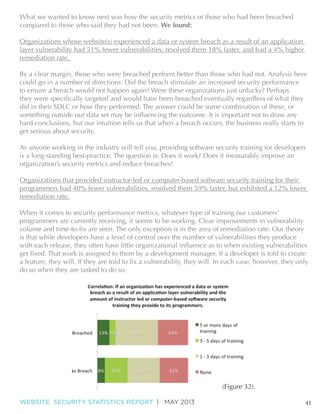
• 57% of organizations said they provide some amount of instructor-led or computer-based
software security training for their programmers. These organizations experienced 40% fewer
vulnerabilities, resolved them 59% faster, but exhibited a 12% lower remediation rate.
• 53% of organizations said their software projects contain an application library or framework
that centralizes and enforces security controls. These organizations experienced 64% more
vulnerabilities, resolved them 27% slower, but demonstrated a 9% higher remediation rate.
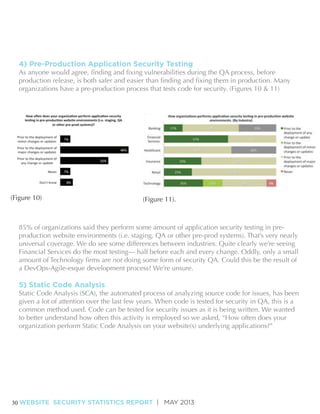
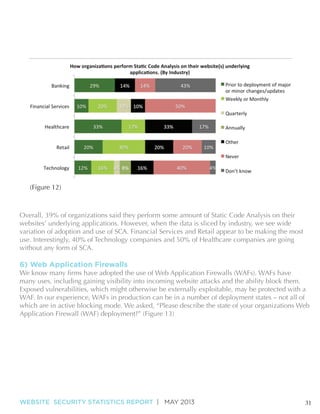
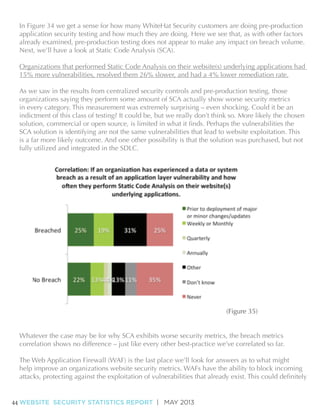
• 39% of organizations said they perform some amount of Static Code Analysis on their
website(s) underlying applications. These organizations experienced 15% more vulnerabilities,
resolved them 26% slower, and had a 4% lower remediation rate.
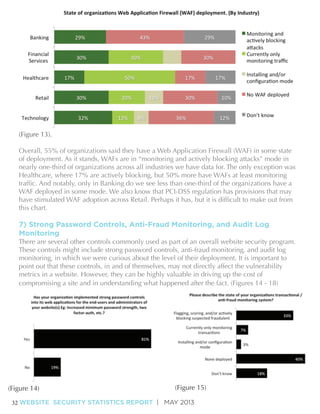
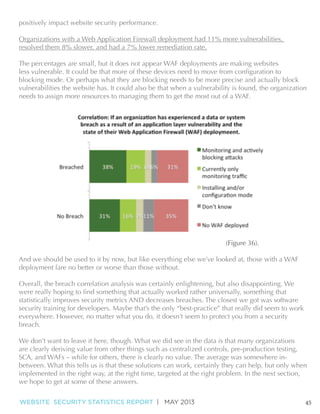
• 55% of organizations said they have a Web Application Firewall (WAF) in some state of
deployment. These organizations experienced 11% more vulnerabilities, resolved them 8%
slower, and had a 7% lower remediation rate.
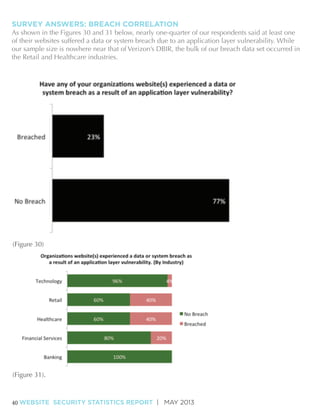
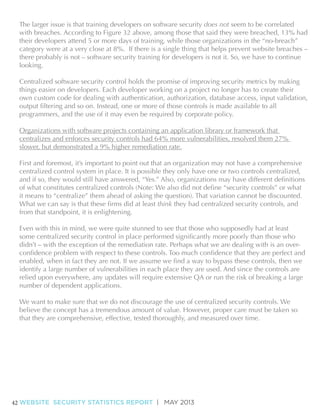
•23% of organizations website(s) said they experienced a data or system breach as a result of
an application layer vulnerability. These organizations experienced 51% fewer vulnerabilities,
resolved them 18% faster, and had a 4% higher remediation rate.
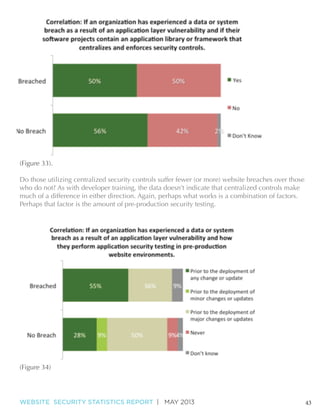
Much of the data above seems reasonable, even logical, while other bits seem completely
counterintuitive. For instance, organizations that do perform Static Code Analysis or have a Web
Application Firewall appear to have notably worse performance metrics than those who did
neither.
One explanation may be that these metrics are precisely WHY these organizations [recently]
have fewer vulnerabilities). This remains to be seen. It could also be that they are misusing or
engaged. What we know for sure is there are customers for whom these solutions absolutely
make a measurable positive impact -- we see it in the data -- while others receive no discernible
that there are in fact few, if any, truly universal application best-practices.
to do so, it could be because they don’t understand the issues well enough. If this is the case,
this is a good indication that providing training is a good idea. It could also easily be that a long
WEBSITE SECURITY STATISTICS REPORT | MAY 2013
5
6. prioritization and risk management is recommended, as is considering a Web Application
Firewall with virtual patching capabilities. Either way this is why it is important for organizations
to know their metrics and know what application security problems they really have. The
alternative is blind adoption of “best-practices” that may only serve to disrupt the software
development process for no tangible gain. Too often this is exactly what happens.
We were also curious about business drivers and the impact of compliance on website security.
By a slim margin, organizations said their #1 driver for resolving vulnerabilities was compliance,
narrowly ahead of risk reduction. At the same time, when we asked the same organizations to
rank the reasons why their vulnerabilities go unresolved, compliance was cited as the #1 reason.
Proponents of compliance often suggest that mandatory regulatory controls be treated as a
nice concept in casual conversation, this is not the enterprise reality we see. Keep in mind that
WhiteHat Sentinel reports are often used to satisfy a plethora of auditors, but WhiteHat Security
is not a PCI-DSS ASV nor a QSA vendor. When organizations are required to allocate funds
toward compliance, which may or may not enhance security, there are often no resources left or
tolerance by the business to do anything more effective.
Finally, we also wanted to know what part(s) of the organization are held accountable in the
event of a website(s) data or system breach: we found that 79% said the Security Department
would be accountable. Additionally, 74% said Executive Management, 66% Software
Development, and 22% Board of Directors. By analyzing the data in this report, we see
evidence of a direct correlation between increased accountability and decreased breaches, and
For example, if developers are required by compliance to attend security training, they’ll view
it as a checkbox activity and not internalize much of anything they’ve learned in training.
However, if the organization places accountability on developers should a breach occur, all of
a sudden training effectiveness increases, because now there is an obvious incentive to learn.
When you empower those who are also accountable, whatever best-practices are then put into
place have a higher likelihood of being effective. For security to really improve, some part of the
organization must be held accountable. This is our working theory, the underlying narrative of
our report.
Here is the biggest lesson and the common theme we’re seeing: software security has not yet
percolated into the collective consciousness as something organizations actually need to do
something about proactively. While much lip service may be paid, we must address the issue
that application security professionals are essentially selling preventative medicine, while much
of the buying population still behaves with a wait-for-a-visit-to-the-emergency-room attitude
before kicking into gear. This is a dangerous policy and in stark contrast to their pious rhetoric,
which attempts to obfuscate that reality.
6 WEBSITE SECURITY STATISTICS REPORT | MAY 2013
8. • Every single Manufacturing, Education, Energy, Government, and Food & Beverage website
• The industries that remediated the largest percentage of their serious* vulnerabilities on
average were Entertainment & Media (81%), Telecommunications (74%), and Energy (71%)
• The industries that remediated the fewest percentage of their serious* vulnerabilities on
Survey: Application Security in the SDLC (Basic)
• 57% of organizations said they provide some amount of instructor led or computer-based
• 85% of organizations said they perform some amount of application security testing in pre-
deployment
• Organizations said their #1 driver for resolving vulnerabilities was “Compliance,” narrowly
• In the event an organization experiences a website(s) data or system breach, 79% said the
8 WEBSITE SECURITY STATISTICS REPORT | MAY 2013
9. Survey: Application Security In The SDLC (Sentinel Correlation)
• Organizations that provided instructor led or computer-based software security training for
their programmers had 40% fewer vulnerabilities, resolved them 59% faster, but exhibited a 12%
lower remediation rate.
• Organizations with software projects containing an application library or framework that
centralizes and enforces security controls had 64% more vulnerabilities, resolved them 27%
slower, but demonstrated a 9% higher remediation rate.
• Organizations that performed Static Code Analysis on their website(s) underlying applications
had 15% more vulnerabilities, resolved them 26% slower, and had a 4% lower remediation rate.
• Organizations with a Web Application Firewall deployment had 11% more vulnerabilities,
resolved them 8% slower, and had a 7% lower remediation rate.
• Organizations whose website(s) experienced a data or system breach as a result of an
application layer vulnerability had 51% fewer vulnerabilities, resolved them 18% faster, and had
a 4% higher remediation rate.
AT A GLANCE:
THE CURRENT STATE OF WEBSITE SECURITY
1000
800
600
400
200
2007
2008
2009
2009
WEBSITE SECURITY STATISTICS REPORT | MAY 2013
2010
2011
9
10. Over the last year we saw continued reduction in the average number of serious* vulnerabilities
vulnerability reduction trend is welcome news, there are several possible explanations that must
remind readers that this report illustrates a best-case scenario: websites are, at a minimum,
vulnerabilities is likely a combination of several factors:
believe otherwise, websites generally may in fact be getting more “secure” — that is to say,
to increased investment, and increased investment eventually leads to vulnerability reduction
attestation of security readiness before business relationships move forward, things tend to
automated attacks rather than sentient adversaries because of their value to the business and/
truth to this, we have seen reports released by our peers and their numbers are not far off from
10 WEBSITE SECURITY STATISTICS REPORT | MAY 2013
11. for them to produce code that’s resilient to issues such as Cross-Site Scripting and SQL Injection
without requiring them to know much about the technical details.
While overall vulnerability reduction is no doubt positive, the sheer number of serious*
vulnerabilities in the wild is quite stunning. Consider for a moment that there are 1.8 million
private. At 56 vulnerabilities per website, we can estimate that there are over 100 million serious
vulnerabilities undiscovered on the Web.
To put these numbers in context, understanding how we count is essential. If a particular
URL has 5 total parameters, 3 of which are vulnerable to SQL Injection, we count that as 3
vulnerabilities – not 5 or 1. Next consider all the discrete Web applications that make up a
website’s attack surface, each of which may have several input parameters, and the many ways
each parameter may be exploited by dozens of vulnerability classes; then multiply that over
a year with constant application code updates. Within that frame of reference, the volume of
vulnerabilities may not appear so unreasonable.
Vulnerability counts alone do not provide a clear picture of the current state of website
vulnerability (Time-to-Fix), the percentage of reported vulnerabilities that are no longer
exploitable (Remediation Rate), and the average number of days a website is exposed to at
least one serious* vulnerability (Window-of-Exposure). As these metrics are tallied at each
isolated and improved.
WEBSITE SECURITY STATISTICS REPORT | MAY 2013
11
12. Beyond just vulnerability volume, the high percentage of websites being vulnerable to at least
80% or greater – in some industries even at 100% – but that these numbers have been largely
unchanged over the years. This suggests that building web applications is inherently a task
that lends itself to vulnerabilities. We are not inclined to simply blame developers – that’s too
easy, and unfair – as applications increasingly become more complex and attack surface of
applications grows with each newly added feature.
As no remedy can be instantaneous, it is important to measure the amount of time,required to
resolve certain vulnerabilities (Time-to-Fix). Resolution could take the form of a software update,
window of opportunity for malicious hackers to exploit the website.
it proves that we are recording and socializing – both upwards and downwards – the wrong
metrics to effect change. Fortunately some industries are doing quite well, but overall, a tracked
disappearing, this statistic may require correlation with another data point to be instructive.
Perhaps that’s the declining number of serious vulnerabilities.
The most common question we receive regarding the Average Time-to-Fix (Days) and Average
Remediation Rate statistics is: why does it take so long for organizations to remediate
vulnerabilities they’ve been informed of? To the uninitiated, the choice would seem to be a nobrainer. The fact is, again, these vulnerabilities are not resolved with a simple vendor supplied
patch. This is almost always customer code we’re dealing with and, as such, it requires the
creation of a custom patch. So while many contributing factors may play into the eventual
security is a trade-off.
will for certain cost the organization money? Or resolve a vulnerability that might be exploited
and might cost the company money? The challenge is this decision must be made every day
with incomplete information. There is no guarantee that any single vulnerability will get
exploited today, tomorrow, or ever – and if so, what the costs will be to the organization.
under resolved:
12 WEBSITE SECURITY STATISTICS REPORT | MAY 2013
13. Factors inhibiting organizations from remediating vulnerabilities:
• No one at the organization understands, or is responsible for, maintaining the code.
• No one at the organization knows about, understands, or respects the vulnerability.
• Affected code is owned by an unresponsive third-party vendor.
deprecated websites under the Sentinel Service still in active use for over two years.
Later in the “Survey: Application Security In The SDLC” section of this report, we asked
customers to rank the prevalence of these issue. The results were highly illuminating.
This is a good opportunity to point out that while an individual programmer can be in control
of what net-new vulnerabilities they produce with each release, they often don’t have much
by development managers.
that improve true risk-decision making capabilities. With better data we can help development
accurately decide which issues can wait till later and be placed under the watchful eye of the
operational security team.
such as centralized security controls, or temporarily mitigate issues that will land in production
systems no matter what is done in the SDLC. A virtual patch using a Web Application Firewall
number of vulnerabilities so that these tough choices are faced far less often than they are today.
Websites are an ongoing business concern and security must be ensured all the time, not just at
a single vulnerability, on any given day, to win. That’s why the true Key Performance Indicator
WEBSITE SECURITY STATISTICS REPORT | MAY 2013
13
14. Figure 3. Overall Window of Exposure to Serious* Vulnerabilities (2012)
The percentage of websites that fall within a particular Window of Exposure zone
(Sorted by industry)
Window-of-Exposure is the number of days in a year a website is exposed to at least one
serious* vulnerability. As such, Window-of-Exposure is an informative combination of the total
these metrics, or a combination thereof, may be the area that has the greatest impact on a given
organization’s Window-of-Exposure outcome. To provide context, let’s consider two identical
websites, SiteA and SiteB.
1)
had at least one of those issues publicly exposed.
2)
had at least one of those issues publicly exposed.
14 WEBSITE SECURITY STATISTICS REPORT | MAY 2013
15. Despite having 10 times the number of vulnerabilities, we would argue that during the last
year SiteB had a substantially better security posture than SiteA as measured by the Windowof-Exposure. It is revealing to see how various industries perform in the area of Window-ofExposure. Figure 3 illustrates 2012 performance by industry.
why a particular development group in a single organization seemingly performs better than
the rest. All told, the data shows that the industry in which a particular website falls seems
to, at best, only slightly correlate to an expected security posture. Previous reports have also
explored potential correlations that may exist between organization size and development
framework/programming language in use, but only small performance variations emerge.
vulnerable than others.
MOST COMMON VULNERABILITIES
Now that we have an understanding of the average total number of serious* vulnerabilities,
Time-to-Fix, Remediation Rates, and Window of Exposure across industry verticals, we’ll
look at the distribution of vulnerability classes. In Figure 4, the most prevalent vulnerabilities
classes are calculated based upon their percentage likelihood of at least one instance being
found within any given website. This approach minimizes data skewing in websites that are
either highly secure or extremely risk-prone.
WEBSITE SECURITY STATISTICS REPORT | MAY 2013
15
16. be exploited. To achieve that level of clarity it is necessary to compare our data against reports
such Verizon’s Data Breach Investigation Report, Trustwave Global Security Report, and others
that describe actual incident data. This type of analysis goes beyond our current scope. For
future.
(1 & 2)
websites respectively. Last year, coincidentally, those percentages were exactly opposite. While
seems to have stalled. A potential reason for this is the sheer number of them in the average
Note: For those unfamiliar, Information Leakage is largely a catch-all term used to describe
a vulnerability where a website reveals sensitive data, such as technical details of the Web
for a typical visitor, but may be used by an attacker to exploit the system, its hosting network,
or users. Common examples are a failure to scrub out HTML/ JavaScript comments containing
differences in page responses for valid versus invalid data.
JavaScript). This vulnerability class is most often used to force a website to display content
Brute Force moved up to fourth from sixth place in the last year and increased 10 percentage
combination is incorrect. Due to spammers mining for valid email addresses, which double as
usernames on a variety of websites, enterprises have an increased awareness and appreciation
for the problem. In these cases we adjust the severity of Brute Force vulnerability accordingly.
asserting that nearly every website has at least one vulnerability, particularly those with login
16 WEBSITE SECURITY STATISTICS REPORT | MAY 2013
17. prophecy of sorts.
footprint their target’s web presence and enumerate as much information as possible. Pieces of
information may include the target’s platform distribution and version, web application software
exploit one or more vulnerabilities in the target website.
Note: While the presence of Fingerprinting as a class is new, we must point out that these
placing them under the label of Information Leakage. In 2012 a change was made to break them
7)
of websites in 2012. This class allows communication to be exposed to untrusted third parties,
on the given website.
8) Session Fixation moved from #9 in 2011 to #8 in 2012 and increased by four percentage
valid after the user successfully authenticates. Fortunately, because of the nature of this issue, it
Fixation problems to go away from that particular website entirely.
9)
websites and a vulnerability once largely under-appreciated, has proved itself to be an effective
from one page to another on the same website, or sent off to a completely different website.
WEBSITE SECURITY STATISTICS REPORT | MAY 2013
17
18. effectively compromised.
Note: It is important to understand that websites did not suddenly become vulnerable to this
label, so we expect these numbers to climb over time because the issue is indeed pervasive.
10)
experienced a large decline during 2012, and now resides in tenth place on the list and is
authenticated or non-authenticated user can access data or functionality that their privilege level
should not allow. For example, User A can surreptitiously obtain data from User B’s account,
or perform actions reserved only for Admins, perhaps simply by changing a single number in a
URL.
in, typically these vulnerabilities are not overly voluminous; they are simple oversights and
vulnerabilities are indicative of a need for a huge platform upgrade, often put off for as long
at least one of them. The most probable explanation of the drop is the separating out of URL
Redirector Abuse vulnerabilities from this class.
Another very extremely notable change from 2011 to 2012 is that SQL Injection no longer
to compromise websites and steal the data they possess. This is yet another proof point that
vulner
2011 and 2010. While progress is being made, wiping out particular vulnerability classes
prevalence by class in the overall vulnerability population. Notice how greatly it differs from the
18 WEBSITE SECURITY STATISTICS REPORT | MAY 2013
19. 43%
11%
13%
7%
12%
WEBSITE SECURITY STATISTICS REPORT | MAY 2013
Cross-Site Scripting
Information Leakage
Content Spoofing
Cross-Site Request Forgery
Brute Force
Insufficient Transport Layer Protection
Insufficient Authorization
SQL injection
Other
19
20. INDUSTRY SCORECARDS
the organization’s current security posture compares to their peers or competitors. They want
and valuable information, or perhaps a reputation or brand that is particularly attractive to a
impossible, and the attempt is prohibitively expensive and for many completely unnecessary
If an organization is a target of opportunity, a goal of being just above average with respect to
and therefore easier to breach, targets. On the other hand, if an organization is a target of
efforts are detectable, preventable, and in case of a compromise, survivable. This is due to the
exploit.
Whether an organization is a target of choice or a target of opportunity, the following Industry
Scorecards have been prepared to help organizations to visualize how its security posture
20 WEBSITE SECURITY STATISTICS REPORT | MAY 2013
21. Banking Industry Scorecard
April 2013
AT A GLANCE
THE CURRENT
STATE OF
WEBSITE SECURITY
PERCENT OF ANALYZED
SITES WITH A SERIOUS*
VULNERABILITY
81
%
AVERAGE NUMBER OF
SERIOUS* VULNERABILITIES
PER SITE PER YEAR
11
PERCENT OF SERIOUS*
VULNERABILITIES
THAT HAVE BEEN FIXED
AVERAGE TIME
TO FIX
54 107
%
DAYS
*Serious vulnerabilities are defined as those in which an attacker could take control over all, or a part, of a website, compromise user accounts, access sensitive data or violate compliance requirements.
MOST COMMON
VULNERABILITIES
30%
TOP SEVEN
VULNERABILITY
CLASSES
20%
10%
26%
Cross-Site
Scripting*
21%
Information
Leakage*
9%
9%
Brute Force*
Content
Spoofing*
8%
Fingerprinting*
8%
5%
Cross-Site
Insufficient
Request Forgery* Authorization*
*The percent of sites that had at least one example of...
EXPOSURE AND CURRENT DEFENSE
DAYS OVER A YEAR THAT A SITE IS EXPOSED TO SERIOUS* VULNERABILITIES
CURRENT APPLICATION SECURITY BEHAVIORS AND CONTROLS
USED BY ORGANIZATIONS
100%
80%
60%
24%
33%
9% 11%
24%
40%
20%
24% Always Vulnerable
33% Frequently Vulnerable 271-364 days a year
9% Regularly Vulnerable 151-270 days a year
11% Occasionally Vulnerable 31-150 days a year
Rarely Vulnerable 30 days or less a year
57%
29%
57%
29%
71%
Programmers receive instructor led or computer-based software security training
Applications contain a library or framework that centralizes and enforces security controls
Perform Static Code Analysis on their website(s) underlying applications
Web Application Firewall Deployed
Transactional / Anti-Fraud Monitoring System Deployed
WEBSITE SECURITY STATISTICS REPORT | MAY 2013
21
22. Financial Services
Industry Scorecard
AT A GLANCE
PERCENT OF ANALYZED
SITES WITH A SERIOUS*
VULNERABILITY
THE CURRENT
STATE OF
WEBSITE SECURITY
81
%
AVERAGE NUMBER OF
SERIOUS* VULNERABILITIES
PER SITE PER YEAR
PERCENT OF SERIOUS*
VULNERABILITIES
THAT HAVE BEEN FIXED
AVERAGE TIME
TO FIX
50 67 226
%
DAYS
*Serious vulnerabilities are defined as those in which an attacker could take control over all, or a part, of a website, compromise user accounts, access sensitive data or violate compliance requirements.
MOST COMMON
VULNERABILITIES
TOP SEVEN
VULNERABILITY
CLASSES
30%
20%
10%
31%
Information
Leakage*
25%
Cross-Site
Scripting*
9%
12%
Content
Spoofing*
8%
Cross-Site
request Forgery*
7%
Brute Force*
Directory
Indexing*
7%
SQL injection*
*The percent of sites that had at least one example of...
EXPOSURE AND CURRENT DEFENSE
DAYS OVER A YEAR THAT A SITE IS EXPOSED TO SERIOUS* VULNERABILITIES
CURRENT APPLICATION SECURITY BEHAVIORS AND CONTROLS
USED BY ORGANIZATIONS
100%
80%
60%
28%
28%
10% 10%
23%
40%
20%
28% Always Vulnerable
38% Frequently Vulnerable 271-364 days a year
10% Regularly Vulnerable 151-270 days a year
10% Occasionally Vulnerable 31-150 days a year
23% Rarely Vulnerable 30 days or less a year
64%
50%
50%
70%
40%
Programmers receive instructor led or computer-based software security training
Applications contain a library or framework that centralizes and enforces security controls
Perform Static Code Analysis on their website(s) underlying applications
Web Application Firewall Deployed
Transactional / Anti-Fraud Monitoring System Deployed
22 WEBSITE SECURITY STATISTICS REPORT | MAY 2013
23. Healthcare Industry Scorecard
April 2013
AT A GLANCE
THE CURRENT
STATE OF
WEBSITE SECURITY
PERCENT OF ANALYZED
SITES WITH A SERIOUS*
VULNERABILITY
90
%
AVERAGE NUMBER OF
SERIOUS* VULNERABILITIES
PER SITE PER YEAR
PERCENT OF SERIOUS*
VULNERABILITIES
THAT HAVE BEEN FIXED
AVERAGE TIME
TO FIX
22 53 276
%
DAYS
*Serious vulnerabilities are defined as those in which an attacker could take control over all, or a part, of a website, compromise user accounts, access sensitive data or violate compliance requirements.
MOST COMMON
VULNERABILITIES
30%
TOP SEVEN
VULNERABILITY
CLASSES
20%
10%
40%
29%
Cross Site
Scripting*
Information
Leakage*
13%
22%
Content
Spoofing*
12%
Insufficent
Transport
Layer Protection*
10%
Cross Site
Request
Forgery*
Session
Fixation*
9%
Brute Force*
*The percent of sites that had at least one example of...
EXPOSURE AND CURRENT DEFENSE
DAYS OVER A YEAR THAT A SITE IS EXPOSED TO SERIOUS* VULNERABILITIES
CURRENT APPLICATION SECURITY BEHAVIORS AND CONTROLS
USED BY ORGANIZATIONS
100%
80%
60%
49%
22%
12%
7%
10%
40%
20%
48% Always Vulnerable
22% Frequently Vulnerable 271-364 days a year
12% Regularly Vulnerable 151-270 days a year
7% Occasionally Vulnerable 31-150 days a year
10% Rarely Vulnerable 30 days or less a year
67%
50%
83%
67%
34%
Programmers receive instructor led or computer-based software security training
Applications contain a library or framework that centralizes and enforces security controls
Perform Static Code Analysis on their website(s) underlying applications
Web Application Firewall Deployed
Transactional / Anti-Fraud Monitoring System Deployed
WEBSITE SECURITY STATISTICS REPORT | MAY 2013
23
24. Retail Industry Scorecard
April 2013
AT A GLANCE
PERCENT OF ANALYZED
SITES WITH A SERIOUS*
VULNERABILITY
THE CURRENT
STATE OF
WEBSITE SECURITY
91
%
AVERAGE NUMBER OF
SERIOUS* VULNERABILITIES
PER SITE PER YEAR
PERCENT OF SERIOUS*
VULNERABILITIES
THAT HAVE BEEN FIXED
AVERAGE TIME
TO FIX
106 54 224
%
DAYS
*Serious vulnerabilities are defined as those in which an attacker could take control over all, or a part, of a website, compromise user accounts, access sensitive data or violate compliance requirements.
MOST COMMON
VULNERABILITIES
TOP SEVEN
VULNERABILITY
CLASSES
30%
20%
10%
31%
25%
Information
Leakage*
Cross Site
Scripting*
9%
12%
8%
Cross Site
Request
Forgery*
Content
Spoofing*
7%
Brute Force*
Directory
Indexing*
7%
SQL Injection*
*The percent of sites that had at least one example of...
EXPOSURE AND CURRENT DEFENSE
DAYS OVER A YEAR THAT A SITE IS EXPOSED TO SERIOUS* VULNERABILITIES
CURRENT APPLICATION SECURITY BEHAVIORS AND CONTROLS
USED BY ORGANIZATIONS
100%
80%
60%
54%
21%
6%
5%
13%
40%
20%
54% Always Vulnerable
21% Frequently Vulnerable 271-364 days a year
6% Regularly Vulnerable 151-270 days a year
5% Occasionally Vulnerable 31-150 days a year
13% Rarely Vulnerable 30 days or less a year
73%
70%
90%
60%
70%
Programmers receive instructor led or computer-based software security training
Applications contain a library or framework that centralizes and enforces security controls
Perform Static Code Analysis on their website(s) underlying applications
Web Application Firewall Deployed
Transactional / Anti-Fraud Monitoring System Deployed
24 WEBSITE SECURITY STATISTICS REPORT | MAY 2013
25. Technology
Industry Scorecard
April 2013
AT A GLANCE
THE CURRENT
STATE OF
WEBSITE SECURITY
PERCENT OF ANALYZED
SITES WITH A SERIOUS*
VULNERABILITY
85
%
AVERAGE NUMBER OF
SERIOUS* VULNERABILITIES
PER SITE PER YEAR
PERCENT OF SERIOUS*
VULNERABILITIES
THAT HAVE BEEN FIXED
18 61
AVERAGE TIME
TO FIX
71
%
DAYS
*Serious vulnerabilities are defined as those in which an attacker could take control over all, or a part, of a website, compromise user accounts, access sensitive data or violate compliance requirements.
MOST COMMON
VULNERABILITIES
TOP SEVEN
VULNERABILITY
CLASSES
30%
20%
10%
41%
Cross-Site
Scripting*
35%
Information
Leakage*
18%
19%
Content
Spoofing*
12%
14%
Cross-Site
Request Forgery*
Fingerprinting*
Brute Force*
12%
URL Redirector
Abuse*
*The percent of sites that had at least one example of...
EXPOSURE AND CURRENT DEFENSE
DAYS OVER A YEAR THAT A SITE IS EXPOSED TO SERIOUS* VULNERABILITIES
CURRENT APPLICATION SECURITY BEHAVIORS AND CONTROLS
USED BY ORGANIZATIONS
100%
80%
60%
5%
64%
10% 9%
11%
40%
20%
5% Always Vulnerable
64% Frequently Vulnerable 271-364 days a year
10% Regularly Vulnerable 151-270 days a year
9% Occasionally Vulnerable 31-150 days a year
11% Rarely Vulnerable 30 days or less a year
48%
72%
96%
52%
32%
Programmers receive instructor led or computer-based software security training
Applications contain a library or framework that centralizes and enforces security controls
Perform Static Code Analysis on their website(s) underlying applications
Web Application Firewall Deployed
Transactional / Anti-Fraud Monitoring System Deployed
WEBSITE SECURITY STATISTICS REPORT | MAY 2013
25
26. SURVEY
APPLICATION SECURITY IN THE SDLC
More secure software, NOT more security software.
How do we integrate security throughout the software development lifecycle (SDLC)? How do
we measurably improve the security of the software we produce? How do we ensure we are
procuring secure software?
When attempting to address these questions, it is very easy for organizations to throw away
precious time and money. Corporate security teams looking for guidance will often borrow from
various industry standards listing out “best-practices” that are usually just copy-pasted from a
disjointed chain of “experts.” These so-called best-practices might include software security
training for developers, security testing during QA, static code analysis, centralized controls,
Web Application Firewalls, penetration-testing, and others. The term “best-practices” implies
the activity is valuable in every organization at all times. We think most would agree that just
because a certain practice works well for one organization does not mean it will automatically
work well at another.
Of course, we all would like to be able to say, “organizations that provide software security
training for their developers experience 25% fewer serious vulnerabilities annually than those
who do not.” Or, “organizations that perform application security testing prior to each major
production release not only have fewer vulnerabilities year-over-year, but exhibit a 35% faster
Unfortunately, the commonly held assumption is that the listed best-practices above have
somehow been statistically demonstrated to cost-effectively increase software and website
security within any organization – that there is some supporting data-backed evidence, that
there are studies showing vulnerability volumes and breaches go down when these activities are
implemented. The fact is there isn’t any study or data repository to this effect, at least not when it
comes to anything related to website security.
26 WEBSITE SECURITY STATISTICS REPORT | MAY 2013
27. What comes the closest is BSIMM (Building Security In Maturity Model) , a study of 51 realworld software security initiatives – the majority of which are from major corporations. This
study provides keen insight into what these organizations are doing. Unfortunately the observed
data provides zero indication that the activities actually work. By work we mean do they reduce
the occurrence and severity of website breaches. The observations in the study are not paired
NOT
be like if they want to keep from getting hacked.
supposed best-practices, even those performed by large and reputable organizations. With
so much at risk every day online, there must be no tolerance for tradition and sacred cows.
Organizations need to better understand how various parts of their SDLC affect the introduction
of vulnerabilities, which leave the door open to breaches. That said, we used BSIMM as a source
of inspiration, a jumping off point to further the collective understanding of what really works in
software and website security.
To move in this direction, during February 2013, we asked WhiteHat Security customers to assist
do you preform security tests on your code during QA? What is your typical rate of production
code change? Do you perform static code analysis? Have you deployed a Web Application
Firewall? Who in your organization is accountable in the event of a breach? We even asked “has
your website been breached?”
We received survey responses from 76 organizations, surpassing that of BSIMM, and then
correlated those responses with company demographics and WhiteHat Sentinel website
vulnerability data. The results were both stunning and deeply puzzling. The connections
between various software security controls and SDLC behaviors and the vulnerability outcomes
and breaches is far more complicated than we ever imagined.
Note: While we are able to correlate security performance relative to the size of an organization
by revenue and numbers of employees, we did not perform that analysis in this report. This may
be an avenue of additional study later on.
SDLC ACTIVITIES BY INDUSTRY
1) Rate of Production Application Code Change
A reasonable theory is that the rate at which an organization updates production code greatly
affects their overall website security posture. Each code update increases the possibility for new
vulnerabilities to be introduced. At the same time, each change also provides opportunities to
asked, “Please select the answer that best describes the typical rate of production application
code change in your organization’s website(s)” and then sorted the results by industry.
WEBSITE SECURITY STATISTICS REPORT | MAY 2013
27
28. 2) Software Security Training
(Figure 7)
(Figure 8)
28 WEBSITE SECURITY STATISTICS REPORT | MAY 2013
29. Across industries, we see a rather even distribution of training. No industry had near universal
coverage or complete absence of training. Retailers were at the top of the list with roughly threequarters saying their developers had received training. Perhaps this performance is stimulated by
PCI-DSS compliance obligations; we’re unable to say with any certainty. What is also interesting
is Technology had the lowest score by percentage, a little less than half. A cynical theory might
be that this sector feels they already know what they’re doing and does not need security
training. We leave it to the reader to theorize what motivating factors might be at play.
3) Centralized Software Security Controls
Another component of an SDLC is understanding how security is technologically integrated into
an application. For example, to make things easier on developers, libraries and frameworks can
be made available to centralize and enforce security controls. Centralized security controls may
include, but are not limited to authentication, authorization, database access, input validation,
application library or framework that centralizes and enforces security controls?”
(Figure 9)
framework that centralizes and enforces security controls. When results are broken down by
industry, we see all industries making at least some use of them. In Technology and Retail we see
WEBSITE SECURITY STATISTICS REPORT | MAY 2013
29
31. (Figure 12)
Overall, 39% of organizations said they perform some amount of Static Code Analysis on their
websites’ underlying applications. However, when the data is sliced by industry, we see wide
variation of adoption and use of SCA. Financial Services and Retail appear to be making the most
use. Interestingly, 40% of Technology companies and 50% of Healthcare companies are going
without any form of SCA.
6) Web Application Firewalls
many uses, including gaining visibility into incoming website attacks and the ability block them.
Exposed vulnerabilities, which might otherwise be externally exploitable, may be protected with a
WAF. In our experience, WAFs in production can be in a number of deployment states – not all of
which are in active blocking mode. We asked, “Please describe the state of your organizations Web
WEBSITE SECURITY STATISTICS REPORT | MAY 2013
31
32. (Figure 13).
Overall, 55% of organizations said they have a Web Application Firewall (WAF) in some state
of deployment. As it stands, WAFs are in “monitoring and actively blocking attacks” mode in
nearly one-third of organizations across all industries we have data for. The only exception was
Healthcare, where 17% are actively blocking, but 50% more have WAFs at least monitoring
WAF deployed in some mode. We also know that PCI-DSS regulation has provisions that may
this chart.
7) Strong Password Controls, Anti-Fraud Monitoring, and Audit Log
Monitoring
There are several other controls commonly used as part of an overall website security program.
These controls might include strong password controls, anti-fraud monitoring, and audit log
monitoring, in which we were curious about the level of their deployment. It is important to
point out that these controls, in and of themselves, may not directly affect the vulnerability
metrics in a website. However, they can be highly valuable in driving up the cost of
compromising a site and in understanding what happened after the fact. (Figures 14 - 18)
32 WEBSITE SECURITY STATISTICS REPORT | MAY 2013
33. (Figure 17)
(Figure 18)
DRIVERS AND FRICTION
vulnerabilities they are well aware of. We wanted to better understand these dynamics to get a sense
unresolved. (Figures 19 & 20)
WEBSITE SECURITY STATISTICS REPORT | MAY 2013
33
34. By an extremely slim margin, not perceivable
in the chart, organizations said their #1 driver
for resolving vulnerabilities was “Compliance,”
just ahead of “Risk Reduction.” At the same
time, Compliance was cited as the #1 reason
why their vulnerabilities go unresolved. At
then logically the results began to make perfect
sense: When security is driven by something
such as compliance, security teams will do what is required and no more.
(Figure 20)
Proponents of compliance often suggest that mandatory regulatory controls be treated as a “security
it is not the enterprise reality we see. Keep in mind that WhiteHat Sentinel reports are often used to
organizations are required to allocate funds toward compliance, which may or may not enhance
security, there are often no resources left or tolerance by the business to do anything more effective.
see if anything stood out. Here we see Healthcare is heavily motivated by Compliance and Customer
Healthcare websites go unresolved is “No one at the organization understands or is responsible for
maintaining the code.” It seems this sector is challenged by large amounts of legacy code and systems.
Perhaps this explains why we see a large deployment of WAFs in this industry.
answers).
34 WEBSITE SECURITY STATISTICS REPORT | MAY 2013
35. In the Technology sector, vulnerability resolution is driven by Customer / Partner Demand, while
(Figure 21)
WEBSITE SECURITY STATISTICS REPORT | MAY 2013
(Figure 22)
35
37. We also wanted to get a general sense for how organizations perceived internal change control
policies and regulatory requirements as an inhibitor to vulnerability resolution (see Figure 27
below). Across roughly half of all industries, it seems change control policies and regulations
Technology, roughly one in 10 organizations said both have a negative impact “all the time.”
On the other hand, a good number of organizations across all industries said the impact was
WEBSITE SECURITY STATISTICS REPORT | MAY 2013
37
38. “None at all.” The question we were left with is: Why do we see such widely disparate answers
in the exact same industries? How do some organizations effectively manage their change
control policies and regulatory obligations so as not to be slowed down while others are severely
challenged? Clearly this is an area in need of further study.
As we can see from Figure 28 below, if an organization’s #1 driver for resolving vulnerabilities is
Corporate Policy, they perform the best when it comes to Average Vulnerabilities per Site, second
in Average Time-to-Fix, and fourth in Average Number of Vulnerabilities Fixed (Remediation Rate).
If Compliance is the leading driver, they have the speediest Time-to-Fix. When an organizations’
we’ll leave that speculation as an exercise for our readers.
38 WEBSITE SECURITY STATISTICS REPORT | MAY 2013
39. Question:If an organization experiences a website(s) data
or system breach, which part of the organization is held
accountable and and what is its performance?
Average Vulnerabilities
per Site Ranking
Answer:
BOARD OF DIRECTORS
Answer:
EXECUTIVE
MANAGEMENT
Answer:
SOFTWARE
DEVELOPMENT
Answer:
SECURITY
DEPARTMENT
4th
1St
2nd
3rd
Average Time to Fix a
Vulnerability Ranking
3rd
4th
2nd
1st
WEBSITE SECURITY STATISTICS REPORT | MAY 2013
Average Number of
Vulnerabilities Fixed Ranking
1st
3rd
3rd
2nd
39
40. SURVEY ANSWERS: BREACH CORRELATION
As shown in the Figures 30 and 31 below, nearly one-quarter of our respondents said at least one
of their websites suffered a data or system breach due to an application layer vulnerability. While
our sample size is nowhere near that of Verizon’s DBIR, the bulk of our breach data set occurred in
the Retail and Healthcare industries.
40 WEBSITE SECURITY STATISTICS REPORT | MAY 2013
41. What we wanted to know next was how the security metrics of those who had been breached
compared to those who said they had not been. We found:
Organizations whose website(s) experienced a data or system breach as a result of an application
layer vulnerability had 51% fewer vulnerabilities, resolved them 18% faster, and had a 4% higher
remediation rate.
By a clear margin, those who were breached perform better than those who had not. Analysis here
could go in a number of directions: Did the breach stimulate an increased security performance
to ensure a breach would not happen again? Were these organizations just unlucky? Perhaps
did in their SDLC or how they performed. The answer could be some combination of these, or
hard conclusions, but our intuition tells us that when a breach occurs, the business really starts to
get serious about security.
As anyone working in the industry will tell you, providing software security training for developers
is a long-standing best-practice. The question is: Does it work? Does it measurably improve an
organization’s security metrics and reduce breaches?
Organizations that provided instructor-led or computer-based software security training for their
programmers had 40% fewer vulnerabilities, resolved them 59% faster, but exhibited a 12% lower
remediation rate.
When it comes to security performance metrics, whatever type of training our customers’
programmers are currently receiving, it seems to be working. Clear improvements in vulnerability
is that while developers have a level of control over the number of vulnerabilities they produce
do so when they are tasked to do so.
WEBSITE SECURITY STATISTICS REPORT | MAY 2013
41
42. The larger issue is that training developers on software security does not seem to be correlated
with breaches. According to Figure 32 above, among those that said they were breached, 13% had
their developers attend 5 or more days of training, while those organizations in the “no-breach”
category were at a very close at 8%. If there is a single thing that helps prevent website breaches –
there probably is not – software security training for developers is not it. So, we have to continue
looking.
Centralized software security control holds the promise of improving security metrics by making
things easier on developers. Each developer working on a project no longer has to create their
own custom code for dealing with authentication, authorization, database access, input validation,
programmers, and the use of it may even be required by corporate policy.
Organizations with software projects containing an application library or framework that
centralizes and enforces security controls had 64% more vulnerabilities, resolved them 27%
slower, but demonstrated a 9% higher remediation rate.
First and foremost, it’s important to point out that an organization may not have a comprehensive
centralized control system in place. It is possible they only have one or two controls centralized,
it means to “centralize” them ahead of asking the question). That variation cannot be discounted.
think they had centralized security controls, and
from that standpoint, it is enlightening.
Even with this in mind, we were quite stunned to see that those who supposedly had at least
didn’t – with the exception of the remediation rate. Perhaps what we are dealing with is an overidentify a large number of vulnerabilities in each place they are used. And since the controls are
relied upon everywhere, any updates will require extensive QA or run the risk of breaking a large
number of dependent applications.
We want to make sure that we do not discourage the use of centralized security controls. We
believe the concept has a tremendous amount of value. However, proper care must be taken so
that they are comprehensive, effective, tested thoroughly, and measured over time.
42 WEBSITE SECURITY STATISTICS REPORT | MAY 2013
43. (Figure 33).
Do those utilizing centralized security controls suffer fewer (or more) website breaches over those
who do not? As with developer training, the data doesn’t indicate that centralized controls make
much of a difference in either direction. Again, perhaps what works is a combination of factors.
Perhaps that factor is the amount of pre-production security testing.
(Figure 34)
WEBSITE SECURITY STATISTICS REPORT | MAY 2013
43
44. In Figure 34 we get a sense for how many WhiteHat Security customers are doing pre-production
application security testing and how much they are doing. Here we see that, as with other factors
already examined, pre-production testing does not appear to make any impact on breach volume.
Next, we’ll have a look at Static Code Analysis (SCA).
Organizations that performed Static Code Analysis on their website(s) underlying applications had
15% more vulnerabilities, resolved them 26% slower, and had a 4% lower remediation rate.
As we saw in the results from centralized security controls and pre-production testing, those
organizations saying they perform some amount of SCA actually show worse security metrics
in every category. This measurement was extremely surprising – even shocking. Could it be an
indictment of this class of testing? It could be, but we really don’t think so. More likely the chosen
SCA solution is identifying are not the same vulnerabilities that lead to website exploitation. This
is a far more likely outcome. And one other possibility is that the solution was purchased, but not
fully utilized and integrated in the SDLC.
(Figure 35)
Whatever the case may be for why SCA exhibits worse security metrics, the breach metrics
correlation shows no difference – just like every other best-practice we’ve correlated so far.
The Web Application Firewall (WAF) is the last place we’ll look for answers as to what might
help improve an organizations website security metrics. WAFs have the ability to block incoming
44 WEBSITE SECURITY STATISTICS REPORT | MAY 2013
45. positively impact website security performance.
Organizations with a Web Application Firewall deployment had 11% more vulnerabilities,
resolved them 8% slower, and had a 7% lower remediation rate.
The percentages are small, but it does not appear WAF deployments are making websites
blocking mode. Or perhaps what they are blocking needs to be more precise and actually block
vulnerabilities the website has. It could also be that when a vulnerability is found, the organization
needs to assign more resources to managing them to get the most out of a WAF.
(Figure 36).
And we should be used to it by now, but like everything else we’ve looked at, those with a WAF
deployment fare no better or worse than those without.
Overall, the breach correlation analysis was certainly enlightening, but also disappointing. We
statistically improves security metrics AND decreases breaches. The closest we got was software
security training for developers. Maybe that’s the only “best-practice” that really did seem to work
everywhere. However, no matter what you do, it doesn’t seem to protect you from a security
breach.
We don’t want to leave it here, though. What we did see in the data is that many organizations
are clearly deriving value from other things such as centralized controls, pre-production testing,
SCA, and WAFs – while for others, there is clearly no value. The average was somewhere inbetween. What this tells us is that these solutions can work, certainly they can help, but only when
implemented in the right way, at the right time, targeted at the right problem. In the next section,
we hope to get at some of these answers.
WEBSITE SECURITY STATISTICS REPORT | MAY 2013
45
46. SURVEY ANSWERS: ACCOUNTABILITY CORRELATION
If there is one chart in the entire report that really opened our eyes, it is Figure 38. There is a
huge delta between accountability of those who said they were breached and those who haven’t
part of the organization, including the executive management and board of directors, showed
similar results. Combine this with the other charts in the section and the evidence is strong:
Accountability matters a great deal.
Accountability could be the underlying factor that allows SDLC activities such as training for
developers, centralized controls, pre-production testing, SCA, WAFs, etc. to improve security
performance metrics and decrease breaches. Accountability may be the difference between truly
adopting and internalizing the activity and simply treating it as a time-wasting checkbox. The
answer to what works in application and website security may certainly contain a technique and
process level answer, but must include the support of an organizational mandate. The theory
certainly sounds plausible.
46 WEBSITE SECURITY STATISTICS REPORT | MAY 2013
47. (Figure 41).
RECOMMENDATIONS
First and foremost, we believe the data contained in this report provides supportive evidence
of something most information security professionals already instinctively know: accountability
is an absolute necessity for an effective security program. If web and software security are
truly important to an organization, then someone in the organization must not only be held
accountable for security performance, but they must also be empowered to affect change.
frustrate individuals and encourage talent to walk out the door.
Accountability may begin at as high a level as the board of directors, which is often the case
the organization: through executive management to security teams to software developers, and
even through to the software procurement department. Without a foundation of accountability,
even the best-laid plans will fail. The data leads us in this direction. With accountability, there
will be a tangible return on investment regardless of what best-practices an organization might
implement. Furthermore, high-end security talent appreciates this kind of responsibility and
views it as a career advancement opportunity.
Secondly, there are no best-practices. Our data and experience strongly suggest that security
“best-practices” in the software development lifecycle (SDLC) are not universally effective, but
are situation-dependent. Whether referring to source code reviews, security testing during QA,
Web Application Firewalls, or other methods, each has an appropriate time and place. The
challenge in increasing the organization’s security posture cost-effectively is determining what to
recommend, what to implement, what to purchase, and when. Security teams must get this right.
The tactical key to improving a web security program is having a comprehensive metrics
program in place – a system capable of performing ongoing measurement of the security posture
of production systems, exactly where the proverbial rubber meets the road. Doing so
WEBSITE SECURITY STATISTICS REPORT | MAY 2013
47
48. extremely limited.
Below is a step-by-step strategy for building out a website security program that yields results:
0) Assign an individual or group that is accountable for website security: These individuals or
groups may include the board of directors, executive management, security teams, and software
developers. They should be commissioned and authorized to establish a culturally consistent
incentives program that will help move the organization in a positive direction with respect to
security.
1)
the organization deems important. Knowing what systems need to be defended and what
value they have to the organization provides a barometer for an appropriate level of security
investment.
2)
just about identifying vulnerabilities; while that is a byproduct of the exercise, it’s about
understanding what classes of adversaries you need to defend against and what your current
what’s important.
vulnerabilities are introduced per production code release, what vulnerability classes are most
measured tends to improve.
can be substantially minimized.
48 WEBSITE SECURITY STATISTICS REPORT | MAY 2013
49. APPENDIX A: ABOUT THE DATASET
is built on a Software-as-a-Service (SaaS) platform that scales massively, supports the largest
website security.
proprietary scanning technology with custom testing by the industry’s only Threat Research
on technology and business goals.
DATA, PLATFORM, AND METHODOLOGY
many of the
on the Web, owned by organizations that care about the security of their websites.
under service.
schedule, the majority of websites are assessed for vulnerabilities multiple times per month.
WEBSITE SECURITY STATISTICS REPORT | MAY 2013
49
50. IMPORTANT FACTORS INFLUENCING THE DATA
1.
brochureware.
2. The customer-base is largely, but not exclusively, US-based, as are their websites.
exploited in more than one way, each of those are counted as well. We count this way because a
vulnerability in each parameter may actually lead to a different problem in a different part of the
code.
Only serious* vulnerabilities that can be directly and remotely exploitable and that may lead to data
loss or account compromise are included.
For example, if a website mixes SSL content
with non-SSL on the same Web page, while this may be considered a policy violation, it must be
Our vulnerability assessment processes are incremental and ongoing.
7. It is best to view this report as a best-case scenario, and there are always more vulnerabilities to
be found.
conducted in different forms of authenticated state (i.e. user, admin, etc.).
8.
9.
vulnerabilities.
The Platform
by severity and threat.
The Methodology
50 WEBSITE SECURITY STATISTICS REPORT | MAY 2013
51. exploited and does not rely solely on default scanner settings.
Scanning Technology
• Production Safe (PE, SE, BE): Non-invasive testing with less performance impact than a single user.
•
•
• Authenticated Scans: Patented automated login and session-state management for complete website
coverage.
•
authorization component.
APPENDIX B
At a Glance: The Current State of Website Security (2011)
(Sorted by Industry)
WEBSITE SECURITY STATISTICS REPORT | MAY 2013
51