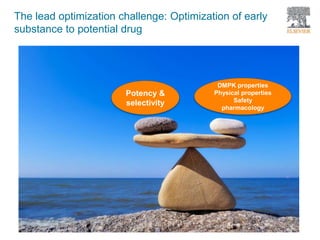
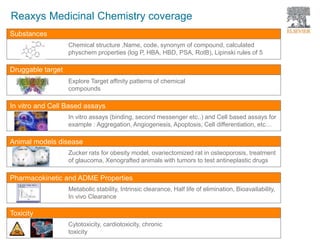
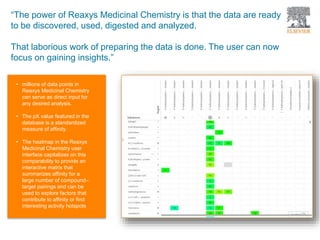
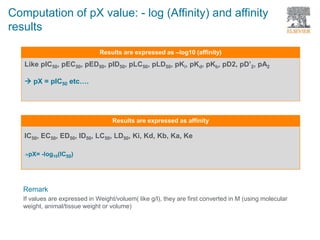
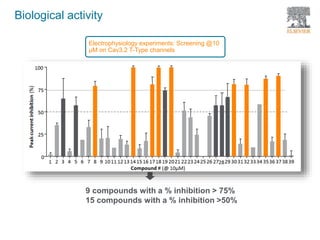
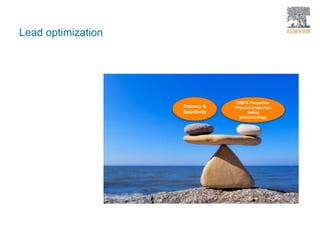
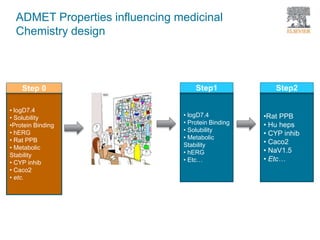
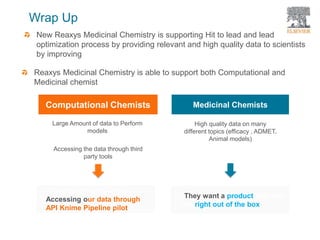
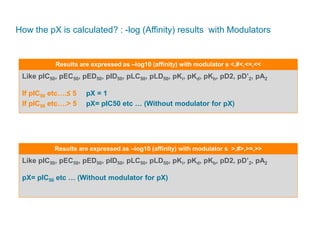
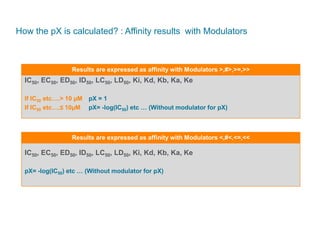
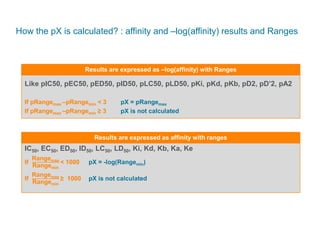
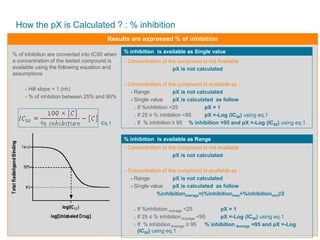
The document discusses Reaxys Medicinal Chemistry and how it supports hit-to-lead and lead optimization processes. It provides high quality data on topics like efficacy, ADMET properties, and animal models to help computational and medicinal chemists. The pX concept normalizes bioactivity measurements like IC50, Ki, and % inhibition into a single comparable metric, making it possible to compare compound affinity regardless of the metric reported. This allows researchers to more easily search for and analyze active compounds.

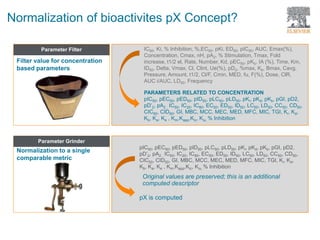


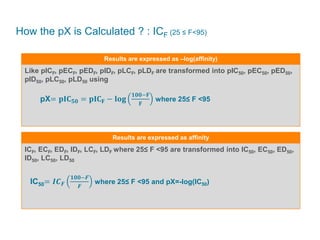
![How the pX is Calculated ? : Qualitative results
- Not Active (NA)
pX = 1
- @ Active
Concentration of the compound is not Available
pX is not calculated
Concentration of the compound is available
Range pX = -Log [Concentration min]
Single value pX = -Log [Concentration]
Results are expressed as Qualitative](https://image.slidesharecdn.com/webinarnewrmcwebinarleadoptimizationjune082017-170610215834/85/Webinar-New-RMC-Your-lead_optimization-Solution-June082017-29-320.jpg)


