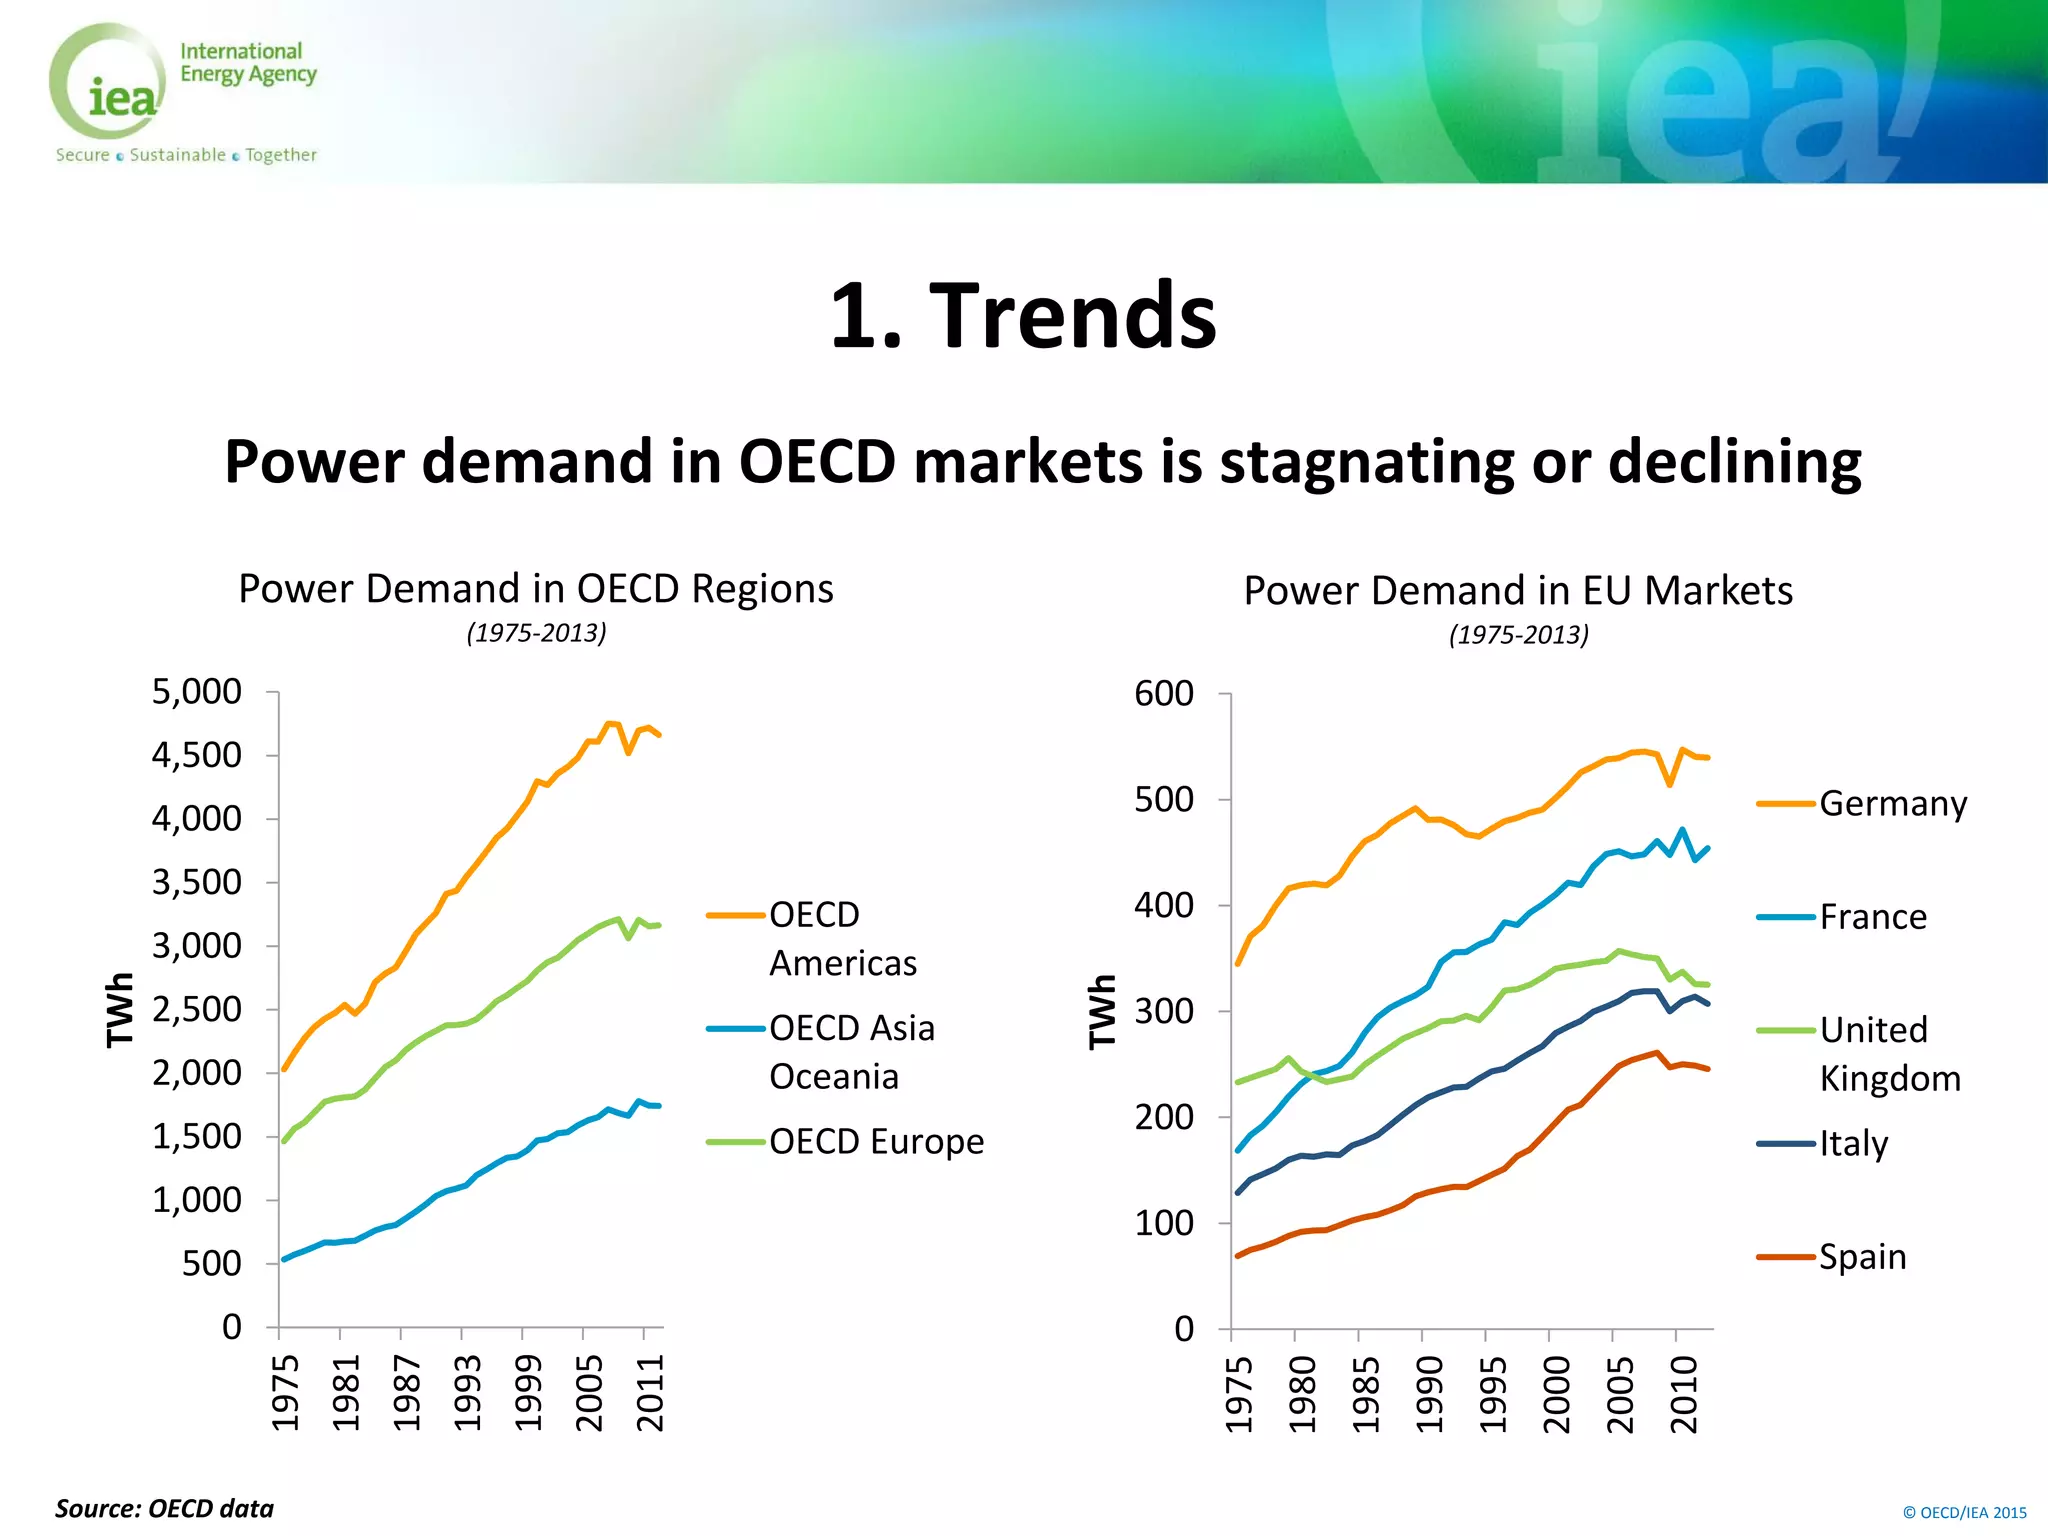
© OECD/IEA 2015
Argus Emissions Markets 2016
Decarbonising EU Power
Trends and Challenges
3rd March 2016
Matt Gray
Consultant Analyst
International Energy Agency
matthew.gray@iea.org
© OECD/IEA 2015
Overview
1. Trends
 Changes to power demand
 Fossil-fuel versus low-carbon generation
 New net capacity
 Plant technology ages
2. Challenges
 Implications of policy scenarios on demand and fuel mix
 Impact of EU ETS reforms on carbon price
 Integrating variable renewable energy and distributed solar PV
 Managing disruption of the sector
© OECD/IEA 2015
1. Trends
0
500
1,000
1,500
2,000
2,500
3,000
3,500
4,000
4,500
5,000
1975
1981
1987
1993
1999
2005
2011
TWh
Power Demand in OECD Regions
(1975-2013)
OECD
Americas
OECD Asia
Oceania
OECD Europe
Source: OECD data
0
100
200
300
400
500
600
1975
1980
1985
1990
1995
2000
2005
2010
TWh
Power Demand in EU Markets
(1975-2013)
Germany
France
United
Kingdom
Italy
Spain
Power demand in OECD markets is stagnating or declining
© OECD/IEA 2015
1. Trends (cont.)
-2%
-1%
0%
1%
2%
3%
4%
5%
6%
7%
EU28 Germany France United
Kingdom
Italy Spain Others
CAGR
5-year CAGR of EU28 Markets
1995-00
2000-05
2005-10
2010-13
Source: Eurostat data
Power demand growth has been declining since the 1990s
© OECD/IEA 2015
1. Trends (cont.)
60
80
100
120
140
160
180
1995 1997 1999 2001 2003 2005 2007 2009 2011 2013
EU28 GDP versus EU28 Power Demand
(1995-2013) (1995 = 100)
EU28 Power Demand EU28 GDP EU28 Power Intensity
Source: Eurostat data
Power intensity of GDP has decreased over 30% since 1995
© OECD/IEA 2015
1. Trends (cont.)
0
500
1,000
1,500
2,000
2,500
3,000
3,500
4,000
1990 1995 2000 2005 2010
TWh
EU28 Gross Generation Mix
(1990-2013)
Other
Oil
Solar
Wind
Biofuels and Waste
Hydro
Nuclear
Natural Gas
Lignite
Coal
Source: Eurostat data
0
500
1,000
1,500
2,000
2,500
3,000
3,500
1990 1995 2000 2005 2010
TWh
EU28 Gross Generation Mix
(1990-2013)
Renewable
Fossil and Nuclear
26%
12%
74%
88%
Fossil-fuels and nuclear are being squeezed by renewables
© OECD/IEA 2015
1. Trends (cont.)
1,375
1,205
954
89 82 46 30 4 3 0.1
-118
-326 -396-0,600
-0,400
-0,200
0,000
0,200
0,400
0,600
0,800
1,000
1,200
1,400
1,600
GW
EU28 Net Installations in EU28 (2000-2015)
Source: European Wind Association (2016)
Most new capacity is non-hydro renewables
© OECD/IEA 2015
1. Trends (cont.)
Source: World Electric Power Plants Database, April 2015
68% of coal capacity and 60% of nuclear capacity is >30 years old
0
20,000
40,000
60,000
80,000
100,000
120,000
140,000
160,000
180,000
200,000
< 10 years 10-20 years 20-30 years 30-40 years 40-50 years < 50 years Unknown
MW
Age Distribution of EU28 Plants
Others
Oil
Nuclear
Hydro
Gas
Coal
© OECD/IEA 2015
2. Challenges (cont.)
0
500
1,000
1,500
2,000
2,500
3,000
3,500
4,000
4,500
2012 2020 2030 2040 2050
TWh
EU28 Power Generation – 6D Scenario
Other
Renewables
Nuclear
Gas
Coal with CCS
Coal
44% of mix by 2050
0
500
1,000
1,500
2,000
2,500
3,000
3,500
4,000
4,500
2012 2020 2030 2040 2050
TWh
EU28 Power Generation – 2D Scenario
Other
Renewables
Nuclear
Gas with CCS
Gas
Coal with CCS
Coal
Source: Energy Technology Perspectives 2015
68% of mix by 2050
3,927 TWh by 2050
3,686 TWh by 2050
Structural shift in the fuel mix is required for 2-degree outcome
© OECD/IEA 2015
2. Challenges (cont.)
0
5
10
15
20
25
30
35
2006
2007
2008
2009
2010
2011
2012
2013
2014
2015
€/tones
Front-year EUA price
(2006-2015)
Phase 1.
2005-07
Phase 2.
2008-12
Phase 3.
2013-20
Source: ICE data, European Commission data
68% of mix by 2050
To date the EU ETS has produced a volatile and low carbon price
0
5
10
15
20
25
0
500
1,000
1,500
2,000
2,500
2008 2009 2010 2011 2012 2013
€/tonnes
Milliontones
ETS Balance vs. Average EUA Price
Cumulative Balance (LA) Average EUA price (RA)
© OECD/IEA 2015
2. Challenges (cont.)
Source: Carbon Tracker (2015), Point Carbon (2015), World Energy Outlook (2014) *450, NPS & CPS based on interpolations and USD/EUR of 0.75
Will EU ETS reform bring reduced volatility and higher prices?
0
10
20
30
40
50
60
70
80
2010 2015 2020 2025 2030
€/tonnes
EUA Price Forecasts and Scenarios
Historical Carbon Tracker Point Carbon IEA (450) IEA (NPS)
© OECD/IEA 2015
2. Challenges (cont.)
Without policy reform renewables penetration will crimp investment
Wind Solar Wind Solar
Gas Turbine (OCGT) -54% -40% -87% -51%
Gas Turbine (CCGT) -34% -26% -71% -43%
Coal -27% -28% -62% -44%
Nuclear -4% -5% -20% -23%
Gas Turbine (OCGT) -54% -40% -87% -51%
Gas Turbine (CCGT) -42% -31% -79% -46%
Coal -35% -30% -69% -46%
Nuclear -24% -23% -55% -39%
-14% -13% -33% -23%
Loadlosses
Profitability
losses
Electricity price variation
10% Penetration level 30% Penetration level
Source: NEA (2012), Nuclear Energy and Renewables: System Effects in Low-Carbon Electricity Systems, OECD, Paris
© OECD/IEA 2015
2. Challenges (cont.)
Source: Carbon Tracker (2015)
“grid parity” turns customers into “prosumers”
0
0.05
0.1
0.15
0.2
0.25
0.3
0.35
2008 2009 2010 2011 2012 2013 2014
€/KWh
Levelised cost of electricity of German household solar PV vs. Retail Power Price
German Household Solar PV LCOE German Retail Power Price
© OECD/IEA 2015
2. Challenges (cont.)
Source: Nykvist and Nilsson (2015)
Commercialization of battery storage – not if, but when
© OECD/IEA 2015
Thank you for your attention
Matt Gray
Energy Analyst
(33-1) 40 57 66 37
matthew.gray@iea.org

Decarbonising EU Power: Trends and Challenges

  • 1.
    © OECD/IEA 2015 ArgusEmissions Markets 2016 Decarbonising EU Power Trends and Challenges 3rd March 2016 Matt Gray Consultant Analyst International Energy Agency matthew.gray@iea.org
  • 2.
    © OECD/IEA 2015 Overview 1.Trends  Changes to power demand  Fossil-fuel versus low-carbon generation  New net capacity  Plant technology ages 2. Challenges  Implications of policy scenarios on demand and fuel mix  Impact of EU ETS reforms on carbon price  Integrating variable renewable energy and distributed solar PV  Managing disruption of the sector
  • 3.
    © OECD/IEA 2015 1.Trends 0 500 1,000 1,500 2,000 2,500 3,000 3,500 4,000 4,500 5,000 1975 1981 1987 1993 1999 2005 2011 TWh Power Demand in OECD Regions (1975-2013) OECD Americas OECD Asia Oceania OECD Europe Source: OECD data 0 100 200 300 400 500 600 1975 1980 1985 1990 1995 2000 2005 2010 TWh Power Demand in EU Markets (1975-2013) Germany France United Kingdom Italy Spain Power demand in OECD markets is stagnating or declining
  • 4.
    © OECD/IEA 2015 1.Trends (cont.) -2% -1% 0% 1% 2% 3% 4% 5% 6% 7% EU28 Germany France United Kingdom Italy Spain Others CAGR 5-year CAGR of EU28 Markets 1995-00 2000-05 2005-10 2010-13 Source: Eurostat data Power demand growth has been declining since the 1990s
  • 5.
    © OECD/IEA 2015 1.Trends (cont.) 60 80 100 120 140 160 180 1995 1997 1999 2001 2003 2005 2007 2009 2011 2013 EU28 GDP versus EU28 Power Demand (1995-2013) (1995 = 100) EU28 Power Demand EU28 GDP EU28 Power Intensity Source: Eurostat data Power intensity of GDP has decreased over 30% since 1995
  • 6.
    © OECD/IEA 2015 1.Trends (cont.) 0 500 1,000 1,500 2,000 2,500 3,000 3,500 4,000 1990 1995 2000 2005 2010 TWh EU28 Gross Generation Mix (1990-2013) Other Oil Solar Wind Biofuels and Waste Hydro Nuclear Natural Gas Lignite Coal Source: Eurostat data 0 500 1,000 1,500 2,000 2,500 3,000 3,500 1990 1995 2000 2005 2010 TWh EU28 Gross Generation Mix (1990-2013) Renewable Fossil and Nuclear 26% 12% 74% 88% Fossil-fuels and nuclear are being squeezed by renewables
  • 7.
    © OECD/IEA 2015 1.Trends (cont.) 1,375 1,205 954 89 82 46 30 4 3 0.1 -118 -326 -396-0,600 -0,400 -0,200 0,000 0,200 0,400 0,600 0,800 1,000 1,200 1,400 1,600 GW EU28 Net Installations in EU28 (2000-2015) Source: European Wind Association (2016) Most new capacity is non-hydro renewables
  • 8.
    © OECD/IEA 2015 1.Trends (cont.) Source: World Electric Power Plants Database, April 2015 68% of coal capacity and 60% of nuclear capacity is >30 years old 0 20,000 40,000 60,000 80,000 100,000 120,000 140,000 160,000 180,000 200,000 < 10 years 10-20 years 20-30 years 30-40 years 40-50 years < 50 years Unknown MW Age Distribution of EU28 Plants Others Oil Nuclear Hydro Gas Coal
  • 9.
    © OECD/IEA 2015 2.Challenges (cont.) 0 500 1,000 1,500 2,000 2,500 3,000 3,500 4,000 4,500 2012 2020 2030 2040 2050 TWh EU28 Power Generation – 6D Scenario Other Renewables Nuclear Gas Coal with CCS Coal 44% of mix by 2050 0 500 1,000 1,500 2,000 2,500 3,000 3,500 4,000 4,500 2012 2020 2030 2040 2050 TWh EU28 Power Generation – 2D Scenario Other Renewables Nuclear Gas with CCS Gas Coal with CCS Coal Source: Energy Technology Perspectives 2015 68% of mix by 2050 3,927 TWh by 2050 3,686 TWh by 2050 Structural shift in the fuel mix is required for 2-degree outcome
  • 10.
    © OECD/IEA 2015 2.Challenges (cont.) 0 5 10 15 20 25 30 35 2006 2007 2008 2009 2010 2011 2012 2013 2014 2015 €/tones Front-year EUA price (2006-2015) Phase 1. 2005-07 Phase 2. 2008-12 Phase 3. 2013-20 Source: ICE data, European Commission data 68% of mix by 2050 To date the EU ETS has produced a volatile and low carbon price 0 5 10 15 20 25 0 500 1,000 1,500 2,000 2,500 2008 2009 2010 2011 2012 2013 €/tonnes Milliontones ETS Balance vs. Average EUA Price Cumulative Balance (LA) Average EUA price (RA)
  • 11.
    © OECD/IEA 2015 2.Challenges (cont.) Source: Carbon Tracker (2015), Point Carbon (2015), World Energy Outlook (2014) *450, NPS & CPS based on interpolations and USD/EUR of 0.75 Will EU ETS reform bring reduced volatility and higher prices? 0 10 20 30 40 50 60 70 80 2010 2015 2020 2025 2030 €/tonnes EUA Price Forecasts and Scenarios Historical Carbon Tracker Point Carbon IEA (450) IEA (NPS)
  • 12.
    © OECD/IEA 2015 2.Challenges (cont.) Without policy reform renewables penetration will crimp investment Wind Solar Wind Solar Gas Turbine (OCGT) -54% -40% -87% -51% Gas Turbine (CCGT) -34% -26% -71% -43% Coal -27% -28% -62% -44% Nuclear -4% -5% -20% -23% Gas Turbine (OCGT) -54% -40% -87% -51% Gas Turbine (CCGT) -42% -31% -79% -46% Coal -35% -30% -69% -46% Nuclear -24% -23% -55% -39% -14% -13% -33% -23% Loadlosses Profitability losses Electricity price variation 10% Penetration level 30% Penetration level Source: NEA (2012), Nuclear Energy and Renewables: System Effects in Low-Carbon Electricity Systems, OECD, Paris
  • 13.
    © OECD/IEA 2015 2.Challenges (cont.) Source: Carbon Tracker (2015) “grid parity” turns customers into “prosumers” 0 0.05 0.1 0.15 0.2 0.25 0.3 0.35 2008 2009 2010 2011 2012 2013 2014 €/KWh Levelised cost of electricity of German household solar PV vs. Retail Power Price German Household Solar PV LCOE German Retail Power Price
  • 14.
    © OECD/IEA 2015 2.Challenges (cont.) Source: Nykvist and Nilsson (2015) Commercialization of battery storage – not if, but when
  • 15.
    © OECD/IEA 2015 Thankyou for your attention Matt Gray Energy Analyst (33-1) 40 57 66 37 matthew.gray@iea.org