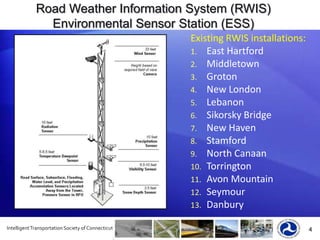
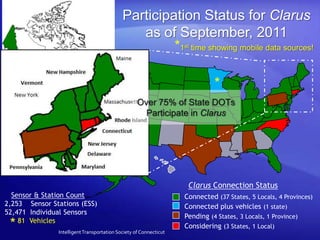
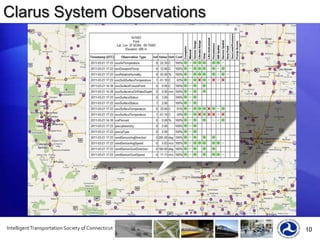
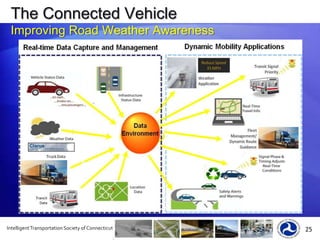
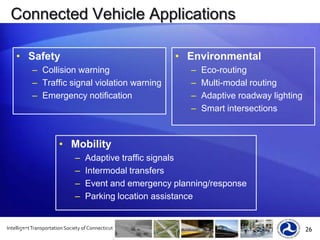
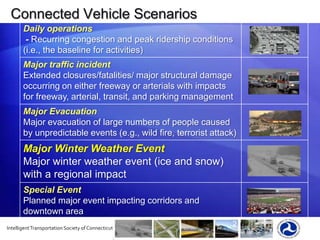
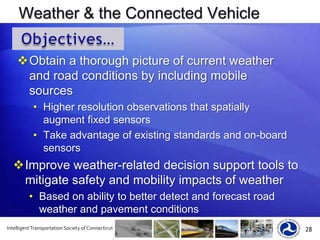
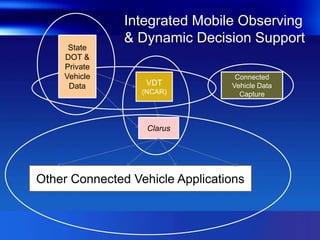
Intelligent Transportation Society of Connecticut   14th Annual Meeting 	September 28, 2011
 Intelligent Transportation Society of Connecticut   14th Annual Meeting 	September 28, 2011Ray MurphyFHWA  +10 yrs  - program support:
Road Weather Management
Emergency Transportation Operations
Real – Time Data Management
+ 20 yrs Illinois Dept. of Transportation:
Operations, Maintenance, & Construction
ITS Project Manager
CEC Officer/Seabees & Engineer MentorWeather Technologies…Clarus and the Connected VehicleRay MurphyFederal Highway AdministrationSeptember 28, 2011	 Intelligent Transportation Society of Connecticut
Road Weather Information System (RWIS)Environmental Sensor Station (ESS)Existing RWIS installations:East HartfordMiddletownGrotonNew LondonLebanonSikorsky BridgeNew HavenStamfordNorth CanaanTorringtonAvon MountainSeymourDanbury
5
Environmental Sensor Stations2,253 Sensor Stations (ESS)    52,471 Individual Sensors6
The Clarus InitiativeClarus is an R&D initiative to demonstrate and evaluate the value of “Anytime, Anywhere Road Weather Information” that is provided by both public agencies and the private weather enterprise to transportation users and operators.
To do so, FHWA  created a robust
data assimilation,
quality checking, and
data dissemination system 	that can provide near real-time atmospheric and pavement observations from the collective states’ investments in environmental sensor stations (ESS).www.clarusinitiative.org
The Clarus System2011 National ITS Updatewww.clarus-system.comFHWA Road Weather Management Program, in conjunction with the US DOT ITS Joint Program Office established Clarus in 2004 to reduce the impact of adverse weather conditions on surface transportation users. Clarus is the 21st Century’s answer to the need for timely, high-quality road weather information.A database management system for all surface transportation weather observations in North America
One database removes borders
Provides advanced quality checking for both atmospheric & pavement data
Includes extensive metadata
Easy access via web portal & subscriptionParticipation Status for Clarusas of September, 2011*1st time showing mobile data sources!*CanadianParticipationOver 75% of State DOTs Participate in ClarusLocal ParticipationCity of Indianapolis, INMcHenry County, ILCity of Oklahoma City, OKKansas Turnpike Authority Parks CanadaClarus Connection StatusSensor & Station Count2,253    Sensor Stations (ESS)52,471  Individual Sensors      81  VehiclesConnected (37 States, 5 Locals, 4 Provinces)Connected plus vehicles (1 state)Pending (4 States, 3 Locals, 1 Province)Considering (3 States, 1 Local)*Intelligent Transportation Society of Connecticut
Clarus System Observations
Clarus Users in 20104993 unique addresses gaining access    (3,524,702 hits) from 67 countries
government agencies (federal, state, local)
academic institutions
weather providers
TV stations
private sector firms
unknown sources (Internet providers, etc.)
Clarus Users in 2009 - 314 unique addresses gaining access (59,000+ hits) from 19 countriesClarus SurveyConducted by ITSA from 15 June - 15 July 2011Intent was to increase understanding of how Clarus is used by system customers28 Participants: 13 State DOTs6 private sector companies4 academic institutions3 Federal agencies1 weather service provider 1 transit agency
ClarusAccess MethodsMap: 48%On-demand request: 26%Subscription:  22%Other:  4%
New Data PreferencesMobile Data: 81%Air Quality: 50%ASOS/AWOS: 46%Other: 20%Response Frequency14
Clarus System Survey - SummaryClear primary indicators: State DOTs are primary users
 Main use of data is monitoring current weather
 Map is the main access method
 Mobile data most desired of new sourcesClarus Regional DemonstrationsObjectivesEnsure the Clarus System works as designed
Demonstrate the ability of the Clarus System to process and provide data from large numbers of Environmental Sensor Stations (ESS)
Promote/educate on metadata collection
Foster proactive transportation system management in response to the weather
Encourage improved private sector services for road weather information enabled with data from the Clarus System
New software GOTS/open sourceClarus Regional Demonstration5 Use Case ScenariosEnhanced Road Weather Forecasting Enabled by ClarusSeasonal Load Restriction ToolNon-winter Maintenance Decision Support SystemMulti-state Control Strategy ToolEnhanced Road Weather Content for Traveler AdvisoriesState Transportation Agency PartnersMeridian Team includes ID, MT, WY, ND, SD & MNScenarios 1, 2, 5Mixon Hill Team includes      IA, IL & INScenarios 1, 3, 4

Weather & the connected vehicle 092811

  • 1.
    Intelligent TransportationSociety of Connecticut 14th Annual Meeting September 28, 2011
  • 2.
    Intelligent TransportationSociety of Connecticut 14th Annual Meeting September 28, 2011Ray MurphyFHWA +10 yrs - program support:
  • 3.
  • 4.
  • 5.
    Real – TimeData Management
  • 6.
    + 20 yrsIllinois Dept. of Transportation:
  • 7.
  • 8.
  • 9.
    CEC Officer/Seabees &Engineer MentorWeather Technologies…Clarus and the Connected VehicleRay MurphyFederal Highway AdministrationSeptember 28, 2011 Intelligent Transportation Society of Connecticut
  • 10.
    Road Weather InformationSystem (RWIS)Environmental Sensor Station (ESS)Existing RWIS installations:East HartfordMiddletownGrotonNew LondonLebanonSikorsky BridgeNew HavenStamfordNorth CanaanTorringtonAvon MountainSeymourDanbury
  • 11.
  • 12.
    Environmental Sensor Stations2,253Sensor Stations (ESS) 52,471 Individual Sensors6
  • 13.
    The Clarus InitiativeClarusis an R&D initiative to demonstrate and evaluate the value of “Anytime, Anywhere Road Weather Information” that is provided by both public agencies and the private weather enterprise to transportation users and operators.
  • 14.
    To do so,FHWA created a robust
  • 15.
  • 16.
  • 17.
    data dissemination system that can provide near real-time atmospheric and pavement observations from the collective states’ investments in environmental sensor stations (ESS).www.clarusinitiative.org
  • 18.
    The Clarus System2011National ITS Updatewww.clarus-system.comFHWA Road Weather Management Program, in conjunction with the US DOT ITS Joint Program Office established Clarus in 2004 to reduce the impact of adverse weather conditions on surface transportation users. Clarus is the 21st Century’s answer to the need for timely, high-quality road weather information.A database management system for all surface transportation weather observations in North America
  • 19.
  • 20.
    Provides advanced qualitychecking for both atmospheric & pavement data
  • 21.
  • 22.
    Easy access viaweb portal & subscriptionParticipation Status for Clarusas of September, 2011*1st time showing mobile data sources!*CanadianParticipationOver 75% of State DOTs Participate in ClarusLocal ParticipationCity of Indianapolis, INMcHenry County, ILCity of Oklahoma City, OKKansas Turnpike Authority Parks CanadaClarus Connection StatusSensor & Station Count2,253 Sensor Stations (ESS)52,471 Individual Sensors 81 VehiclesConnected (37 States, 5 Locals, 4 Provinces)Connected plus vehicles (1 state)Pending (4 States, 3 Locals, 1 Province)Considering (3 States, 1 Local)*Intelligent Transportation Society of Connecticut
  • 23.
  • 24.
    Clarus Users in20104993 unique addresses gaining access (3,524,702 hits) from 67 countries
  • 25.
  • 26.
  • 27.
  • 28.
  • 29.
  • 30.
  • 31.
    Clarus Users in2009 - 314 unique addresses gaining access (59,000+ hits) from 19 countriesClarus SurveyConducted by ITSA from 15 June - 15 July 2011Intent was to increase understanding of how Clarus is used by system customers28 Participants: 13 State DOTs6 private sector companies4 academic institutions3 Federal agencies1 weather service provider 1 transit agency
  • 32.
    ClarusAccess MethodsMap: 48%On-demandrequest: 26%Subscription: 22%Other: 4%
  • 33.
    New Data PreferencesMobileData: 81%Air Quality: 50%ASOS/AWOS: 46%Other: 20%Response Frequency14
  • 34.
    Clarus System Survey- SummaryClear primary indicators: State DOTs are primary users
  • 35.
    Main useof data is monitoring current weather
  • 36.
    Map isthe main access method
  • 37.
    Mobile datamost desired of new sourcesClarus Regional DemonstrationsObjectivesEnsure the Clarus System works as designed
  • 38.
    Demonstrate the abilityof the Clarus System to process and provide data from large numbers of Environmental Sensor Stations (ESS)
  • 39.
  • 40.
    Foster proactive transportationsystem management in response to the weather
  • 41.
    Encourage improved privatesector services for road weather information enabled with data from the Clarus System
  • 42.
    New software GOTS/opensourceClarus Regional Demonstration5 Use Case ScenariosEnhanced Road Weather Forecasting Enabled by ClarusSeasonal Load Restriction ToolNon-winter Maintenance Decision Support SystemMulti-state Control Strategy ToolEnhanced Road Weather Content for Traveler AdvisoriesState Transportation Agency PartnersMeridian Team includes ID, MT, WY, ND, SD & MNScenarios 1, 2, 5Mixon Hill Team includes IA, IL & INScenarios 1, 3, 4

Editor's Notes

  • #4 The Federal Highway Administration’s (FHWA) Road Weather Management Program (RWMP) continues to support Intelligent Transportation Systems (ITS) applications that focus on roadway safety and mobility and at the same time promote technology deployments that help balance society’s need to protect the environment and maintain stable economic conditions. The program collaborates with NOAA, departments of transportation in each state, an important and vigorous private sector, the academic community, and professional societies such as the American Meteorological Society and other nongovernmental organizations, including the American Association of State Highways and Transportation Officials. This presentation will provide an overview of the Clarus system, including a review of recent enhancements, and an update on mobile observing of weather and road conditions – including the Connected Vehicle Technology Challenge and the VDT (Vehicle Data Translator).
  • #13 - Customers: who uses the data, how they use it, how they get it, how often they use it, etc- 28 sample size is not very big; doesn’t meet statisticalminimum of 30 especially for such a diverse community
  • #14 Respondents were asked what is their primary means of accessing the data. 48% of respondents use the map service.
  • #15 - Labeled new data “preferences” because survey question did not ask for “needs” per se,but “what data sources would be useful to their organizations”.- Note each response is independent from each other so %’s do not equal 100%.- Mobile data high rating because potential of mobile data getting a lot of “marketing” lately with smart phones, CV program, etc.
  • #16 - Org impact may be the result of some DOTs just deciding to be wx-wise or not.“Clear primary” means the majority or top results had significant margins from results at next level i.e. large difference in % from #1 and #2.
  • #17 Focus of this brief is last two bullets. ITS/JPO Open source guidelines are in draft and should be out mid-August.3 phases – utilize the Clarus system and evaluate2nd bullet Mission tag – ease of integration3rd – main emphasis – FHWA is seeding application development – build a software tool… further Phase 1: Request for Applications (RFA)Team approach/public transportation agenciesCreation of ConOps tailored to agencies’ needsRequires providing ESS data into the Clarus SystemPhase 2: Connection Incentive Program (CIP)Expand public agency participation in ClarusOffset some costs for metadata & data accessPhase 3: Development & DeploymentPrivate sector to build & test ConOps scenariosIndependent evaluation of the Clarus System & developed innovationsGovernment owed off the shelf but slide 3 is mostly bolder plate, this language has been around for years because the CRD isn’t going on that long (yeh-Ray) , really I think those 3 bullets talk to the 3 phases somewhat you know there was (Ray “ I have you on speaker so I can tape”) (ok) but I took out some of phase terminology because that’s all project management, but a big part of the Clarus recent demo was to actually utilize the Clarus System and then even evaluate it, so you might have heard or know about the fact that Merridian as well as the subcontractor on Nixon Hill they all did a system eval (evaluation) that’s that 1st bullet, you don’t need to spend a lot of time on it (got you), it’s all system data base focus, the 2nd one is kind of a general statement that’s almost the mission tag for the road weather program, because we are to obviously intergrade weather aspect into various transportation areas the easier make the data the easier you make the software tools available the easier it is to intergrade it rights so that’s what that 2nd bullet is. (ok), but the 3rd bullet is really were the Clarus regional demo I think it’s main emphasis were just like in the assess the government is seeding the application development and with the idea that it’s providing a base line software capability and the relationship with the state, so they get in bed with the state they learn the requirements, they learn the operation of the state and then they build the software tool 1st generation, 1st version and then hopefully the idea is that that seed further development, further integration of weather services so this CRD brief if focus on that 3rd bullet because we are going to talk about use case (ok) and then I just throw in on the bottom line the fact that the contract does spell out that all the software is government owned and then I’ll actually have the westside at the end of (Is that coss or goos – it’s government owned off the shelve; ok I am not familiar with that term) it the same coss right but its government owned software in this case ok, so that actually in contrast to the baa software development which is not government owned so all those little software enhancement that the various folks are doing out there that’s not federal highway owned software ok, but in the case of Clarus it is, so just mention that it goos (it’s government owned) and it will be opened source
  • #19 WRF (Weather Research and Forecasting) Model: a standard model used by NWS, academia and private weather service providers.Both teams ran their own WRF but it’s basically the same modelAssess the impact of Clarus data on weather and pavement predictions utilizing existing weather models to enhance atmospheric and pavement forecasting for surface transportation.- Typical weather model (like the WRF) ingest weather data from well over 10,000 observation sites throughout the atmosphere each hour. Total surface observation site density is about 3,000. NCAR varied the surface obs sites with 160 ESS points and Meridian varied those by ~400 or 2-4% of total model input (observed weather data)Advanced Research WRF (ARW):Meridian used a 3 1/3 kilometer grid spacing; MHI-NCAR 5 km grid spacingAccounts better for fine-scale terrain induced weather variationsImproves resolution of banded precipitationImproves the resolving of clouds and radiationProvides hourly output to support: Forecaster editing & validation with hourly observationsSeveral sets of …so on slide 5 and again you have probably have seen the objective language in these charts is ______ what the test or the studies did was they use various types of models, weather models, the road weather forecast system is basicly the guts of the NDSS if you didn’t know that’s their diecast system which uses a multi set weather model and then the road model is the metro model which again is also part of the NDSS and then Merridian use the precipitation analysis and blowing snow model to take, so what they did is they took worf weather output and shoved it into their sorry about that they use Clarus data to help analyze the precipitation field so they combine Clarus data with radar and satellite imagery to come up with an enhancer precipitation analysis and through that out put into a blowing snow model , so again focusing on the 2nd bullet both the Merridian and Incar basically just ran their models they didn’t develop any models they just took their existing models and said hey let’s see what our performance with Clarus data and without and that what the study was focus on ok, but I thought I would throw in the last bullet on the slide 5 to give you an idea of the scope the size of the Clarus data so people might think ooh you know you’re adding up all this Clarus data to the model s and really you are not you’re only adding to the 4% of the total observed weather data that‘s in the worf for example there is tons of other observation sources right like I was saying radar, satellite other observation site etc. there is a little background on the worf in the note section ( Ray, I am reading through it now) you don’t have to get into all those details that more in case you get some smart people and they ask questions – (Ray-exactly) there is some example – Merridian use the version of worf called vanceresearch it just has couple more bells and whistles and as you can see by the 1st bullet people might have a question about what’s the resolution what’s the spacing of this model and the grid point and I got that info in there so its 3 1/3 columeters for Merridianworf and 5 columeters for Incarworf, so hit the highlights of basically the bottom line is that you have several set of models and road weather related models and there is including Clarus and excluding Clarus data and seeing what the difference is. Chart 6 just depict the domain or the model area Nixion Hill and Incarr is you have to decide if you want to reference Incar or Nixon Hill you understand the relation there right (Ray – they were collaborating working together on use case 1) well Incarr did the vast majority of the work so Nixon Hill was the prime for use cases 1,3,4 like chart 4 says and they don’t have any meteorologist or weather expertise in Nixon Hill so they just sub that out to Incar I use Nixon Hill in the chart language you might end up like me going back and forth so just be aware of that I kind of generalize using Nixon Hill language so I just quickly show the map to give people a kind of zoom in version you might not even need to show chart 6 because the are information is really the same as chart 4 it show the upper Midwest for both area and then the thing that I do bring under the Nixon Hill 1st bullet there is that they use 5 case studies from 08 to 09 on particular weather events and those I have listed there the heavy rain, high winds scrawl lines cold and warm events you know what a scrawl line is? No – scrawl line is a line of thunder storms, a very strong cold front and a lot of thunder storms are brewed from it you said if I had to cut down t you indicated the chart 4
  • #21 Year round maint tool – familiar with MDSS – expanding to year round activities – the most difficult part…Paint analogy….
  • #22 Provide a coordination tool for events that will affect multiple – i.e. chemical spillPretty aggressive tool – pretty lofty – to do a inter-state - table top exercise DOTs (State & Local)Law EnforcementEmergency ManagementMulti-StateMulti-JurisdictionalPrimary objectives: Provide road conditions and strategies which improve coordination between agencies for the imposition of controls and dissemination of advisories Assist agencies in proactively responding to situations & thus mitigate the impact to travelers and 1st respondersTool helps to coordinate among agencies, define the weather threat, establish control actions, and monitors eventsDefinition of weather events similar to use case 3 methodologyMultiple web conferences can be set-up and monitored
  • #23 Forecasted weather info – the predicatedDid not go public wide – due to testingDid not put out predicted treatment…
  • #24 There may be more value in multi-state and forecast information via a web portal - “a picture is worth a thousand words”With current data availability, the system holds promise for alerting travelers to imminent travel problemsThe concepts have been well-received by both the participating DOTs and public evaluatorsThe system would potentially benefit from more detailed agency data (e.g., IT-equipped snowplows)
  • #27 IntelliDrive applications are grouped into the three main categories safety, mobility, and environmental. Example applications for each are shown. Discussion of what IntelliDrive
  • #31 The Clarus Initiative, established in 2004, is a multi-year program to organize and make available more effective environmental and road condition observation capabilities in support of four primary motivations: Provide a North American resource to collect, quality check, and make available surface transportation weather and road condition observations. Surface transportation-based weather observations will enhance and extend the existing weather data sources that will support general purpose weather forecasting. Collection of real-time surface transportation-based weather observations will support real-time operational responses to weather. Combining Clarus data with existing observation data will permit broader support for the enhancement and creation of models to enhance forecasts in the atmospheric boundary layer and near the earth’s surface.
  • #32 Clarus is one of the “ancillary” data source feeding into Stage II of the process; Clarus and other data are used to perform quality checks on the mobile data and possibly support/enhance the mobile data used to make the inferences/roadway hazard assessments in Stage III
  • #41 Use in combination with the Maintenance decision support systemResubmitted to Paul Pisano of FHWA for “weather” portion of Connected Vehicle programMDSS maintenance decision support system
  • #42 Derive data and communicationsrequirements for weather, road condition, and vehicle status variables from mobile platforms (Using State DOT vehicles as the source)Enhance and expand post-processing algorithms to turn the data into useful observations that are tied to existing mesonets (e.g., Clarus)Explore the use of these and other observations in weather-related decision support systems.Clarus will be transitioning over the next few years to the NWS mesonet as part of a “National Next Gen Network”. Schedule is TBDOther observations may include input from other mesonets and networks or State DOT information