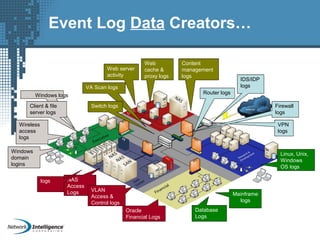
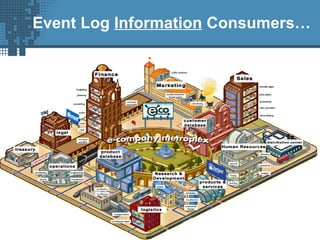
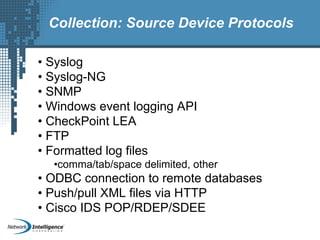
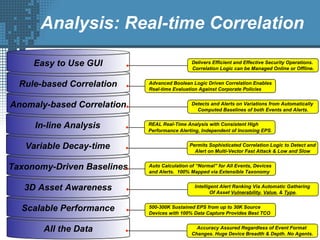
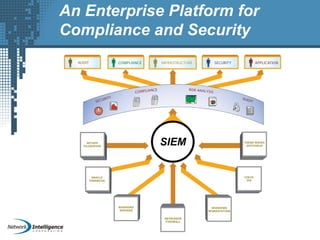
NEbraskaCERT 2005:
Security Information and
Event Management
(SIEM)
Matt Stevens
Chief Technology Officer
Network Intelligence Corporation
8-10-05
Security Information/Events =
Logs
• Logs are audit records generated by any software component
running on your IT infrastructure
• Log records cover:
– Normal activity
– Error conditions
– Configuration changes
– Policy changes
– User access to assets
– Incident alerts
– Unauthorized use of resources
– Non-privileged access to files
– User behavior patterns
– Clearing of sensitive data
– Access to audit trails
• Logs provide feedback on the status of IT resources and all activity
going through them
Example Logs
• Sample Operating System Logs – Windows2K Server
– 2005/05/17 12:59:12.387 EDT192.168.1.52%NICWIN-4-
Security_529_Security: Security,91350077,Tue May 17 12:58:43 2005 ,
529,Security,NT AUTHORITY/SYSTEM,Failure Audit,WA1-MASTER-
FDC,Logon/Logoff ,,Logon Failure: Reason: Unknown user name
or bad password User Name: PIQA Domain: Ntoss Logon Type: 3
Logon Process: NtLmSsp Authentication Package: NTLM Workstation
Name: UpTime-HA
– 2005/05/17 12:59:29.793 EDT192.168.1.24%NICWIN-4-
Security_560_Security: Security,69561800,Tue May 17 12:58:29 2005 ,
560,Security,NTOSS/ashtylla,Failure Audit,WA1-MAS90-DC,Object
Access ,,Object Open: Object Server: SC Manager Object Type:
SC_MANAGER OBJECT Object Name: ServicesActive New Handle
ID: - Operation ID: {0,261811266} Process ID: 784 Primary User
Name: C:WINNTsystem32services.exe Primary Domain: WA1-
MAS90-DC$ Primary Logon ID: NTOSS Client User Name:
(0x0,0x3E7) Client Domain: ashtylla Client Logon ID: NTOSS
Accesses (0x0,0xF8EAAF4) Privileges READ_CONTROL Connect to
service controller Enumerate services Query service database lock state
Traditional Interest in Event Logs
• Point security solutions provide log messages
about critical network events
• Main focus on firewalls and IDS/IPS devices
• Correlation of events from multiple security
points reduces false positives
Insider Threat Study
Paper: Insider Threat Study: Computer System Sabotage in Critical
Infrastructure Sectors
Published by: U.S Secret Service and CERT Coordination Center/SEI
Date: May 2005
From Section3 – Detecting the attack:
In general, 75% of the insiders were identified through manual procedures only, and 19%
were identified using a combination of automated and manual procedures. The
various mechanisms used to identify the perpetrators included
• system logs (70%)
• insider’s own source IP address (33%)
• phone records (28%)
• username (24%)
• auditing procedures (13%)
In those cases in which system logs were used to identify the insider as the perpetrator,
the following logs were used
• remote access logs (73%)
• file access logs (37%)
• system file change logs (37%)
• database/application logs (30%)
• email logs (13%)
But That Is Just The Beginning…
Event log data is the single most
underutilized source of information within
the organization.
Capacity Planning
• Compute Resources
• Network Bandwidth
– LAN & WAN
• Disk space consumption
– Servers
– Clients
Performance & Uptime
• Where events happen
• When they occur
• Who is affected
• What sub-systems are involved
• Identify common elements
Legal & Human Resources
• Accurate, detailed audit trail
• Enforce acceptable use policies
– A report sitting on your chair Monday AM is a
powerful deterrent to further abuse…
• Provides supporting evidence
• Can link human assets to IT assets
Incident Investigation & Forensics
• A strong historical record is your best
friend
• What seems benign today can turn out to
be harmful tomorrow…
• Logs can quickly narrow down the search
• Similar incidents become easier to resolve
Help Limit Corporate Liability
• Determined abuse is hard to stop
• An effective policy that is actively
monitored proves corporate responsibility
• It’s hard to intimidate an event log…
Detect & Prevent I.P. Theft
• Makes spotting unusual patterns easier
• Proper resource access can be monitored
• An effective logging policy can serve as a
strong deterrent to casual I.P. theft
• Supports efficient prosecution
Audit & Enforce Employee Productivity
• I.T. resources are expensive and budgets
are tight
• Maintaining peak competitive stature is
key to corporate entity survival
• 1% increase in information worker
productivity can net nearly a 5% increase
in corporate profits*
*Source: 2003 McKinsey report on global competition
Troubleshoot System and Network
Problems
• The original reason for logging
– Over 30% of the code in 1969 version of UNIX
was dedicated to logging support*
• Can be extended to support internal
application development
• Logs tell the story that other debugging
techniques miss…
*Source: Ken Thompson and Dennis Ritchie, Bell Labs
Support Compliance Regulations
• Applies to both Gov’t and industry regs
• All regulations are based upon similar
principles:
– Establish controls
– Monitor the controls
– Report on the trends and monitoring efforts
• We all know today’s list of regulations
– An effective event log platform prepares you
for tomorrow…
Audit & Enforce IT Security Policy
• Apply risk metrics to IT processes
• Finding breakdowns in IT security policy
faster reduces IT risk
• Only effective way to validate point source
security technologies
Event Log Data Creators…
Router logs
IDS/IDP
logs
VPN
logs
Firewall
logs
Windows logs
Client & file
server logs
Wireless
access
logs
Windows
domain
logins
Oracle
Financial Logs
NAS
Access
Logs VLAN
Access &
Control logs
DHCP
logs
Linux, Unix,
Windows
OS logs
Mainframe
logs
Database
Logs
Web server
activity
Content
management
logs
Web
cache &
proxy logs
VA Scan logs
Switch logs
Marketing
Human
Resources
Sales
Finance
Engineering
Operations
Legal
Customer
Service
Event Log Information Consumers…
Marketing
Human
Resources
Sales
Finance
Engineering
Operations
Legal
Customer
Service
XXXXXXXX
XXXXXXXXXXXXXXXXXXXX
XXXXXXXXXX
XXXXXXXXXXXXXXXX
XXXXXXXX
XXXXXXXXXX
XXXXXX
XXXXXXXX
Capacity
Planning
Perform.
& Uptime
Legal/HR
Action
Incidents
Forensics
Corp.
Liability
I.P.
Theft
Employee
Prod.
Trouble-
Shooting
I.T.
Security
Regulatory
Compliance
Event Log Information
Mapping Consumers to Use Cases
Many Consumers & Use Cases …
Silos of Redundant Information Management
How to Avoid Silos?
Deploy an Enterprise-class SIEM Solution
• Collect “All the Data”….
–Broad device support: network, security, infrastructure, & applications
–Agent-less, multi-protocol, non-normalized (no filtering) data capture
–100% raw data capture
–Deep source device coverage. Not a subset of events, all of the known events
• …into a Scalable Enterprise Platform…
–Modular growth to expand with business initiatives
–Price/performance for enterprise-class deployments
–Efficient storage and personnel utilization
• …that Provides Powerful Analysis for Compliance Violations and Security
Threats
– Multiple views into the data
– Targeted reports for security, SOX, HIPAA, etc
– Correlation results between device types
– Baseline of workflows
– Detailed forensic analysis
– Guaranteed, real-time alert performance under load
Security Information and Event
Management (SIEM)
Data Analysis
Data Management
Data Collection1
3
2
Collection: Of Strategic Importance
It All Starts Here…
• Goal: Capture 100% of the Data
– But still be able to make use of it
• Requirements:
– Scalable system
• Must be able to meet the accumulating collection rates
– Wide device support
• Analysis capabilities for many device types
– No filtering or normalization of data
• All data is important - normal activity included.
– Robust data management tools
• Raw data collection
• High data compression rates
• Encryption of stored data
• Authentication of stored data
– Agents vs. Agent-less
Collection: Implementing the Strategy
• Roll the device collection by types of devices or
by departments
• Focus on the most critical assets first
• Turn on auditing features on your critical assets
• Leverage SIEM to transform the data into
information that in turns drives knowledge
Collection: Source Device Protocols
• Syslog
• Syslog-NG
• SNMP
• Windows event logging API
• CheckPoint LEA
• FTP
• Formatted log files
•comma/tab/space delimited, other
• ODBC connection to remote databases
• Push/pull XML files via HTTP
• Cisco IDS POP/RDEP/SDEE
Collection: Open Device Support
• Architecture should be open and permit in-field addition and
updates of source device(s).
• Uses existing source device collection protocols
• Should not require changes to core product
• Treat devices as “added content” that can be distributed
without interruption to production systems
• Automatically identify “unknown” events, yet still permit
intelligent analysis later if required
All the Data
Scalable Performance
3D Asset Awareness
Taxonomy-Driven Baselines
Variable Decay-time
In-line Analysis
Analysis: Real-time Correlation
Anomaly-based Correlation
Rule-based Correlation
Easy to Use GUI
Accuracy Assured Regardless of Event Format
Changes. Huge Device Breadth & Depth. No Agents.
500-300K Sustained EPS from up to 30K Source
Devices with 100% Data Capture Provides Best TCO
Auto Calculation of “Normal” for All Events, Devices
and Alerts. 100% Mapped via Extensible Taxonomy
Advanced Boolean Logic Driven Correlation Enables
Real-time Evaluation Against Corporate Policies
REAL Real-Time Analysis with Consistent High
Performance Alerting, Independent of Incoming EPS.
Intelligent Alert Ranking Via Automatic Gathering
Of Asset Vulnerability, Value, & Type.
Detects and Alerts on Variations from Automatically
Computed Baselines of both Events and Alerts.
Permits Sophisticated Correlation Logic to Detect and
Alert on Multi-Vector Fast Attack & Low and Slow
Delivers Efficient and Effective Security Operations.
Correlation Logic can be Managed Online or Offline.
Analysis: Vulnerability Data
• VA tools provides a known list of hosts and
detected vulnerabilities.
• Analysis can leverage this data to score
threats based on asset vulnerabilities
• All rules evaluate vulnerability data of all the
target assets. Higher vulnerability values of
attacked assets escalate the severity level
• Customized rules should be able to evaluate
individual assets or asset groups and alert
when their vulnerabilities exceed a certain
level
Analysis: Threat Scoring
• Alerts are grouped into alert categories
• All alert categories have (5) alert severity levels
that default to US Homeland Security levels
• Internal scoring algorithm automatically
computes alert severity levels based upon event
contents, rates, baselines and asset values
• Incorporates asset attributes, including frequency
of asset in event payload, importance and
vulnerability
• Automatic ranking of all alerts contained in a
view to focus security administrators on most
critical incidents first
Analysis: Event Classification
• All events should be classified using a global
taxonomy structure – thus providing a standard
to the myriad of non-standard log events from all
source device vendors
• Leveraging taxonomy to evaluate events by
category, regardless of source device permits
correlation to stay current and relevant far easier
• Event classification should be fully exposed to
the user. Users should be able to create new
categories and assign new messages to any
level in the taxonomy tree
Analysis: Baseline Data
• Baselines should be created automatically –
“learned” from the actual network activity
• Minute, hour, day and week baselines permit
tracking of spikes as well as “low and slow”
patterns
• Baselines are aware of normal activity pattern
changes over the course of the day, week
and month.
• Correlation engines can use baseline data to
detect anomalies based on activity percent
change from normal behavior
Analysis: Baselines
Scoreover time
48
52
50
55
60
58
57
61
54
57
54
59
40
50
60
70
80
90
100
1 2 3 4 5 6 7 8 9 10 11 12
Time (inMinutes)
ScoreValue
-10
0
10
20
30
40
50
60
70
80
90
%Difference
CurrentScore ScoreBaseline %Difference
Score over time
55
62
48
53
57
64
68
78
98
67
58
65
48
52
50
55
60
58
57
61
54
57
54
59
40
50
60
70
80
90
100
1 2 3 4 5 6 7 8 9 10 11 12
Time (in Minutes)
ScoreValue
-10
0
10
20
30
40
50
60
70
80
90
Current Score Score Baseline % Difference
Analysis: Baselines
Severity Levels CalculationSeverity Levels Calculation
Score over time
55
62
48
53
57
64
68
78
98
67
58
65
48
52
50
55
60
58
57
61
54
57
54
59
0
28%
19%
-5%
3%
16%14%
2%
81%
18%
7%
10%
40
50
60
70
80
90
100
1 2 3 4 5 6 7 8 9 10 11 12
Time (in Minutes)
ScoreValue
-10
0
10
20
30
40
50
60
70
80
90
%Difference
Current Score Score Baseline % Difference
Analysis: Baselines
Severity Levels CalculationSeverity Levels Calculation
Score over time
65
58
67
98
78
68
64
57
53
48
62
55
59
54
57
54
61
57
58
60
55
50
52
48
10%
7%
18%
81%
2%
14% 16%
3%
-5%
19%
28%
0
40
50
60
70
80
90
100
1 2 3 4 5 6 7 8 9 10 11 12
Time (in Minutes)
ScoreValue
-10
0
10
20
30
40
50
60
70
80
90
%Difference
Current Score Score Baseline % Difference
< or = 10% Score Baseline = Low
>10% higher than Score Baseline = Guarded
>25% higher than Score Baseline = Elevated
>50% higher than Score Baseline = High
>75% higher than Score Baseline = Severe
Analysis: Baselines
Analysis: Correlation Example –
Worm Detection
Correlation Rule Name: W32.Blaster Worm
The goal of this rule is to detect Blaster worm variants as well as other
malicious code by analyzing network traffic patterns.
13
Analysis: Correlation Example –
Website Attack
Correlation Rule Name: SQL Injection Attack
The goal of this rule is to detect information theft from E-Commerce websites
through the exploitation of the trusted connection between the web server and the
database.
14
27
Analysis: Real-time Threat Analysis
28
Analysis: Real-time Threat Analysis
Analysis: Reporting
User Activity from External Domains
Analysis: Reporting
Operational Change Control
Analysis: Reporting
Password Changes and Expirations
31
Analysis: Reporting
Top 20 Denied Inbound
32
Analysis: Reporting
Top 20 Firewall Categories (Taxonomy)
30
Analysis: Reporting
Scheduled Reports
29
Analysis: Real-time Event Viewer
Data Mining in Real-time or Historically
An Enterprise Platform for
Compliance and Security
SIEM
Example SIEM Architecture
 Patent-pending scaleable, distributed architecture for enterprises and global organizations.
 Local collection and storage of event data with true global analysis across multiple DBs.
 Leveraging local and remote collectors and a distributed DB, global organizations can collect
and process over 300,000 EPS from up to 30,000 devices.
 Capture, analyze, and manage >26 Billion events per day per distributed DB.
ISO 17799: A Content Framework for IT
Compliance
16
SIEMSIEM
Best Practices
•Don’t Try to filter the logs at the source
•Predicting what is useful or not is like playing Russian Roulette
•It’s much easier to purge information you don’t need vs. never having it
•Good event logging systems will capture 100% and let you purge later
•Determine Reporting Time Periods
•1 week, 1 month, 90 days - more?
•Reporting Periods will drive event data retention policies.
•Plan to store data at least 2 complete reporting intervals
•If you purge old data – be sure you have proper archives…
•Archive Key Logs to Long Life Media
•CD-ROM, DVD-RW, etc
•Use a centralized, standard time source
•When event logs are “time aligned” life is much easier
•Be cautious of sensitive event log content
•Many logs are sent “in the clear” – leverage a VPN for WANs
•Be sure that centralized logging facility is “secure”
•Don’t Alert on Everything – Take it Slow
•Prioritize on what You REALLY want to be alerted on
•Leverage Correlation to Weed Out False Positives
•Rules-based correlation techniques can reduce the chatter
•Correlated reporting will let get a more “holistic view” of the network
•Test Your Logging Facility
•Are you REALLY capturing all the logs? REALLY?
•Encourage Your Teams to Analyze the Data
•Determine your “standard” reports – develop baselines – look for exceptions
•If You Didn’t Log It, Then It Never Happened
Best Practices

Wc4

  • 1.
    NEbraskaCERT 2005: Security Informationand Event Management (SIEM) Matt Stevens Chief Technology Officer Network Intelligence Corporation 8-10-05
  • 2.
    Security Information/Events = Logs •Logs are audit records generated by any software component running on your IT infrastructure • Log records cover: – Normal activity – Error conditions – Configuration changes – Policy changes – User access to assets – Incident alerts – Unauthorized use of resources – Non-privileged access to files – User behavior patterns – Clearing of sensitive data – Access to audit trails • Logs provide feedback on the status of IT resources and all activity going through them
  • 3.
    Example Logs • SampleOperating System Logs – Windows2K Server – 2005/05/17 12:59:12.387 EDT192.168.1.52%NICWIN-4- Security_529_Security: Security,91350077,Tue May 17 12:58:43 2005 , 529,Security,NT AUTHORITY/SYSTEM,Failure Audit,WA1-MASTER- FDC,Logon/Logoff ,,Logon Failure: Reason: Unknown user name or bad password User Name: PIQA Domain: Ntoss Logon Type: 3 Logon Process: NtLmSsp Authentication Package: NTLM Workstation Name: UpTime-HA – 2005/05/17 12:59:29.793 EDT192.168.1.24%NICWIN-4- Security_560_Security: Security,69561800,Tue May 17 12:58:29 2005 , 560,Security,NTOSS/ashtylla,Failure Audit,WA1-MAS90-DC,Object Access ,,Object Open: Object Server: SC Manager Object Type: SC_MANAGER OBJECT Object Name: ServicesActive New Handle ID: - Operation ID: {0,261811266} Process ID: 784 Primary User Name: C:WINNTsystem32services.exe Primary Domain: WA1- MAS90-DC$ Primary Logon ID: NTOSS Client User Name: (0x0,0x3E7) Client Domain: ashtylla Client Logon ID: NTOSS Accesses (0x0,0xF8EAAF4) Privileges READ_CONTROL Connect to service controller Enumerate services Query service database lock state
  • 4.
    Traditional Interest inEvent Logs • Point security solutions provide log messages about critical network events • Main focus on firewalls and IDS/IPS devices • Correlation of events from multiple security points reduces false positives
  • 5.
    Insider Threat Study Paper:Insider Threat Study: Computer System Sabotage in Critical Infrastructure Sectors Published by: U.S Secret Service and CERT Coordination Center/SEI Date: May 2005 From Section3 – Detecting the attack: In general, 75% of the insiders were identified through manual procedures only, and 19% were identified using a combination of automated and manual procedures. The various mechanisms used to identify the perpetrators included • system logs (70%) • insider’s own source IP address (33%) • phone records (28%) • username (24%) • auditing procedures (13%) In those cases in which system logs were used to identify the insider as the perpetrator, the following logs were used • remote access logs (73%) • file access logs (37%) • system file change logs (37%) • database/application logs (30%) • email logs (13%)
  • 6.
    But That IsJust The Beginning… Event log data is the single most underutilized source of information within the organization.
  • 7.
    Capacity Planning • ComputeResources • Network Bandwidth – LAN & WAN • Disk space consumption – Servers – Clients
  • 8.
    Performance & Uptime •Where events happen • When they occur • Who is affected • What sub-systems are involved • Identify common elements
  • 9.
    Legal & HumanResources • Accurate, detailed audit trail • Enforce acceptable use policies – A report sitting on your chair Monday AM is a powerful deterrent to further abuse… • Provides supporting evidence • Can link human assets to IT assets
  • 10.
    Incident Investigation &Forensics • A strong historical record is your best friend • What seems benign today can turn out to be harmful tomorrow… • Logs can quickly narrow down the search • Similar incidents become easier to resolve
  • 11.
    Help Limit CorporateLiability • Determined abuse is hard to stop • An effective policy that is actively monitored proves corporate responsibility • It’s hard to intimidate an event log…
  • 12.
    Detect & PreventI.P. Theft • Makes spotting unusual patterns easier • Proper resource access can be monitored • An effective logging policy can serve as a strong deterrent to casual I.P. theft • Supports efficient prosecution
  • 13.
    Audit & EnforceEmployee Productivity • I.T. resources are expensive and budgets are tight • Maintaining peak competitive stature is key to corporate entity survival • 1% increase in information worker productivity can net nearly a 5% increase in corporate profits* *Source: 2003 McKinsey report on global competition
  • 14.
    Troubleshoot System andNetwork Problems • The original reason for logging – Over 30% of the code in 1969 version of UNIX was dedicated to logging support* • Can be extended to support internal application development • Logs tell the story that other debugging techniques miss… *Source: Ken Thompson and Dennis Ritchie, Bell Labs
  • 15.
    Support Compliance Regulations •Applies to both Gov’t and industry regs • All regulations are based upon similar principles: – Establish controls – Monitor the controls – Report on the trends and monitoring efforts • We all know today’s list of regulations – An effective event log platform prepares you for tomorrow…
  • 16.
    Audit & EnforceIT Security Policy • Apply risk metrics to IT processes • Finding breakdowns in IT security policy faster reduces IT risk • Only effective way to validate point source security technologies
  • 17.
    Event Log DataCreators… Router logs IDS/IDP logs VPN logs Firewall logs Windows logs Client & file server logs Wireless access logs Windows domain logins Oracle Financial Logs NAS Access Logs VLAN Access & Control logs DHCP logs Linux, Unix, Windows OS logs Mainframe logs Database Logs Web server activity Content management logs Web cache & proxy logs VA Scan logs Switch logs
  • 18.
  • 19.
  • 20.
    Many Consumers &Use Cases … Silos of Redundant Information Management
  • 21.
    How to AvoidSilos? Deploy an Enterprise-class SIEM Solution • Collect “All the Data”…. –Broad device support: network, security, infrastructure, & applications –Agent-less, multi-protocol, non-normalized (no filtering) data capture –100% raw data capture –Deep source device coverage. Not a subset of events, all of the known events • …into a Scalable Enterprise Platform… –Modular growth to expand with business initiatives –Price/performance for enterprise-class deployments –Efficient storage and personnel utilization • …that Provides Powerful Analysis for Compliance Violations and Security Threats – Multiple views into the data – Targeted reports for security, SOX, HIPAA, etc – Correlation results between device types – Baseline of workflows – Detailed forensic analysis – Guaranteed, real-time alert performance under load
  • 22.
    Security Information andEvent Management (SIEM) Data Analysis Data Management Data Collection1 3 2
  • 23.
    Collection: Of StrategicImportance It All Starts Here… • Goal: Capture 100% of the Data – But still be able to make use of it • Requirements: – Scalable system • Must be able to meet the accumulating collection rates – Wide device support • Analysis capabilities for many device types – No filtering or normalization of data • All data is important - normal activity included. – Robust data management tools • Raw data collection • High data compression rates • Encryption of stored data • Authentication of stored data – Agents vs. Agent-less
  • 24.
    Collection: Implementing theStrategy • Roll the device collection by types of devices or by departments • Focus on the most critical assets first • Turn on auditing features on your critical assets • Leverage SIEM to transform the data into information that in turns drives knowledge
  • 25.
    Collection: Source DeviceProtocols • Syslog • Syslog-NG • SNMP • Windows event logging API • CheckPoint LEA • FTP • Formatted log files •comma/tab/space delimited, other • ODBC connection to remote databases • Push/pull XML files via HTTP • Cisco IDS POP/RDEP/SDEE
  • 26.
    Collection: Open DeviceSupport • Architecture should be open and permit in-field addition and updates of source device(s). • Uses existing source device collection protocols • Should not require changes to core product • Treat devices as “added content” that can be distributed without interruption to production systems • Automatically identify “unknown” events, yet still permit intelligent analysis later if required
  • 27.
    All the Data ScalablePerformance 3D Asset Awareness Taxonomy-Driven Baselines Variable Decay-time In-line Analysis Analysis: Real-time Correlation Anomaly-based Correlation Rule-based Correlation Easy to Use GUI Accuracy Assured Regardless of Event Format Changes. Huge Device Breadth & Depth. No Agents. 500-300K Sustained EPS from up to 30K Source Devices with 100% Data Capture Provides Best TCO Auto Calculation of “Normal” for All Events, Devices and Alerts. 100% Mapped via Extensible Taxonomy Advanced Boolean Logic Driven Correlation Enables Real-time Evaluation Against Corporate Policies REAL Real-Time Analysis with Consistent High Performance Alerting, Independent of Incoming EPS. Intelligent Alert Ranking Via Automatic Gathering Of Asset Vulnerability, Value, & Type. Detects and Alerts on Variations from Automatically Computed Baselines of both Events and Alerts. Permits Sophisticated Correlation Logic to Detect and Alert on Multi-Vector Fast Attack & Low and Slow Delivers Efficient and Effective Security Operations. Correlation Logic can be Managed Online or Offline.
  • 28.
    Analysis: Vulnerability Data •VA tools provides a known list of hosts and detected vulnerabilities. • Analysis can leverage this data to score threats based on asset vulnerabilities • All rules evaluate vulnerability data of all the target assets. Higher vulnerability values of attacked assets escalate the severity level • Customized rules should be able to evaluate individual assets or asset groups and alert when their vulnerabilities exceed a certain level
  • 29.
    Analysis: Threat Scoring •Alerts are grouped into alert categories • All alert categories have (5) alert severity levels that default to US Homeland Security levels • Internal scoring algorithm automatically computes alert severity levels based upon event contents, rates, baselines and asset values • Incorporates asset attributes, including frequency of asset in event payload, importance and vulnerability • Automatic ranking of all alerts contained in a view to focus security administrators on most critical incidents first
  • 30.
    Analysis: Event Classification •All events should be classified using a global taxonomy structure – thus providing a standard to the myriad of non-standard log events from all source device vendors • Leveraging taxonomy to evaluate events by category, regardless of source device permits correlation to stay current and relevant far easier • Event classification should be fully exposed to the user. Users should be able to create new categories and assign new messages to any level in the taxonomy tree
  • 31.
    Analysis: Baseline Data •Baselines should be created automatically – “learned” from the actual network activity • Minute, hour, day and week baselines permit tracking of spikes as well as “low and slow” patterns • Baselines are aware of normal activity pattern changes over the course of the day, week and month. • Correlation engines can use baseline data to detect anomalies based on activity percent change from normal behavior
  • 32.
    Analysis: Baselines Scoreover time 48 52 50 55 60 58 57 61 54 57 54 59 40 50 60 70 80 90 100 12 3 4 5 6 7 8 9 10 11 12 Time (inMinutes) ScoreValue -10 0 10 20 30 40 50 60 70 80 90 %Difference CurrentScore ScoreBaseline %Difference
  • 33.
    Score over time 55 62 48 53 57 64 68 78 98 67 58 65 48 52 50 55 60 58 57 61 54 57 54 59 40 50 60 70 80 90 100 12 3 4 5 6 7 8 9 10 11 12 Time (in Minutes) ScoreValue -10 0 10 20 30 40 50 60 70 80 90 Current Score Score Baseline % Difference Analysis: Baselines
  • 34.
    Severity Levels CalculationSeverityLevels Calculation Score over time 55 62 48 53 57 64 68 78 98 67 58 65 48 52 50 55 60 58 57 61 54 57 54 59 0 28% 19% -5% 3% 16%14% 2% 81% 18% 7% 10% 40 50 60 70 80 90 100 1 2 3 4 5 6 7 8 9 10 11 12 Time (in Minutes) ScoreValue -10 0 10 20 30 40 50 60 70 80 90 %Difference Current Score Score Baseline % Difference Analysis: Baselines
  • 35.
    Severity Levels CalculationSeverityLevels Calculation Score over time 65 58 67 98 78 68 64 57 53 48 62 55 59 54 57 54 61 57 58 60 55 50 52 48 10% 7% 18% 81% 2% 14% 16% 3% -5% 19% 28% 0 40 50 60 70 80 90 100 1 2 3 4 5 6 7 8 9 10 11 12 Time (in Minutes) ScoreValue -10 0 10 20 30 40 50 60 70 80 90 %Difference Current Score Score Baseline % Difference < or = 10% Score Baseline = Low >10% higher than Score Baseline = Guarded >25% higher than Score Baseline = Elevated >50% higher than Score Baseline = High >75% higher than Score Baseline = Severe Analysis: Baselines
  • 36.
    Analysis: Correlation Example– Worm Detection Correlation Rule Name: W32.Blaster Worm The goal of this rule is to detect Blaster worm variants as well as other malicious code by analyzing network traffic patterns. 13
  • 37.
    Analysis: Correlation Example– Website Attack Correlation Rule Name: SQL Injection Attack The goal of this rule is to detect information theft from E-Commerce websites through the exploitation of the trusted connection between the web server and the database. 14
  • 38.
  • 39.
  • 40.
    Analysis: Reporting User Activityfrom External Domains
  • 41.
  • 42.
  • 43.
  • 44.
    32 Analysis: Reporting Top 20Firewall Categories (Taxonomy)
  • 45.
  • 46.
    29 Analysis: Real-time EventViewer Data Mining in Real-time or Historically
  • 47.
    An Enterprise Platformfor Compliance and Security SIEM
  • 48.
    Example SIEM Architecture Patent-pending scaleable, distributed architecture for enterprises and global organizations.  Local collection and storage of event data with true global analysis across multiple DBs.  Leveraging local and remote collectors and a distributed DB, global organizations can collect and process over 300,000 EPS from up to 30,000 devices.  Capture, analyze, and manage >26 Billion events per day per distributed DB.
  • 49.
    ISO 17799: AContent Framework for IT Compliance 16 SIEMSIEM
  • 50.
    Best Practices •Don’t Tryto filter the logs at the source •Predicting what is useful or not is like playing Russian Roulette •It’s much easier to purge information you don’t need vs. never having it •Good event logging systems will capture 100% and let you purge later •Determine Reporting Time Periods •1 week, 1 month, 90 days - more? •Reporting Periods will drive event data retention policies. •Plan to store data at least 2 complete reporting intervals •If you purge old data – be sure you have proper archives… •Archive Key Logs to Long Life Media •CD-ROM, DVD-RW, etc •Use a centralized, standard time source •When event logs are “time aligned” life is much easier •Be cautious of sensitive event log content •Many logs are sent “in the clear” – leverage a VPN for WANs •Be sure that centralized logging facility is “secure”
  • 51.
    •Don’t Alert onEverything – Take it Slow •Prioritize on what You REALLY want to be alerted on •Leverage Correlation to Weed Out False Positives •Rules-based correlation techniques can reduce the chatter •Correlated reporting will let get a more “holistic view” of the network •Test Your Logging Facility •Are you REALLY capturing all the logs? REALLY? •Encourage Your Teams to Analyze the Data •Determine your “standard” reports – develop baselines – look for exceptions •If You Didn’t Log It, Then It Never Happened Best Practices