
Recommended
Recommended
More Related Content
What's hot
What's hot (20)
Similar to Assesment of Water Quality Parameters of Ulhas River in Thane District
Similar to Assesment of Water Quality Parameters of Ulhas River in Thane District (20)
More from rahulmonikasharma
More from rahulmonikasharma (20)
Recently uploaded
Recently uploaded (20)
Assesment of Water Quality Parameters of Ulhas River in Thane District
- 1. International Journal on Recent and Innovation Trends in Computing and Communication ISSN: 2321-8169 Volume: 5 Issue: 7 830 – 834 _______________________________________________________________________________________________ 830 IJRITCC | July 2017, Available @ http://www.ijritcc.org _______________________________________________________________________________________ Assesment of Water Quality Parameters of Ulhas River in Thane District Vihang G. Pathare1 ,Dr.Seema A. Jagtap2 Student,M.E Civil (WRE), YadavraoTasgaonkar College of Engineering & Management, Bhivpuri, India1 Head of Department of Civil Engineering, Thakur College of Engineering & Technology, Mumbai, India2 , vihangpathare@gmail.com1 , jagtap.seema8@gmail.com2 Abstract—Globally water resources are becoming increasingly vulnerable as a result escalating demand arising from the population growth, the need foe increased food production, expanding industrialisation due to rising living standards, pilution due to various anthropogenic activities, and climate change impacts Due to the water scarcity and poor water quality, it has been predicted that by 2050, at least one in four people are likely to live in a country with a shortage of freshwater. Water quality is a complex subject which involves physical, chemical, hydrological and biologicl characteristics of water and their complex and delicate realations. Index Terms— water quality, physico-chemical, biological. __________________________________________________*****_________________________________________________ I. INTRODUCTION The health burden of poor water quality is enormous. It is estimated that around 37.7 million Indians are affected by waterborne diseases annually, 1.5 million children are estimated to die of diarrhoea alone and 73 million working days are lost due to waterborne disease each year. The resulting economic burden is estimated at $600 million a year. The problems of chemical contamination is also prevalent in India with 1, 95,813 habitations in the country are affected by poor water quality. II. THEORY While accessing drinking water continues to be a problem, assuring that it is safe is a challenge by itself. Water quality problems are caused by pollution and over-exploitation. The rapid pace of industrialisation and greater emphasis on agricultural growth combined with financial and technological constraints and non-enforcement of laws have led to generation of large quantities of waste and pollution. The problem is sometimes aggravated due to the non- uniform distribution of rainfall. Individual practises also play an important role in determining the quality of water. The Ulhas River is a perennial river and originates in a valley north of the Rajmachi hills formed by mountains streams draining the north slope of these hills which are part of the Sahyadri range of the Western Ghats in the Raigad district of Maharashtra. Ulhas River is an important westbound river flowing mainly through Thane district of Maharashtra. The Ulhas basin lies between North latitudes of 18o 44’ to 19o 42’ and East longitudes of 72o 45’ to 73o 48’. The river has a draining area of 4637 sq. km in size and the average annual rainfall in the basin is 2934 mm. From the point of origin, the river flows north turning left where it is joined by river Salpe, its right bank tributary. As the river bypasses the Palasdhari village, it receives the discharge from the Palasdhari Dam. Further north, it is met by the river Peg and river Poshir near Neral. At Badlapur, it receives the run-off from Chikloli dam and river Barvi. Literature Review An overview of some research papers is presented here. S.S. Sagar et al (2015) reviewed the studies on the river water sampling and testing. The parameters most common in all the papers reviewed by him were pH, Hardness, Alkalinity, Phosphate, Chloride, Calcium, Magnesium, Chemical Oxygen Demand, Biochemical Oxygen Demand, Dissolved Oxygen, Temperature. These parameters were analysed as per American Public Health Association (APHA) standards. Water quality of Narmada River with reference to physicochemical parameters at Hoshangabad city, Madhya Pradesh, India was evaluated by Sharma Sharddha et al (2011) Four sampling stations at the downstream of Hoshangabad city on river Narmada were selected and water sample were analysed as per standard methods for pH, Electrical Conductivity, Turbidity. In their study, it was found that the major sources of pollution were local anthropogenic activities, agricultural runoff and industrial effluents. It can be inferred from their study that water quality of river Narmada has been severely deteriorated and the potable nature of water being lost. PradyusaSamantray et al. (2009) did the assessment of water quality index in Mahanadi and Atharabanki and Taldanda canal in Paradip, India. Water sample in three different seasons summer, pre-monsoon and winter were analysed for four parameters pH, Dissolved Oxygen, BOD and Fecal
- 2. International Journal on Recent and Innovation Trends in Computing and Communication ISSN: 2321-8169 Volume: 5 Issue: 7 830 – 834 _______________________________________________________________________________________________ 831 IJRITCC | July 2017, Available @ http://www.ijritcc.org _______________________________________________________________________________________ Coliform (FC). The water quality index (WQI) indicated that the river water was highly polluted. Investigation of the Hindon River, western Uttar Pradesh, India was carried out by Shekar S et al. (2015) for the water quality index using eight physicochemical parameters such as pH, EC, TDS, alkalinity, DO, TH, Ca, Mg. bad quality of water was found all over the sampling stations of Hindon river. Thus an urgent and immediate need to restore the water quality by preventing and controlling the river water contamination was highlighted. Prakash Kumar Chaudhari et al. (2016) made physicochemical analysis for the upstream stretch of river Tapi. Water samples of Tapi River near Surat at eight locations were collected and investigated as per the World Health Organisation (WHO) for parameters like pH, Turbidity, DO, TH, Ca, Mg, TS, Cl. Except pH and turbidity all other parameters were found within the WHO prescribed limits. Overall quality of water was found suitable for drinking. Water quality was assessed in terms of physical, chemical and microbiological parameters by Kumavat D. M et al. (2015) for four sampling locations. All the parameters were studied following WHO protocols. The parameters included pH, Temperature, EC, Opacity, TDS, TSS, Hardness, DO, BOD, Total Coliform, Fecal Coliform, Total Viable Count. Their study inferred that all the parameters were within the permissible limits laid by WHO and need for preservation of these standards in the river is necessitated. From the referred literature it can be inferred that the most commonly used water quality parameters are pH, Temperature, DO, BOD, COD, Turbidity, TH, TSS, TDS, alkalinity, Total Coliform, E-Coli, Ca, and Mg. Case Study The Ulhas River water samples for five locations were collected for analysis in the month of July 2017 (Monsoon period). The water samples were tested and analysed for seven critical water quality parameters viz., pH, Turbidity, Dissolved Oxygen (DO), Biochemical Oxygen Demand (BOD), Chemical Oxygen Demand (COD), Total Coliform (TC) and Escherichia Coli (E. coli). The analysis and evaluation of the collected Ulhas River water samples was done in “Water Quality Laboratory”, Level-II, Government of Maharashtra, Water Resources Department, Kalwa (Thane). Total five locations in Thane district on the 122 km long Ulhas River were collected and analysed for the above mentioned seven critical water quality parameters. The location details are as follows: Location A Ulhas River at the upstream (u/s) of Badlapur Water Works, village Kulgaon, TalukaAmbernath, District Thane. Latitude- 19o 08.969’ Longitude- 73o 15.205’ Location B Ulhas River at the downstream (d/s) of Badlapur Water Works, village Valivali, TalukaAmbernath, District Thane. Latitude- 19o 11’ Longitude- 73o 14’ Location C Ulhas River at Jambhul Water Works, village Jambhul, TalukaAmbernath, District Thane. Latitude- 19o 12.012’ Longitude- 73o 13.612’ Location D Ulhas River at the upstream (u/s) of National Century Rayon Bund, village Mohne, TalukaKalyan, District Thane. Latitude- 19o 15’ Longitude- 73o 15’ Location E Ulhas River at the upstream (u/s) of Gandhari Bridge, Near Aadharwadi, TalukaKalyan, District Thane. Latitude- 19o 15.512’ Longitude- 73o 15’ Methodolgy The Ulhas River water samples were analysed for seven water quality parameters viz., pH, Turbidity, Dissolved Oxygen (DO), Biochemical Oxygen Demand (BOD), Chmeical Oxygen Demand (COD), Total Coliform and Escherichia Coli. Result and Discussion Table 1 Location A Sr. No Parameter Unit Result 1 pH No. 6.55 2 Turbidity NTU 13 3 Dissolved Oxygen mg/L 7 4 Biochemical Oxygen Demand mg/L 6 5 Chemical Oxygen Demand mg/L 20 6 Total Coliform MPN Index/100 mL 49 7 Eschrichia Coli MPN Index/100 mL 0
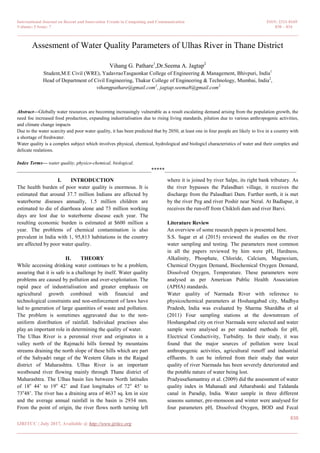
- 3. International Journal on Recent and Innovation Trends in Computing and Communication ISSN: 2321-8169 Volume: 5 Issue: 7 830 – 834 _______________________________________________________________________________________________ 832 IJRITCC | July 2017, Available @ http://www.ijritcc.org _______________________________________________________________________________________ Table 2 Location B Sr. No Parameter Unit Result 1 pH No. 6.84 2 Turbidity NTU 11 3 Dissolved Oxygen mg/L 5.9 4 Biochemical Oxygen Demand mg/L 16 5 Chemical Oxygen Demand mg/L 60 6 Total Coliform MPN Index/100 mL 70 7 Eschrichia Coli MPN Index/100 mL 2 Table 3 Location C Sr. No Parameter Unit Result 1 pH No. 6.65 2 Turbidity NTU 2 3 Dissolved Oxygen mg/L 7.7 4 Biochemical Oxygen Demand mg/L 20 5 Chemical Oxygen Demand mg/L 69 6 Total Coliform MPN Index/100 mL 33 7 Eschrichia Coli MPN Index/100 mL 0 Table 4 Location D Sr. No Parameter Unit Result 1 pH No. 6.88 2 Turbidity NTU 3 3 Dissolved Oxygen mg/L 4.6 4 Biochemical Oxygen Demand mg/L 24 5 Chemical Oxygen Demand mg/L 79 6 Total Coliform MPN Index/100 mL 94 7 Eschrichia Coli MPN Index/100 mL 10 Table 5 Location E Sr. No Parameter Unit Result 1 pH No. 7.56 2 Turbidity NTU 15 3 Dissolved Oxygen mg/L 6.2 4 Biochemical Oxygen Demand mg/L 14 5 Chemical Oxygen Demand mg/L 50 6 Total Coliform MPN Index/100 mL 46 7 Eschrichia Coli MPN Index/100 mL 20 Graphical Representation of Physico-chemical & Bacteriological Parameters Physcio-chemical and bacteriological parameters analysed are prrsented graphically. Figure 1. pH of the water sample at selected 5 Locations Figure 2. Turbidity of the water sample at selected 5 Locations Figure 3. DO of the water sample at selected 5 Locations
- 4. International Journal on Recent and Innovation Trends in Computing and Communication ISSN: 2321-8169 Volume: 5 Issue: 7 830 – 834 _______________________________________________________________________________________________ 833 IJRITCC | July 2017, Available @ http://www.ijritcc.org _______________________________________________________________________________________ Figure 4. BOD of the water sample at selected 5 Locations Figure 5. COD of the water sample at selected 5 Locations Figure 6. Total Coliform of the water sample at selected 5 Locations Figure 7. Escherichia Coliform of the water sample at selected 5 Locations III. DISCUSSION pH Comparing the obtained results with the standard desired limit range of 6.5-8.5 for “A” class quality water the obtained results of the water sample analysed are well within the desired standard limits. Turbidity Comparing the obtained results with the standard desired limit range of 5 N.T.U for “A” class quality water the obtained results of the water sample analysed are marginally above the desired standard limits, except at station 3 and station 4. The drop in the turbidly at these the locations may be attributed to the drastic change in direction of the river flow. Dissolved Oxygen Confronting the obtained results with the standard desired limit range of 5 mg/L the obtained results of the water sample analysed are within the desired standard limits. These can be due to the mixing of the atmospheric oxygen in to the river water due to its characteristics flow pattern of twists and turn with change in altitude. Biochemical Oxygen Demand The BOD is slightly above the standard limit at station “A”, which is the source of Water Intake for Badlapur city. At all other locations the BOD value is marginally above the desired limits indicating organic pollution of the river water. With proper chlorination and treatment water can be used for drinking and other domestic purposes. Chemical Oxygen Demand The COD is moderately above the desired limits indicating organic and chemical pollution of the river water. At station “A” which is the Drinking Water Intake for Badlapur City, the COD value is slightly more than the standard value and the water can be used with proper water purification and treatment for drinking and other domestic purposes. Total Coliform The high values of Total Coliform indicates bacteriological contamination of the river water. The obtained results are well above the desired limits except at Station “A”, the source of water supply to Badlapur city and at station “E” the end point of study. The presence of bacteria can be linked with the monsoon season in addition to the pollution load. The water can be used for drinking from station “A” with disinfection and proper purification treatment. Escherichia Coli The absence of E-Coli at station “A” indicates safe water source for drinking. Also at station “C”, the value of E-Coli
- 5. International Journal on Recent and Innovation Trends in Computing and Communication ISSN: 2321-8169 Volume: 5 Issue: 7 830 – 834 _______________________________________________________________________________________________ 834 IJRITCC | July 2017, Available @ http://www.ijritcc.org _______________________________________________________________________________________ is zero, indicating safe intake of water at Jambhul water works for Ambernath city. The zero value can be due to self- purification of stream. At all other station the presence of E- Coli indicates microbiological contamination detrimental to health. Water can be used with chlorination and allied disinfection treatment. IV. CONCLUSION It can be concluded from the analysis of the seven water quality parameters viz., pH, Turbidity, Dissolved Oxygen, Biochemical Oxygen Demand, Chemical Oxygen Demand, Total Coliform, and Escherichia Coli considered in this study that Ulhas river water is moderately polluted in terms of physicochemical parameters and highly polluted in terms of microbiological parameters. Efficient and effective water treatment, modern and efficient disinfection methods employed before the intended use of the river water is necessary. Also well-defined water sampling locations well-equipped laboratories for testing of water samples and must be set to restore and conserve the Ulhas River water quality. REFERENCES [1] KumavatD.M et al., Quality Status Study of River Kshipra at Ujjain before its linkage with Narmada Water, Issue 2, Volume 4, pp. 1508-1516, Journal of Global Biosciences, ISSN: 2320-1355. [2] PradyusaSamantray et al., Assessment of Water Quality Index in Mahanadi and Atharabanki and Taldanda Canal in Paradip Area, India, Issue 3, Volume 26, pp. 153-161, 2009, J.HUM. Ecol [3] PrakashkumarChaudhari et al., Physicochemical Analysis for Upstream Stretch of River Tapi, Issue 4, Volume 3, May 2016, International Journal of Advances in Mechanical & Civil Engineering, ISSN: 2394-2827. [4] Sharma Shraddha et al., Evaluation of Water Quality of Narmada River with Reference to Physicochemical Parameters at Hoshgandabad City, MP, India, Issue 3, Volume 1, June 2011, Research Journal of Chemical Sciences, ISSN: 2231-606X [5] Shekar S et al., Study of Water Quality Index of Hindon River of Western UP, India: A Comparative Investigation, Issue 2, Volume 5, April-June 2015, International Journal of Basic & Applied Sciences, ISSN: 2277- 2073 [6] S.S. Sagar et al., Physicochemical Parameters for Testing of Water- A Review, Issue 4, Volume 3, 2015, pp. 24-28, International Journal of Chemical Studies, ISSN: 2321- 4902 [7] www.google.com [8] Wikipedia