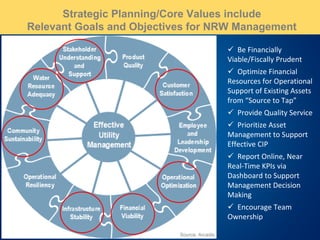
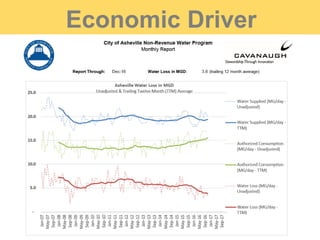
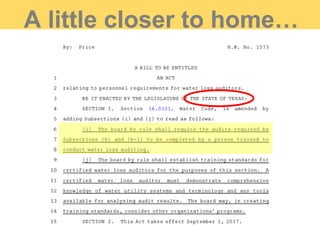
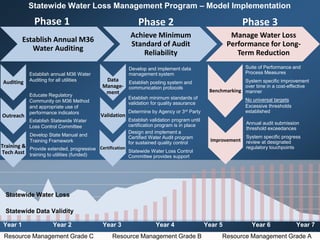
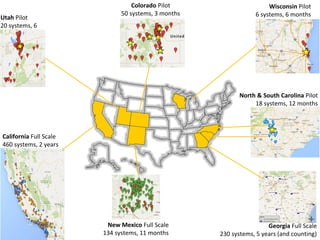
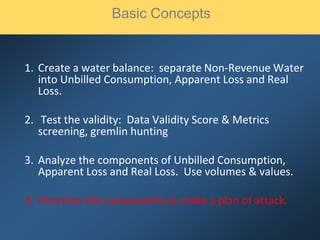
This document provides an overview of water loss control and effective utility management. It discusses setting strategic planning goals and objectives related to non-revenue water management. These include being financially viable, optimizing resources, providing quality service, prioritizing asset management, reporting key performance indicators, and encouraging team ownership. The document also covers water loss control drivers like drought, public trust, economics, and regulations. States are increasingly requiring water loss reporting and moving away from percentage-based performance targets. Finally, it presents a model for implementing a statewide water loss management program over multiple phases and years to improve data validity and water loss performance.


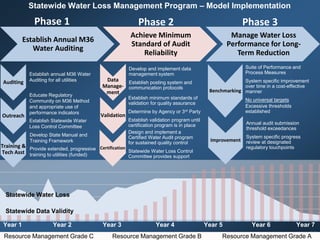
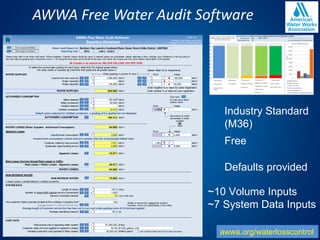
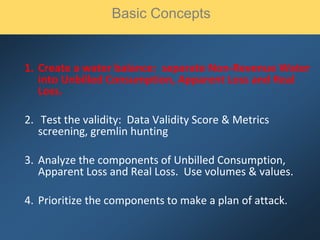
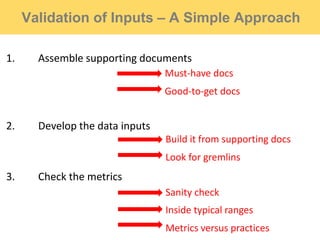
![AWWA M36 Methodology – State of the Art Water
Auditing & Loss Control
Water Audit Report for:
Reporting Year:
All volumes to be entered as: MILLION GALLONS (US) PER YEAR
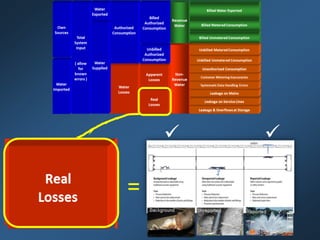
WATER SUPPLIED
Volume from own sources: Million gallons (US)/yr (MG/Yr)
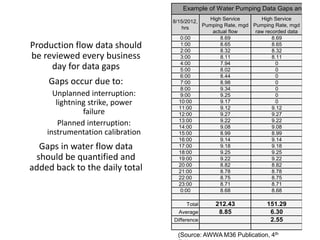
Master meter error adjustment (enter positive value):
Water imported: MG/Yr
Water exported: MG/Yr
WATER SUPPLIED: 0.000 MG/Yr
.
AUTHORIZED CONSUMPTION
Billed metered: MG/Yr
Billed unmetered: MG/Yr
Unbilled metered: MG/Yr Pcnt: Value:
Unbilled unmetered: 0.000 MG/Yr 1.25% 24061
AUTHORIZED CONSUMPTION: 0.000 MG/Yr
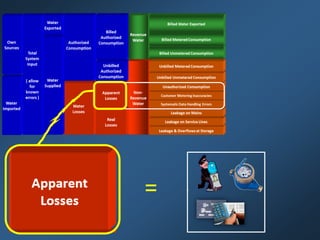
WATER LOSSES (Water Supplied - Authorized Consumption) 0.000 MG/Yr
Apparent Losses Pcnt: Value:
Unauthorized consumption: 0.000 MG/Yr 0.25%
Customer metering inaccuracies: 0.000 MG/Yr
Systematic data handling errors: MG/Yr
Apparent Losses: 0.000
Real Losses (Current Annual Real Losses or CARL)
Real Losses = Water Losses - Apparent Losses: 0.000 MG/Yr
WATER LOSSES: 0.000 MG/Yr
NON-REVENUE WATER
NON-REVENUE WATER: 0.000 MG/Yr
= Total Water Loss + Unbilled Metered + Unbilled Unmetered
SYSTEM DATA
Length of mains: miles
Number of active AND inactive service connections:
Connection density: conn./mile main
Average length of customer service line: ft
Average operating pressure: psi
COST DATA
Total annual cost of operating water system: $/Year
Customer retail unit cost (applied to Apparent Losses):
Variable production cost (applied to Real Losses): $/Million gallons
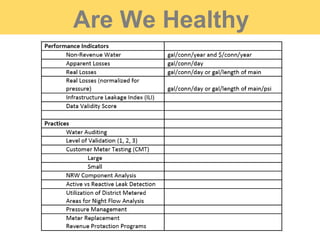
PERFORMANCE INDICATORS
Financial Indicators
Non-revenue water as percent by volume of Water Supplied:
Non-revenue water as percent by cost of operating system:
Annual cost of Apparent Losses:
Annual cost of Real Losses:
Operational Efficiency Indicators
Apparent Losses per service connection per day: gallons/connection/day
Real Losses per service connection per day*: gallons/connection/day
Real Losses per length of main per day*: gallons/mile/day
Real Losses per service connection per day per psi pressure: gallons/connection/day/psi
Unavoidable Annual Real Losses (UARL): Not Valid
From Above, Real Losses = Current Annual Real Losses (CARL): 0.00
* only the most applicable of these two indicators will be calculated
WATER AUDIT DATA VALIDITY SCORE:
PRIORITY AREAS FOR ATTENTION:
1: Billed metered
2: Customer metering inaccuracies
3: Total annual cost of operating water system
*** UARL cannot be calculated as either average pressure, number of connecions or length of mains is too small: SEE UARL DEFINITION ***
Enter a percentage less
than 10% in the red cell
(J42), or select 'Value'
option
Based on the information provided, audit accuracy can be improved by addressing the following components:
Add a grading value for 9 parameter(s) to enable an audit score to be calculated
Infrastructure Leakage Index (ILI) [CARL/UARL]:
Default option selected for unauthorized consumption - a grading of 5 is applied but not displayed
Default option selected for Unbilled unmetered - a grading of 5 is applied but not displayed
AWWA WLCC Free Water Audit Software: Reporting Worksheet
<< Enter grading in column 'E'
MG/Yr
?
?
?
?
?
? Click to access definition
?
?
?
?
?
?
Back to Instructions
Please enter data in the white cells below. Where available, metered values should be used; if metered values are unavailable please estimate a value. Indicate your confidence in the accuracy
of the input data by grading each component (1-10) using the drop-down list to the left of the input cell. Hover the mouse over the cell to obtain a description of the grades
?
?
?
?
?
?
?
?
?
(pipe length between curbstop and
customer meter or property boundary)
Use buttons to select
percentage of water supplied
OR
value
?Click here:
for help using option
buttons below
For more information, click here to see the Grading Matrix worksheet
?
Copyright © 2010, American Water Works Association. All Rights Reserved.
?
?
?
?
WAS v4.2
1991 1999 2006 2009 2014 20172010 20162003 2015
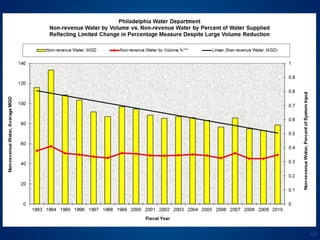
Water Audit Report for: Philadelphia Water Department
Reporting Year:
ALL VOLUMES TO BE ENTERED AS ANNUAL QUANTITIES
WATER SUPPLIED
Volume from own sources: M 95,526.0 million gallons (US) per year
Master meter error adjustment: M 695.4 million gallons (US) per year
Water Imported: M 0.0 million gallons (US) per year
Water Exported: M 7,210.2 million gallons (US) per year
.
WATER SUPPLIED: . 89,011.2 million gallons (US) per year
.
.
AUTHORIZED CONSUMPTION .
Billed metered: M 57,535.2 million gallons (US) per year
Billed unmetered: M 0.0 million gallons (US) per year
Unbilled metered: M 179.3 million gallons (US) per year
Unbilled unmetered: E 693.6 million gallons (US) per year
.
AUTHORIZED CONSUMPTION: . 58,408.1 million gallons (US) per year
.
.
WATER LOSSES (Water Supplied - Authorized Consumption) . 30,603.1 million gallons (US) per year
.
Apparent Losses .
Unauthorized consumption: E 1,145.2 million gallons (US) per year
Customer metering inaccuracies: E 162.5 million gallons (US) per year
Data handling errors: E 2,751.2 million gallons (US) per year
Apparent Losses: . 4,058.9 million gallons (US) per year
Real Losses .
Real Losses (Water Losses - Apparent Losses): . 26,544.2 million gallons (US) per year
.
WATER LOSSES: . 30,603.1 million gallons (US) per year
.
.
NON_REVENUE WATER .
NON-REVENUE WATER: . 31,476.0 million gallons (US) per year
.
SYSTEM DATA .
.
Length of mains: M 3,160.0 miles
Number of active AND inactive service connections: M 548,289
Connection density: . 174 conn./mile main
Average length of private pipe: E 12.0 ft
.
Average operating pressure: E 55.0 psi
.
COST DATA .
.
Total annual cost of operating water system: M $167,604,000 $/Year
Customer retail unit cost (applied to apparent losses): M $3.95
Variable production cost (applied to real losses): M $133.58 $/million gallons (US)
DATA REVIEW - Please review the following information and make changes above if necessary:
- Input values should be indicated as either measured or estimated. You have entered:
12 as measured values
6 as estimated values
0 without specifying measured or estimated
- It is important to accurately measure the master meter - you have entered the measurement type as: measured
- Cost Data: No problems identified
PERFORMANCE INDICATORS
Financial Indicators
Non-revenue water as percent by volume: 35.4%
Non-revenue water as percent by cost: 11.7%
Annual cost of Apparent losses: $16,012,518
Annual cost of Real Losses: $3,545,768
Operational Efficiency Indicators
Apparent losses per service connection per day: 20.28 gallons/connection/day
Real losses per service connection per day*: 132.64 gallons/connection/day
Real losses per length of main per day*: N/A
Real losses per service connection per day per psi pressure: 2.41 gallons/connection/day/psi
Unavoidable Annual Real Losses (UARL): 5.98 million gallons/day
12.17
* only the most applicable of these two indicators will be calculated
AWWA WLCC Water Audit Software: Reporting Worksheet
Infrastructure Leakage Index (ILI) [Real Losses/UARL]:
2004
under-registered
$/1000 gallons (US)
?
?
?
?
?
? Click to access definition
?
?
?
?
?
?
Back to Instructions
Please enter data in the white cells below. Where possible, metered values should be used; if metered values are unavailable please estimate a value.
Indicate this byselecting a choice from the grayboxto the left, where M = measured (or accuratelyknown value) and E = estimated.
?
?
?
?
?
?
?
?
?
(pipe length between curbstop
and customer meter or property
Copyright © 2006, American Water Works Association. All Rights Reserved.
M36
1st Ed.
Water Audit Report for:
Reporting Year:
PLEASE CHOOSE REPORTING UNITS FROM THE INSTRUCTIONS SHEET BEFORE ENTERING DATA
Master Meter Error Adjustments
WATER SUPPLIED Pcnt: Value:
Volume from own sources:
Water imported:
Water exported:
Enter negative % or value for under-registration
WATER SUPPLIED: 0.000 Enter positive % or value for over-registration
.
AUTHORIZED CONSUMPTION
Billed metered:
Billed unmetered:
Unbilled metered: Pcnt: Value:
Unbilled unmetered: 0.000 1.25% 24061
AUTHORIZED CONSUMPTION: 0.000
WATER LOSSES (Water Supplied - Authorized Consumption) 0.000
Apparent Losses Pcnt: Value:
Unauthorized consumption: 8 0.000 0.25%
Customer metering inaccuracies: 5 0.000 1.00%
Systematic data handling errors: 4 0.000 0.25%
Apparent Losses: 0.000
Real Losses (Current Annual Real Losses or CARL)
Real Losses = Water Losses - Apparent Losses: 0.000
WATER LOSSES: 0.000
NON-REVENUE WATER
NON-REVENUE WATER: 0.000
= Water Losses + Unbilled Metered + Unbilled Unmetered
SYSTEM DATA
Length of mains:
Number of active AND inactive service connections:
Service connection density:
Select...
Average length of customer service line:
Average operating pressure:
COST DATA
Total annual cost of operating water system: $/Year
Customer retail unit cost (applied to Apparent Losses):
Variable production cost (applied to Real Losses): $/
WATER AUDIT DATA VALIDITY SCORE:
PRIORITY AREAS FOR ATTENTION:
Are customer meters typically located at the curbstop or property line?
AWWA Free Water Audit Software:
Reporting Worksheet
Default option selected for Unbilled unmetered - a grading of 5 is applied but not displayed
<< Please enter system details and contact information on the Instructions tab >>
Based on the information provided, audit accuracy can be improved by addressing the following components:
<----------- Enter grading in column 'E' and 'J' ---------->
Default option selected for unauthorized consumption - a grading of 5 is applied but not displayed
?
?
?
?
?
? Click to access definition
?
?
?
?
?
?
Please enter data in the white cells below. Where available, metered values should be used; if metered values are unavailable please estimate a value. Indicate your confidence in the accuracy of
the input data by grading each component (1-10) using the drop-down list to the left of the input cell. Hover the mouse over the cell to obtain a description of the grades
?
?
?
?
?
?
(length of service line, beyond the property
boundary, that is the responsibility of the utility)
Use buttons to select
percentage of water
supplied
OR
?Click here:
for help using option
buttons below
?
?
?
?
+
+ Click to add a comment
WAS v5.0
+
+
+
+
+
+
American Water Works Association.
Copyright © 2014, All Rights Reserved.
?
?
?
+
+
+
+
+
+
+
+
+
+
+
+
+ Use Customer Retail Unit Cost to value real losses
?
BETA TEST v1
Water Audit Report for:
Reporting Year:
System Attributes:
Apparent Losses:
+ Real Losses:
= Water Losses:
Unavoidable Annual Real Losses (UARL):
Annual cost of Apparent Losses:
Annual cost of Real Losses: Valued at Variable Production Cost
Performance Indicators:
Non-revenue water as percent by volume of Water Supplied:
Non-revenue water as percent by cost of operating system: Real Losses valued at Variable Production Cost
Apparent Losses per service connection per day:
Real Losses per service connection per day:
Real Losses per length of main per day*:
Real Losses per service connection per day per meter (head) pressure:
From Above, Real Losses = Current Annual Real Losses (CARL):
* This performance indicator applies for systems with a low service connection density of less than 32 service connections/mile of pipeline
Infrastructure Leakage Index (ILI) [CARL/UARL]:
Return to Reporting Worksheet to change this assumpiton
AWWA Free Water Audit Software:
System Attributes and Performance Indicators
********** REPORTING UNITS MUST BE SELECTED ON THE INSTRUCTIONS WORKSHEET BEFORE PERFORMANCE INDICATORS CAN BE DISPLAYED **********
?
?
American Water Works Association.
Copyright © 2014, All Rights Reserved.
WAS v5.0
Financial:
Operational Efficiency:
BETA TEST v1
AWWA Audit
Software v1
AWWA Audit
Software v4
AWWA Compiler for
large audit sets WRF Real Loss
Component Analysis
Model
~7,000 downloads to date of
AWWA Audit Software v5
AWWA Audit
Software v5
M36
2nd Ed.
M36
3rd Ed.
M36
4th Ed.](https://image.slidesharecdn.com/6cavanauagh-170417142312/85/Water-Loss-Control-and-Effective-Utility-Management-36-320.jpg)
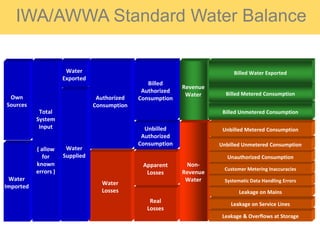

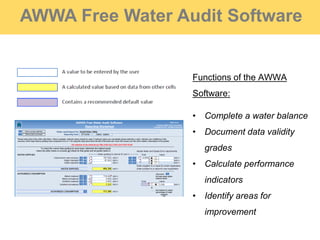
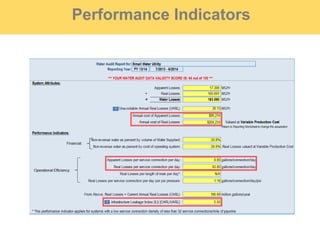
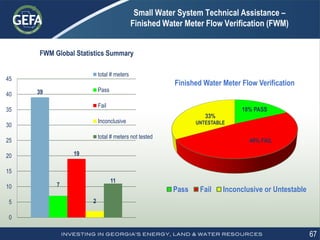
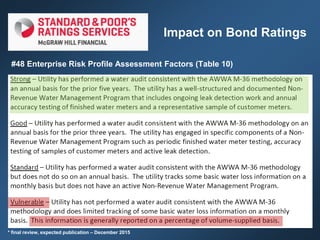
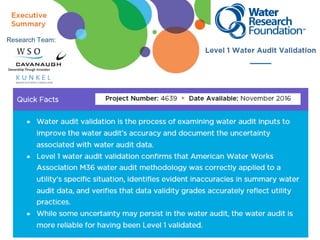
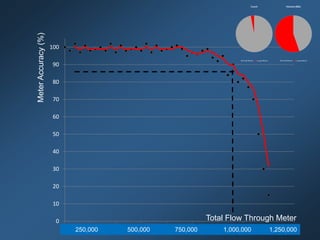
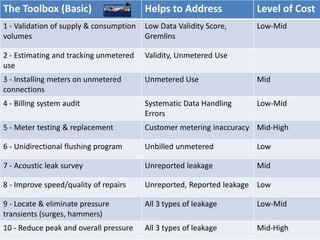
![Step 3 – Check the Metrics
Metrics versus Practices
Inside the range – are they high, mid, or low?
How does that compare to the water loss management practices?
Apparent Losses: 208.225 MG/Yr
+ Real Losses: 736.495 MG/Yr
= Water Losses: 944.720 MG/Yr
Unavoidable Annual Real Losses (UARL): 83.69 MG/Yr
Annual cost of Apparent Losses: $821,449
Annual cost of Real Losses: $139,934 Valued at Variable Production Cost
Non-revenue water as percent by volume of Water Supplied: 26.0%
Non-revenue water as percent by cost of operating system: 10.4% Real Losses valued at Variable Production Cost
Apparent Losses per service connection per day: 46.78 gallons/connection/day
Real Losses per service connection per day: 165.45 gallons/connection/day
Real Losses per length of main per day*: N/A
Real Losses per service connection per day per psi pressure: 2.55 gallons/connection/day/psi
From Above, Real Losses = Current Annual Real Losses (CARL): 736.49 million gallons/year
8.80
systems with a low service connection density of less than 32 service connections/mile of pipeline
*** YOUR WATER AUDIT DATA VALIDITY SCORE IS: 62 out of 100 ***
Infrastructure Leakage Index (ILI) [CARL/UARL]:
Return to Reporting Worksheet to change this assumpiton
?
?
Typical Ranges*** YOUR WATER AUDIT DATA VALIDITY SCORE IS: 51 out of 100 ***
20 – 200
4 – 40
400 – 4000
2 – 10](https://image.slidesharecdn.com/6cavanauagh-170417142312/85/Water-Loss-Control-and-Effective-Utility-Management-72-320.jpg)

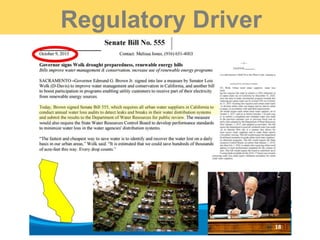
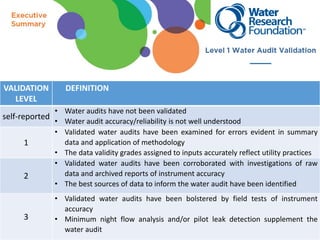
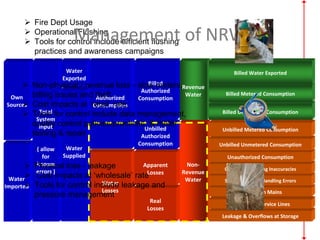
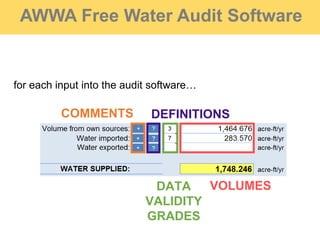
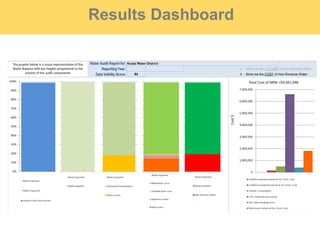
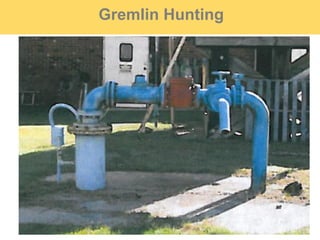
![Water Audit Report for: EXAMPLE - Tallapoosa (1430002)
Reporting Year:
System Attributes:
Apparent Losses: 3.787 MG/Yr
+ Real Losses: 47.362 MG/Yr
= Water Losses: 51.149 MG/Yr
Unavoidable Annual Real Losses (UARL): See limits in definition MG/Yr
Annual cost of Apparent Losses: $18,860
Annual cost of Real Losses: $123,614 Valued at Variable Production Cost
Performance Indicators:
Non-revenue water as percent by volume of Water Supplied: 26.5%
Non-revenue water as percent by cost of operating system: 16.5% Real Losses valued at Variable Production Cost
Apparent Losses per service connection per day: 6.05 gallons/connection/day
Real Losses per service connection per day: 75.66 gallons/connection/day
Real Losses per length of main per day*: N/A
Real Losses per service connection per day per psi pressure: 0.95 gallons/connection/day/psi
From Above, Real Losses = Current Annual Real Losses (CARL): 47.36 million gallons/year
* This performance indicator applies for systems with a low service connection density of less than 32 service connections/mile of pipeline
*** YOUR WATER AUDIT DATA VALIDITY SCORE IS: 69 out of 100 ***
Infrastructure Leakage Index (ILI) [CARL/UARL]:
2014 1/2014 - 12/2014
Return to Reporting Worksheet to change this assumption
?
?
Financial:
Operational Efficiency:
Unreported Reported
Background](https://image.slidesharecdn.com/6cavanauagh-170417142312/85/Water-Loss-Control-and-Effective-Utility-Management-89-320.jpg)
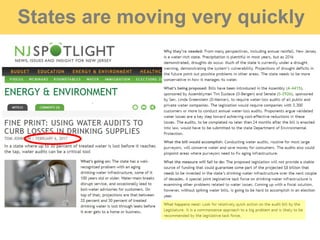
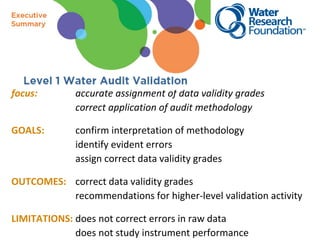
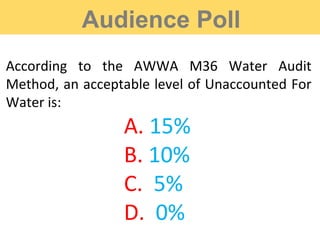
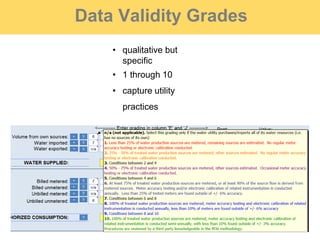
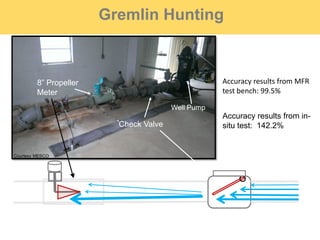
![Unreported ReportedBackground
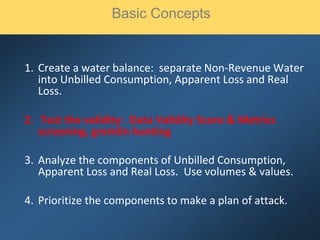
Water Audit Report for: #2 - City of Cave Spring (GA 150000)
Reporting Year:
System Attributes:
Apparent Losses: 4.041 MG/Yr
+ Real Losses: 29.998 MG/Yr
= Water Losses: 34.039 MG/Yr
Unavoidable Annual Real Losses (UARL): 28.55 MG/Yr
Annual cost of Apparent Losses: $30,992
Annual cost of Real Losses: $6,476 Valued at Variable Production Cost
Performance Indicators:
Non-revenue water as percent by volume of Water Supplied: 23.8%
Non-revenue water as percent by cost of operating system: 4.8% Real Losses valued at Variable Production Cost
Apparent Losses per service connection per day: 6.91 gallons/connection/day
Real Losses per service connection per day: N/A gallons/connection/day
Real Losses per length of main per day*: 944.67 gallons/mile/day
Real Losses per service connection per day per psi pressure: N/A gallons/connection/day/psi
From Above, Real Losses = Current Annual Real Losses (CARL): 30.00 million gallons/year
1.05
* This performance indicator applies for systems with a low service connection density of less than 32 service connections/mile of pipeline
Infrastructure Leakage Index (ILI) [CARL/UARL]:
2014 1/2014 - 12/2014
Return to Reporting Worksheet to change this assumption
*** YOUR WATER AUDIT DATA VALIDITY SCORE IS: 52 out of 100 ***
?
?
Financial:
Operational Efficiency:](https://image.slidesharecdn.com/6cavanauagh-170417142312/85/Water-Loss-Control-and-Effective-Utility-Management-91-320.jpg)