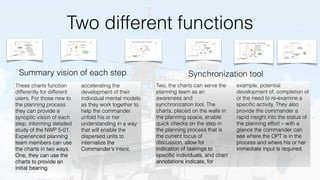
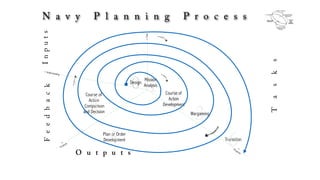
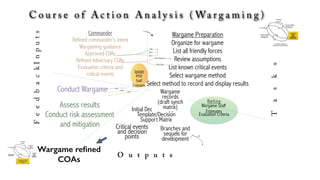
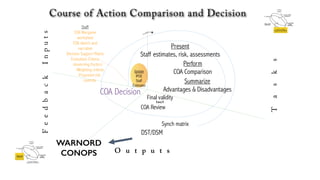
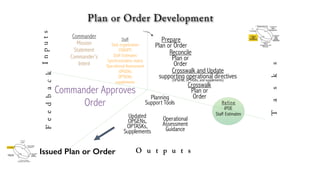
Workshop su Agile Project Framework e Agile PM per il PMI®-NIC Branch Lombardia. Cosa è Agile, l'Agile Project Framework e Agile Project Management e le tecniche MoScoW e il Timeboxing. Come si struttura un Team Agile.
The project life cycle consists of four phases: initiation, planning, execution, and closure. The initiation phase involves establishing the business need, feasibility, terms of reference, project team, and office. The planning phase includes creating detailed plans for the project, resources, finances, quality, risks, acceptance, communications, and procurement. In the execution phase, deliverables are built while being monitored and controlled. Various management processes also occur. Finally, the closure phase involves performing project closure and reviewing project completion.
This document provides step-by-step instructions for creating a project plan in Microsoft Project 2013, including how to start a project, plan tasks, assign resources, set a baseline, update progress, view reports, create an S-curve chart, and export data to Excel. The intended audience is beginners to project management who are familiar with earlier versions of MS Project.
The document outlines 20 steps for developing a project management plan. It discusses that the plan sets the rules for implementing, controlling, and monitoring a project. The plan is developed during the planning phase and integrates all the knowledge areas defined by PMI. It may also include the project life cycle, change management plan, configuration management plan, and methods for maintaining the project baseline. The document then presents a process map for developing the project management plan starting from the project charter. It also provides an overview of the 47 processes defined by PMI, grouped by knowledge areas and process groups.
Software Project Management: Project PlanningMinhas Kamal
Software Project Management: ResearchColab- Project Planning (Document-4)
Presented in 4th year of Bachelor of Science in Software Engineering (BSSE) course at Institute of Information Technology, University of Dhaka (IIT, DU).
Building Formulas And Dashboard In Ms ProjectRelu Rosenberg
The document describes how to build a project dashboard in MS Project using formulas and functions to calculate task progress and add graphical indicators. It provides three levels of logic to calculate task progress status and discusses defining custom fields, writing formulas, adding indicators, and using filters. The presentation aims to automate the identification of active tasks, issues, and create automated project status reports for management.
The document discusses project phases and management. It describes the typical 5 phases of a project - initiation, planning, execution, monitoring and control, and closure. It provides details on each phase, including developing a project charter and business case in initiation, creating a project plan and defining roles in planning, executing the project in the execution phase, monitoring and controlling the project, and closing the project. It also discusses the importance of project feasibility studies and setting goals using SMART and CLEAR frameworks to help define goals that cater to dynamic project environments.
This is the part of the presentation done by a PMP Workgroup which includes the project managers from NashTech, Trobz and Besco to study the Project Management and get the PMP certification. This part describes the process of Estimate Activity Durations in the Project Schedule Management knowledge area.
The document discusses visual tools that can be used to summarize and guide the Navy planning process. It proposes a set of diagrams to depict the planning process as a spiral or helix to better represent its complexity. The diagrams are intended to serve as "external memory structures" that planners can reference as they work through each step of the process. They provide an overview of the inputs, tasks, outputs, and feedback involved in a given planning step. These concept maps are meant to help planners navigate the dynamic, non-linear planning process and foster shared understanding among commanders and staff.
The document provides the Sailor's Creed and Navy Ethos, which outline the core values and commitment of United States Sailors and the Navy. It also includes calendars, course listings, and other resources to assist Naval leaders in their professional development and planning. Contact information is provided for the Center for Personal and Professional Development to submit feedback and suggestions for improving future editions of the guide.
Military Decision Making Process (Mar 08) 2Thomas cleary
The document provides information on identifying and evaluating threats, including determining the threat's objectives, analyzing capabilities and weaknesses, developing possible courses of action (COAs), and modeling threat COAs. Key steps discussed are identifying the threat and why it fights, studying the insurgency's organization and tactics, capturing the disposition and composition of forces, and prioritizing the most probable and most dangerous COAs.
The document is a website for Aquinicum Press located at www.aquinicumpress.com. Aquinicum Press appears to be a publishing company focused on Catholic theology and philosophy based on the website domain name. The website likely provides information about the publisher such as their publications, authors, and contact details but this cannot be determined from the given information which only provides the URL.
This document outlines an agenda for a training session on mobilization. It will cover the roles and responsibilities of a mobilizer, building effective teams, setting and achieving targets, and Gram Tarang's functioning departments. The session will use activities, case studies, brainstorming, and questions to teach trainees about priorities, team building skills, communicating targets, and providing awards and recognition. Trainees should understand the difference between an ideal and busy mobilizer upon completing the training.
This document discusses scenario methodology for addressing uncertainty in complex systems. It begins by defining key terms like data, information, knowledge, and wisdom. It then discusses types of uncertainty like determinism, probability, and pure uncertainty. The document outlines the history and definitions of scenario methodology, providing examples of its use from the 1960s to present day. It describes the steps involved in constructing scenarios, including identifying issues and uncertainties, creating alternative scenarios, and assessing them. The document concludes by noting scenarios help bridge theory and practice, and must balance continuity and surprise to represent the range of possible outcomes.
Tu Mu, Chinese military commentator, said, “If I wish to take advantage of the enemy I must perceive not just the advantage in doing so but must first consider the ways he can harm me if I do.” A key part of waging war and offensive strategies in the proposal world is to war game in a Black Hat review where we create potential war scenarios by aligning ourselves and our allies against a set of opponents. Each team assumes the competitor mindset and prepares as if they are the competition. Each team collects intelligence and develops their battle plans and using rules created to closely simulate battle (proposal evaluation) conditions, play out the war game in front of the evaluators. Only one team is victorious, we gain valuable insight into the strategies of our competition, and gather lessons learned. In this session, we explore the Black Hat process, how to define the competitive information you need upfront, develop high producing teams, optimize the teams’ products and leverage them in your proposal.
This presentation explains what foresight consist of, how it contributes to face change, and the different steps to face changes from identifying the forces of change to defining real strategies.
Check out "Empowering local organisations through foresight" by Robin Bourgeois, Senior Foresight Advisor, GFAR Secretariat at: http://bit.ly/17GoTt4
Hypermedia Discourse: Theory & Technology for the Pragmatic Web?Simon Buckingham Shum
This document discusses hypermedia discourse and the pragmatic web. It describes how contexts change meanings in conversations and documents, and how this impacts formal semantics on the web. The talk will cover web pragmatics and hypermedia discourse. It provides two examples of tools that support hypermedia discourse: Compendium, which enables concept mapping, real-time meeting capture, and participatory modeling; and the Scholarly Ontologies Project, which allows publishing scholarly claims and argumentation as semantic hypertext. Key elements of Compendium that support hypermedia discourse are also outlined.
Rick Barron: User Experience Testing MethodsRick Barron
Various user experience testing methods are summarized, including A/B testing which allows testing different page versions to see what users respond to best, backcasting which works backwards from an ideal scenario to determine required actions, and card sorting which involves sorting labeled cards into groups to guide navigation design. Collaborative inspection involves stakeholders and users walking through tasks together, while personas represent archetypal users and their goals.
This document discusses different techniques for code reuse in object-oriented programming, including inheritance, mixins, traits, and functional mixins. It notes some limitations of inheritance and abstract base classes when trying to share common code between subclasses. Mixins are presented as a way to share code by merging objects or functions into class prototypes without inheriting from them. Traits are described as "smart mixins" that define reusable behaviors but no state, and can be composed from other traits while resolving name conflicts through aliasing or exclusion.
The document discusses the development of a tabletop wargame simulation of humanitarian aid and disaster relief efforts in Haiti following the 2010 earthquake. It covers various considerations in designing the game such as using a card-driven system to represent events, focusing on relationships and coordination between organizations, and having 4-12 players represent different stakeholder groups involved in the relief efforts over 1-2 months. The document also discusses game mechanics, variables, learning objectives, and whether the game should model the actual historical events or introduce uncertainty.
This document is an example crisis action plan created by Herschel Campbell for a fictional company called Oil Services Global Security Center (OSGSC). The plan contains sections on activation instructions, a table of contents, the OSGSC's mission and organization structure, threat assessments, mitigation strategies, contingency plans for various crisis events, recovery procedures, and appendices with additional details. The plan is intended to ensure continuity of OSGSC operations during any crisis situations.
The document outlines a challenge to design a game about relief operations during the 2010 Haiti earthquake. It provides background on the actual humanitarian response, noting the involvement of international organizations, NGOs, and foreign militaries. Key considerations for the game design include accurately representing different actors, operational priorities, coordination challenges, and emphasizing the role of local populations in disaster response. Participants will work in teams to develop game concepts addressing relief efforts in the aftermath of the earthquake in Haiti.
This document provides guidance on the Military Decision Making Process (MDMP) and Troop Leading Procedures (TLP). It outlines the 7 steps of MDMP which include receiving the mission, conducting mission analysis, developing courses of action, analyzing COAs, issuing orders, and supervising. Key aspects of mission analysis covered include Intelligence Preparation of the Battlefield and determining specified/implied tasks. Course of action development involves analyzing relative combat power, generating options, arraying forces, and developing the scheme of maneuver. The TLP guide emphasizes that the steps are not always linear and occur throughout MDMP.
Military Decision Making Process (Mar 08) 3Thomas cleary
This document provides guidance on conducting mission analysis according to FM 5-0. It outlines the 16 steps of mission analysis, including restated mission, commander's intent, risk assessment, information requirements, and initial warning order. Key outputs of mission analysis are updated staff estimates, initial IPB products, restated mission, commander's planning guidance, and warning order #2. The document also discusses developing courses of action, including analyzing relative combat power and generating options for meeting the mission.
Slides Dominic Gadoury recently used in his discussion w/ mentees of The Product Mentor.
The Product Mentor is a program designed to pair Product Mentors and Mentees from around the World, across all industries, from start-up to enterprise, guided by the fundamental goals…Better Decisions. Better Products. Better Product People.
Throughout the program, each mentor leads a conversation in an area of their expertise that is live streamed and available to both mentee and the broader product community.
http://TheProductMentor.com
Program Management Tools and Techniques: Best Practices & Workshop for Progra...John Carter
1. The document provides an overview of a program management education series workshop on program and change management tools and techniques. It outlines the learning objectives, which include applying tools from each phase of the DMAIC structure.
2. The workshop is structured around modules that combine lecture and exercises. Module 1 focuses on defining projects using tools like project team wheels, circle dot charts, and stakeholder analyses. Module 2 measures projects using value stream mapping. Module 3 analyzes risks and challenges through risk mind maps, change impact matrices, and Ishikawa diagrams. Module 4 improves execution using team PERT charts.
3. Participants will learn how to structure project teams, clarify roles, manage stakeholders, map processes, identify and
You will be able to understand,
Project Management, WBS, Network Diagram and application CPM.
A solved example for finding Float, EST, EFT. LST and LFT.
Few unsolved examples for practice.
Thank you.
This document discusses various aspects of project management and control tools. It covers topics like project organization, the human aspect of project management, planning and control. Specific tools discussed include Gantt charts and Line of Balance (LOB) charts. Gantt charts illustrate a project schedule visually using bars to represent tasks and their duration. LOB charts are an extension of Gantt charts used for scheduling repetitive projects through a series of inclined lines showing the rate of work. The document provides details on how to construct, analyze, and use these charts to manage projects.
The Logical Framework Approach is a project design methodology used to outline the key elements of a project in a four-by-four table format. The rows describe project activities, outputs, purpose, and goal. The columns provide a narrative description, objectively verifiable indicators, means of verification, and assumptions. The approach presents the causal relationships between inputs, outputs, and outcomes and helps identify the critical assumptions needed for the project's success.
5 The Logical Framework - a short course for NGOsTony
A series of modules on project cycle, planning and the logical framework, aimed at team leaders of international NGOs in developing countries.
There is a handout to go with this module, a Logframe with blanks. http://www.slideshare.net/Makewa/exercise-watsan-logframe-with-blanks
This document provides an overview of key concepts and methods for evaluating programs, including:
1. SWOT analysis, the steps in program evaluation, milestone charts, Gantt charts, PERT, critical path method, Bennett's hierarchy of evaluation, and the logical framework approach.
2. It describes each method at a high level - for example, that SWOT analysis identifies strengths, weaknesses, opportunities, and threats, and that the critical path method uses mathematical calculations to schedule project activities.
3. Bennett's hierarchy presents a logic model for educational programs with 7 steps from inputs to end results, showing how the program causes changes in knowledge and practice.
The document discusses various methods for monitoring and controlling software projects, including creating frameworks, assessing progress, and reporting. It describes several visual tools to track project schedules and progress, such as Gantt charts, slip charts, and ball charts. These charts represent tasks, timelines, and dependencies to provide snapshots of project status and identify activities that are ahead of or behind schedule so corrective actions can be taken if needed. Regular progress monitoring and reporting against project plans is important for project control.
Critical Path Analysis (CPA) and Program Evaluation and Review Technique (PERT) are project management tools used to schedule complex projects. CPA identifies the critical path of tasks that must be completed on time for the project to finish on time. It also identifies non-critical parallel tasks. PERT is similar but takes a more conservative approach to estimating task durations. Both help project managers monitor progress and determine where to take remedial action if the project falls behind schedule.
This document provides an overview of various tools used for educational management, including control charts, Gantt charts, critical path method (CPM), program evaluation and review technique (PERT), and planning programming budgeting system (PPBS). It describes each tool, how it is used, its process and benefits. Control charts are used to study process changes over time using a central line and upper and lower control limits. Gantt charts are used for project planning and guidance. CPM and PERT are used for project scheduling and identify critical paths. PPBS is a management tool for decision making and implementation using a program structure, documents, decision process and information system.
The Logical Framework Approach (LFA) is a systematic planning process for project design, execution and evaluation. It involves developing a matrix with four columns that outline the project goals, objectives, outputs, activities and external factors. The LFA helps planners envision the causal relationships within a project and establish measurable indicators to monitor progress. It has been widely adopted by international organizations as an effective tool for objective-oriented project management.
Company Software Project Management Recommendation ReportMatthew Levandowski
This document provides a recommendation report for improving project management and software development techniques at Clean Logix. It discusses current issues like scaling up, team integration, and changing requirements. It then describes different project management systems like waterfall, agile management, scrum, and kanban. It recommends analyzing decision making using the Stacey matrix and implementing digital project metrics for improved tracking and reporting. Finally, it examines various project management software options.
Pm0011 project planning and scheduling (1)smumbahelp
Dear students get fully solved assignments
Send your semester & Specialization name to our mail id :
help.mbaassignments@gmail.com
or
call us at : 08263069601
The document discusses agile metrics that can be used at different levels - project, program, and portfolio. At the project level, metrics measured during planning include story points and velocity. During execution, metrics include burn-down, burn-up, and escaped defects. Risk and quality are also measured. At the program and portfolio levels, priorities are set and multiple teams contribute to releases, requiring metrics like cycle time. Agile principles provide value-driven delivery through iterative development and customer feedback compared to the traditional waterfall model.
The document discusses metrics that can be used in agile projects, programs, and portfolios. At the project level, metrics include story points, velocity, burn-down/burn-up charts, defects, and time spent on features vs bugs. Program metrics include cycle time and process efficiency. Portfolio metrics include ROI, contribution margin, and prioritization changes. The document provides examples of using these metrics for planning, execution, risk management, and decision making at different levels of an agile organization.
The ILS Manager oversees all logistics functions for a program, including planning, personnel management, product development, and cost accounting. They establish processes and plans, integrate logistics with engineering, and ensure the team has what they need to complete the logistics work in a timely and cost-effective manner. The ILS Manager acts as the director for the logistics program parallel to the overall system program.
The document discusses project governance and the role of a Program Management Office (PMO). It defines project governance as applying governance principles to both individual project management and portfolio management at the business level. It then outlines some key responsibilities of a PMO, such as managing a portfolio of projects, overseeing budgets, and standardizing project management processes and reporting. The document notes that PMOs help address common reasons why projects fail, such as poor planning and governance, by taking on responsibilities like risk escalation and enforcing project controls.
Program Management 2.0: Circle-Dot Charts and CommunicationJohn Carter
From a course titled Program Management 2.0, this presentation shows how Circle-Dot charts can be applied to clarify roles within teams, and within organizations. This is a more powerful version of a RACI chart, which most clearly pinpoints key roles, and key decisions.
The document provides an overview of the key concepts and topics covered in the IS5540 Project Management & Quality Assurance course, including definitions of projects and project management, the project management process groups and knowledge areas, tools and techniques for managing project scope, time, cost, quality, risk and resources, and factors for project success. It also reviews concepts like the project management plan, quality planning, communication planning, and performance reporting.
This document provides an overview of quality project management. It discusses 10 factors that drive quality through project management, including decision making capability, risk management, and schedule pressure. It also outlines 6 common quality management tools: check sheets, control charts, Pareto charts, scatter plots, Ishikawa diagrams, and histograms. Finally, it lists additional quality management topics and provides links to download related PDFs.
Similar to Visualizing the Navy Planning Process (20)
EASY TUTORIAL OF HOW TO USE CAPCUT BY: FEBLESS HERNANEFebless Hernane
CapCut is an easy-to-use video editing app perfect for beginners. To start, download and open CapCut on your phone. Tap "New Project" and select the videos or photos you want to edit. You can trim clips by dragging the edges, add text by tapping "Text," and include music by selecting "Audio." Enhance your video with filters and effects from the "Effects" menu. When you're happy with your video, tap the export button to save and share it. CapCut makes video editing simple and fun for everyone!
Discovering the Best Indian Architects A Spotlight on Design Forum Internatio...Designforuminternational
India’s architectural landscape is a vibrant tapestry that weaves together the country's rich cultural heritage and its modern aspirations. From majestic historical structures to cutting-edge contemporary designs, the work of Indian architects is celebrated worldwide. Among the many firms shaping this dynamic field, Design Forum International stands out as a leader in innovative and sustainable architecture. This blog explores some of the best Indian architects, highlighting their contributions and showcasing the most famous architects in India.
Explore the essential graphic design tools and software that can elevate your creative projects. Discover industry favorites and innovative solutions for stunning design results.
Practical eLearning Makeovers for EveryoneBianca Woods
Welcome to Practical eLearning Makeovers for Everyone. In this presentation, we’ll take a look at a bunch of easy-to-use visual design tips and tricks. And we’ll do this by using them to spruce up some eLearning screens that are in dire need of a new look.
International Upcycling Research Network advisory board meeting 4Kyungeun Sung
Slides used for the International Upcycling Research Network advisory board 4 (last one). The project is based at De Montfort University in Leicester, UK, and funded by the Arts and Humanities Research Council.
2. Introduction
Welcome to this slidedoc, a
combination of article and slide
presentation.
This slidedoc contains material
from an article originally published
in MOC Warfighter, a US Naval
War College publication.
3. Planning
The military planning system
provides a structured process
through which contributions
from the staff, as well as
superiors and subordinate units,
enable the Commander’s intent
to unfold and become effective.
Visual displays, in the form of
diagrams explaining the steps in
the process as well as serving
as the resulting plans (often in
the form of Power Point
presentations) play an important
role. As the Naval Warfare
Publication 5-01 Navy Planning
puts it, “Military planning, and
by extension, Navy planning, is
the process by which a
commander (CDR) visualizes an
end state as well as the
arrangement of potential actions
in time and space that will allow
the realization of that future.”
Checklists, decision support
matrixes, tables articulating
risks and other tools visually
displaying planning process
elements are central to planning
process execution. In addition,
visual tools concerning the
process itself can facilitate
education, training and
execution of the Navy Planning
Process (NPP).
4. Military planning is both complicated, with many
different parts, and complex, consisting of parts
interacting in multivalent ways. However, these
diagrams often portray the planning process as
linear, which fails to communicate the complexity
of the process. This linear bias appears not only
in descriptions of the planning process itself, but
in the plans that the process generates. For
example, plans proceed along “Lines of
operations” visually represented in Figure II-13 of
JP 5-0 and “Lines of Effort” shown in Figure III-14
of JP 5-0. Some processes are represented as
circular lines, (such as in Figure III-17 Phasing
Model). As an alternative, the following NPP
charts are examples of what Herbert Simon in his
Science of the Artificial referred to as “external
memory structures” to assist planners in
producing effective plans dealing with complex,
unstructured problems in highly dynamic
environments. Planners are like the architects
Simon describes as the prototypical designers
“in a semantically rich task domain”. For
architects, Simon explains, “The emerging
design is itself incorporated in a set of external
memory structures: sketches, floorplans,
drawings of utility systems, and so on. At each
stage in the design process, the partial design
reflected in these documents serves as a major
stimulus for suggesting to the designer what he
should attend to next. This direction to new
subgoals permits in turn new information to be
extracted from memory and reference sources
and another step to be taken toward the
development of the design.” Put in the language
of the Navy Planning Process, the diagrams
serve as planning process charts, on which the
significance of the orders, decision matrixes,
command and control diagrams, wargaming
result templates, briefs and others products
(external memory aids) are indicated as
navigation aids guiding the planning group
through the process. The process, unfolding
along a spiral, in which inputs, outputs, planning
team tasks and feedback continuously influence
and are influenced by activities and products
taking place above and below the level at which
the team is currently focused is respected on the
charts.
Complex and Complicated
5. Thangka as model
The diagrams thus function like the
thangka, ornate paintings of Buddhist
iconography from Nepal and Tibet.
Thangkas serve as references to guide
contemplative experience. (See figure
1). Similarly, the NPP charts are concept
maps of the planning process,
reminding Operational Planning Team
(OPT) members of the activities they
must accomplish, the inputs and
outputs associated with those activities,
feedback required and the steps above
and below each level of the process
which they must inform and be informed
by.
6. Two different functions
These charts function
differently for different
users. For those new to
the planning process
they can provide a
synoptic vision of each
step, informing detailed
study of the NWP 5-01.
Experienced planning
team members can use
the charts in two ways.
One, they can use the
charts to provide an
initial bearing
accelerating the
development of their
individual mental models
as they work together to
help the commander
unfold his or her
understanding in a way
that will enable the
dispersed units to
internalize the
Commander’s intent.
Two, the charts can serve the
planning team as an
awareness and
synchronization tool. The
charts, placed on the walls in
the planning space, enable
quick checks on the step in
the planning process that is
the current focus of
discussion, allow for
indication of taskings to
specific individuals, and chart
annotations indicate, for
example, potential
development of, completion of
or the need to re-examine a
specific activity. They also
provide the commander a
rapid insight into the status of
the planning effort – with a
glance the commander can
see where the OPT is in the
process and where his or her
immediate input is required.
Summary vision of each step Synchronization tool
7. The Navy Planning Process as
an exercise in sense making
Figure 2 portrays the
Navy Planning Process as
an exercise in
sensemaking through
cultivating understanding
among the commander,
the staff, and the
superiors and
subordinates of that staff
in order to enable
effective command in
highly dynamic
environments. The chart
portrays the steps of the
planning process
(Mission Analysis, Course
of Action Development,
Course of Action Analysis
(wargaming), Course of
Action Comparison and
Decision, Plan or Order
Development, and
Transition) as ascending
in a conical helix. Gains in
understanding appear as
increases in elevation and
the expanding diameter
of the spiral indicates a
broader and broader
grasp of the dynamic
environment and actors
within that environment.
8. 1. Mission Analysis
3. Course of Action Analysis (Wargaming)
6.Transition
4. Course of Action Comparison and Decision
5. Plan or Order Development
2. Course of Action Development
Understanding
N a v y P l a n n i n g P r o c e s s
9. 0
3
2
1
FeedbackInputs
Tasks
O u t p u t s
N a v y P l a n n i n g P r o c e s s
+ Progress
+Time+ Products
+ Understanding
Missio
n
Analys
is
Design
Course of
Action
Development
Course of
Action
Comparison
and Decision Wargaming
Plan or Order
Development Transition
4
5 6
1. Mission
Analysis
2.Courseof Action
Development
3.CourseofAction
Analysis
(Wargaming)
4. Course of
Action
Comparison and
Decision
5.Planor
Order
Development
6. Transition
10. The Hermeneutic Spiral
Figure 3 is a simplification
of Figure 2. The conical
helix becomes an
Archimedean spiral to
better show the
relationships between the
inputs, tasks, outputs and
feedback components of
the process, and the
production costs in time
and attention as compared
to the products and
understanding the process
yields. This view illustrates
that, for example, the
application of design
pushes the understanding
curve to the left, providing a
jump start in understanding
at a low cost in time and
attention. The charts also
help make planners aware
of the potential tradeoffs
among time, attention,
products and
understanding by offering a
visual way to think through
alternatives that can
generate the required
outputs while
compensating for an
externally imposed
reduction in, for example,
the time available to
produce the plans, as often
happens in crisis action
planning.
11. 0
3
2
1
FeedbackInputs
Tasks
O u t p u t s
N a v y P l a n n i n g P r o c e s s
+Progress
+Time
+
Products
+ Understanding
Mission
Analysis
Design
Course of
Action
Development
Course of
Action
Comparison
and Decision Wargaming
Plan or Order
Development Transition
4
5 6
1. Mission Analysis
2.Courseof Action
Development
3.Courseof
Action
Analysis
(Wargaming)
4. Course of Action
Comparison and
Decision
5.PlanorOrder
Development
6. Transition
12. Reading the External
Memory Structures
Figure 4 provides guidance on how to
read the following charts. The charts are
divided into four sectors and flow
clockwise, starting from the upper left
Inputs section, through the Tasks, to
Outputs to Feedback. The Outputs are
enriched by Feedback, from both the
commander and staff elements like the
Assessment cell, prior to become Inputs
for the next higher phase of the
planning cycle. Each chart sector is
read from top to bottom. This entails that
products at the lower left hand corner of
the chart are the product of both the
Output and Feedback processes.
13. FeedbackInputs
Tasks
O u t p u t s
Mission Analysis
Briefing
WARNORD
Design products
Environmental understanding
Wicked, complex problem definition
Operational approach
Commander
Initial Planning
Guidance
Initial Commander’s
intent
Design products
Understand Commander’s mind
Review commander’s initial planning guidance
Analyze higher commander’s mission and intent
Develop proposed updates to commander’s intent and
critical information requirements
Understand Self (own forces and partners)
Identify command relationships
Analyze available forces and assets
Determine friendly COG and decisive points
Conduct initial risk assessment
Understand Mission
Identify sources of mission
Determine specified, implied, essential tasks
State operation purpose
Identify facts and develop planning assumptions
Develop proposed mission statement
Commander’s comments on Mission Analysis Briefing
Mission statement
Commander's intent
Commander’s planning guidance
Updated initial staff estimates
M i s s i o n A n a l y s i s
+
Attention
Understand Environment
Receive IPOE brief
Identify externally imposed limitations
Determine critical factors and decisive points
Conduct initial risk assessment
+Time
+
Products
+ Understanding
Staff
Initial staff
estimates
Higher
Headquarters
Plans, orders and
guidance
Intelligence
products
Staff Estimates
Commander’s
Critical Information Requirements
Subordinate’s and superior’s feedback on WARNORD
Assessment Team input on fit
between WARNORD and environment
1. Mission Analysis
2.Courseof Action
Development
3.Courseof
Action
Analysis
(Wargaming)
4. Course of Action
Comparison and
Decision
5.PlanorOrder
Development
6. Transition
1. Mission
Analysis
2.Courseof
Action
Development
3.CourseofAction
Analysis
(Wargaming)
4. Course of Action
Comparison and Decision
5.PlanorOrder
Development
6. Transition
Start Here
Read Down
14. Uroboros
The stylized uroboros (placed at an
angle to show the gain in understanding
elevation) in the upper right corner
indicates the step of the planning
process the chart portrays, and the
uroboros in the lower left indicates the
next step to which the planning team
transitions after incorporating the
feedback into that step’s products.
These smaller diagrams within the chart
serve as reminders that the planning
process is a dynamical system step
function, in which outputs become
inputs for the next step, leading to an
ascent of the conical planning process
helix.
1. Mission Analysis
2.Courseof Action
Development
3.CourseofAction
Analysis
(Wargaming)
4. Course of Action
Comparison and Decision
5.PlanorOrder
Development
6. Transition
15. The Charts
The following charts expand each of the
six planning process steps in order to
better display the relationship between
the various planning team activities.
16. FeedbackInputs
Tasks
O u t p u t s
Mission Analysis
Briefing
WARNORD
Design products
Environmental understanding
Wicked, complex problem definition
Operational approach
Commander
Initial Planning
Guidance
Initial Commander’s
intent
Design products
Understand Commander’s mind
Review commander’s initial planning guidance
Analyze higher commander’s mission and intent
Develop proposed updates to commander’s intent and
critical information requirements
Understand Self (own forces and partners)
Identify command relationships
Analyze available forces and assets
Determine friendly COG and decisive points
Conduct initial risk assessment
Understand Mission
Identify sources of mission
Determine specified, implied, essential tasks
State operation purpose
Identify facts and develop planning assumptions
Develop proposed mission statement
Commander’s comments on Mission Analysis Briefing
Mission statement
Commander's intent
Commander’s planning guidance
Updated initial staff estimates
M i s s i o n A n a l y s i s
Understand Environment
Receive IPOE brief
Identify externally imposed limitations
Determine critical factors and decisive points
Conduct initial risk assessment
Staff
Initial staff
estimates
Higher
Headquarters
Plans, orders and
guidance
Intelligence
products
Staff Estimates
Commander’s
Critical Information Requirements
Subordinate’s and superior’s feedback on WARNORD
Assessment Team input on fit
between WARNORD and environment
1. Mission
Analysis
2.Courseof
Action
Development
3.Courseof
Action
Analysis
(Wargaming)
4. Course of Action
Comparison and
Decision
5.PlanorOrder
Development
6. Transition
1. Mission Analysis
2.Courseof Action
Development
3.CourseofAction
Analysis
(Wargaming)
4. Course of Action
Comparison and
Decision
5.PlanorOrder
Development
6.
Transition
17. FeedbackInputs
Tasks
O u t p u t s
COA Briefing
Update
IPOE
Staff Estimates
Commander
Mission statement and
commander’s intent
Commander’s planning
guidance and
governing
factors
Compare self and other
Analyze relative combat power
Recommend Command and Control Relationships
COA analysis and
evaluation
criteria
(to inform
wargaming)
COA Sketches and
Statements
Commander’s approval of
COAs or direction to revise
C o u r s e o f A c t i o n D e v e l o p m e n t
Create Options for Commander
Formulate COA options
Staff
Adversary COAs
Higher
Headquarters
WARNORD
OPORD
Initial Operational
Assessment
Commander’s Intent
Staff Estimates
Risk Assessment
Refine
RFF/FRCs
Supplemental
ROE
1. Mission Analysis
2.Courseof
Action
Development
3.Courseof
Action
Analysis
(Wargaming)
4. Course of Action
Comparison and
Decision
5.Planor
Order
Development
6. Transition
1. Mission
Analysis
2.Courseof
Action
Development
3.Courseof
Action
Analysis
(Wargaming)
4. Course of Action
Comparison and
Decision
5.PlanorOrder
Development
6. Transition
TestforValidity
COA 1
COA 2
COA 3
18. FeedbackInputs
Tasks
O u t p u t s
Wargame refined
COAs
Commander
Refined commander’s intent
Wargaming guidance
Approved COAs
Refined Adversary COAs
Evaluation criteria and
critical events
Update
IPOE
Staff
Estimates
Wargame Preparation
Organize for wargame
List all friendly forces
Review assumptions
List known critical events
Select wargame method
Select method to record and display results
Initial Decision Support
Template/Decision
Support Matrix
Conduct Wargame
C o u r s e o f A c t i o n A n a l y s i s ( Wa r g a m i n g )
Wargame
records
(draft synch
matrix)Assess results
Conduct risk assessment
and mitigation
Refine
1. Mission
Analysis
2.Courseof Action
Development
3.Courseof
Action
Analysis
(Wargaming)
4. Course of Action
Comparison and Decision
5.PlanorOrder
Development
6. Transition
Critical events
and decision
points
Branches and
sequels for
development
Evaluation Criteria
Wargame Staff
Estimates
1. Mission
Analysis
2.Courseof
Action
Development
3.Courseof
Action
Analysis
(Wargaming)
4. Course of Action
Comparison and
Decision
5.PlanorOrder
Development
6. Transition
Most Dangerous
Most Likely
COA 1
COA 2
COA 3
COA 1
COA 2
COA 3
19. FeedbackInputs
Tasks
O u t p u t s
WARNORD
CONOPS
Update
IPOE
Staff
Estimates
Present
Staff estimates, risk, assessments
Final validity
test
COA Decision
Course of Action Comparison and Decision
COA Review
1. Mission
Analysis
2.Courseof Action
Development
3.CourseofAction
Analysis
(Wargaming)
4. Course of Action
Comparison and Decision
5.PlanorOrder
Development
6. Transition
DST/DSM
Synch matrix
Staff
COA Wargame
worksheet
COA sketch and
narrative
Decision Support Matrix
Evaluation Criteria
-Governing Factors
-Weighting criteria
Proposed risk
controls
Perform
COA Comparison
Summarize
Advantages & Disadvantages
1. Mission
Analysis
2.Courseof Action
Development
3.CourseofAction
Analysis
(Wargaming)
4. Course of Action
Comparison and Decision
5.PlanorOrder
Development
6. Transition
20. FeedbackInputs
Tasks
O u t p u t sIssued Plan or Order
Prepare
Plan or Order
Planning
Support Tools
Commander Approves
Order
Plan or Order Development
Updated
OPGENs,
OPTASKs,
Supplements
1. Mission Analysis 2.Courseof
Action
Development
3.Courseof
Action
Analysis
(Wargaming)
4. Course of
Action
Comparison and
Decision
5.Planor
Order
Development
6.
Transition
Operational
Assessment
Guidance
Staff
Task organization
CONOPS
Staff Estimates
Synchronization matrix
Operational Assessment
OPGENs
OPTASKs
supplements
Reconcile
Plan or
Order
Crosswalk and Update
supporting operational directives(OPGENs, OPTASKs, and supplements)
Commander
Mission
Statement
Commander’s
Intent
Crosswalk
Plan or
Order
Refine
IPOE
Staff Estimates
1. Mission
Analysis
2.Courseof Action
Development
3.CourseofAction
Analysis
(Wargaming)
4. Course of Action
Comparison and Decision
5.PlanorOrder
Development
6. Transition
21. FeedbackInputs
Tasks
O u t p u t s
Prepare
Transition Briefing
Transition Drills
Confirmation briefing
Subordinate commanders and
staff prepared to:
Execute the order and possible
branches
Plan sequels
Confirmation Briefing
T r a n s i t i o n
1. Mission
Analysis
2.Courseof Action
Development
3.Courseof
Action
Analysis
(Wargaming)
4. Course of Action
Comparison and
Decision
5.PlanorOrder
Development
6. Transition
Running
estimates
developed
Staff
Refined IPOE
Outline FRAGORDs for branches
Information for future missions/sequels
Staff Estimates
Assessment Framework
OPGENs, OPTASKs, supplements
CONOPS
Synchronization matrix
Decision Support Matrix
Decision Support Template
Commander
Approved
OPORD/OPLAN
Refine
Operational
Assessment
Guidance
Transition Briefing
Shared
Understanding
22. ”Naval Planning NWP 5-01." edited by
Office of the Chief of Naval Operations.
Norfolk, VA: Navy Warfare Development
Command, 2013.
Simon, Herbert A. The Sciences of the
Artificial. Third ed. Cambridge: MIT
Press, 1996.
Staff, The Joint. Joint Publication (JP)
5-0 Joint Operation Planning.
Washington DC, 2011.
References
23. Michael Hallett
Website Email
For more information about applications of the Navy Planning Process to military or
business issues, please contact me.
Thank you