Download as PDF, PPTX

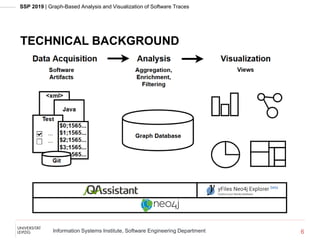
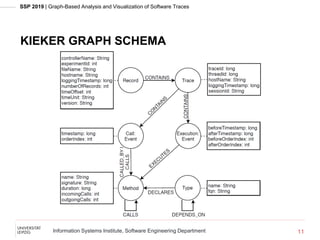
![SSP 2019 | Graph-Based Analysis and Visualization of Software Traces
Information Systems Institute, Software Engineering Department
WHY GRAPHS?
2
[Diehl and Telea 2014, Müller et al. 2018]
Software data naturally map to a multivariate,
compound, attributed, and time-dependent graph](https://image.slidesharecdn.com/ssp2019-graph-basedanalysisandvisualizationofsoftwaretraces-191105113623/85/Graph-Based-Analysis-and-Visualization-of-Software-Traces-SSP-2019-2-320.jpg)
![SSP 2019 | Graph-Based Analysis and Visualization of Software Traces
Information Systems Institute, Software Engineering Department
KIEKER
Framework to monitor, analyze, and visualize software
behavior
Supports event-based and state-based monitoring
Usable with Java, .NET, COBOL, and Visual Basic 6
Provides tools
to inspect and analyze traces
to visualize them as UML sequence diagrams, markov
chains, dependency graphs, and trace timing diagrams
Output writers save traces to the file system or in a
relational database
3
[van Hoorn, Waller, and Hasselbring 2012; Waller 2014; http://kieker-monitoring.net]](https://image.slidesharecdn.com/ssp2019-graph-basedanalysisandvisualizationofsoftwaretraces-191105113623/85/Graph-Based-Analysis-and-Visualization-of-Software-Traces-SSP-2019-3-320.jpg)
![SSP 2019 | Graph-Based Analysis and Visualization of Software Traces
Information Systems Institute, Software Engineering Department
NEO4J
Native graph database to store, manage, and query
large amounts of connected data
Models graph data with a labeled property graph
Labels are used to classify nodes
Relationships connect nodes, have a type, and can have a
direction
Properties are attributes of nodes and relationships and
stored as key-value pairs
7
[Needham and Hodler 2019; https://neo4j.com]](https://image.slidesharecdn.com/ssp2019-graph-basedanalysisandvisualizationofsoftwaretraces-191105113623/85/Graph-Based-Analysis-and-Visualization-of-Software-Traces-SSP-2019-7-320.jpg)
![SSP 2019 | Graph-Based Analysis and Visualization of Software Traces
Information Systems Institute, Software Engineering Department
CYPHER
Graph query language of Neo4j
Matches given patterns in the graph using a visual,
ASCII art-based syntax
( ) node
-[ ]-> directed relationship
MATCH
(m1:Method)-[CALLS]->(m2:Method)
RETURN
m1.name, m2.name
8
[Francis et al. 2018; https://www.opencypher.org]](https://image.slidesharecdn.com/ssp2019-graph-basedanalysisandvisualizationofsoftwaretraces-191105113623/85/Graph-Based-Analysis-and-Visualization-of-Software-Traces-SSP-2019-8-320.jpg)
![SSP 2019 | Graph-Based Analysis and Visualization of Software Traces
Information Systems Institute, Software Engineering Department
JQASSISTANT
9
Scans software artifacts and stores
them in a Neo4j graph database
Analyzes and modifies the graph
data with rules
Constraints to identify violations
Concepts to aggregate, enrich,
and filter
Create reports
[https://jqassistant.org; https://softvis-research.github.io/jqassistant-plugins]
Can be executed with Maven or from the command line
Extendable through plugins, for example, Java, Jira, GitHub-
Issues, JaCoCo scanner](https://image.slidesharecdn.com/ssp2019-graph-basedanalysisandvisualizationofsoftwaretraces-191105113623/85/Graph-Based-Analysis-and-Visualization-of-Software-Traces-SSP-2019-9-320.jpg)
![SSP 2019 | Graph-Based Analysis and Visualization of Software Traces
Information Systems Institute, Software Engineering Department
KIEKER PLUGIN
Plugin for jQAssistant to scan and analyze event-based
software traces
Published on GitHub under GPL-3.0
10
[https://github.com/softvis-research/jqa-kieker-plugin]](https://image.slidesharecdn.com/ssp2019-graph-basedanalysisandvisualizationofsoftwaretraces-191105113623/85/Graph-Based-Analysis-and-Visualization-of-Software-Traces-SSP-2019-10-320.jpg)
![SSP 2019 | Graph-Based Analysis and Visualization of Software Traces
Information Systems Institute, Software Engineering Department
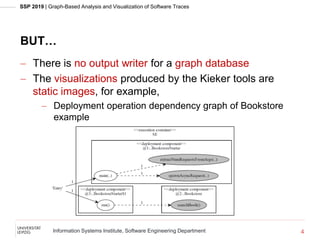
APPLICATION EXAMPLE
12
[http://kieker-monitoring.net/documentation]
Instrumented the Bookstore
example from the Kieker user
guide with AspectJ and activated
aspects OperationExecution
and OperationCall
Scanned the monitored traces
with the jQAssistant command
line tool using the Kieker plugin](https://image.slidesharecdn.com/ssp2019-graph-basedanalysisandvisualizationofsoftwaretraces-191105113623/85/Graph-Based-Analysis-and-Visualization-of-Software-Traces-SSP-2019-12-320.jpg)
![SSP 2019 | Graph-Based Analysis and Visualization of Software Traces
Information Systems Institute, Software Engineering Department
ANALYSIS
13
MATCH
(t:Type)-[:DECLARES]->(m:Method)
WHERE
t.fqn STARTS WITH "kieker"
RETURN
t.name as Type, m.name AS Method, m.incomingCalls AS
Calls, m.duration AS Duration ORDER BY Duration DESC](https://image.slidesharecdn.com/ssp2019-graph-basedanalysisandvisualizationofsoftwaretraces-191105113623/85/Graph-Based-Analysis-and-Visualization-of-Software-Traces-SSP-2019-13-320.jpg)
![SSP 2019 | Graph-Based Analysis and Visualization of Software Traces
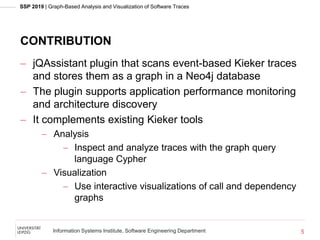
Information Systems Institute, Software Engineering Department
CALL GRAPH
14
[https://www.yworks.com/neo4j-explorer]
The property duration of each Method node is mapped to a color gradient
from green (short) to red (long)](https://image.slidesharecdn.com/ssp2019-graph-basedanalysisandvisualizationofsoftwaretraces-191105113623/85/Graph-Based-Analysis-and-Visualization-of-Software-Traces-SSP-2019-14-320.jpg)
![SSP 2019 | Graph-Based Analysis and Visualization of Software Traces
Information Systems Institute, Software Engineering Department
DEPENDENCY GRAPH
15
[https://www.yworks.com/neo4j-explorer]](https://image.slidesharecdn.com/ssp2019-graph-basedanalysisandvisualizationofsoftwaretraces-191105113623/85/Graph-Based-Analysis-and-Visualization-of-Software-Traces-SSP-2019-15-320.jpg)


The document presents a jqassistant plugin that scans event-based Kieker traces and stores them as graphs in a Neo4j database, enhancing software performance monitoring and architecture discovery. It highlights the technical aspects of Neo4j and Cypher as well as the capabilities of the Kieker framework for visualizing software behavior. An application example is provided using a bookstore scenario to illustrate the plugin's effectiveness and potential for future development.

![Graph-Based Performance Analysis at System- and Application-Level [SSP 2020]](https://cdn.slidesharecdn.com/ss_thumbnails/ssp2020graph-basedperformanceanalysisatsystem-andapplication-level-201113101020-thumbnail.jpg?width=640&height=640&fit=bounds)