Downloaded 11 times


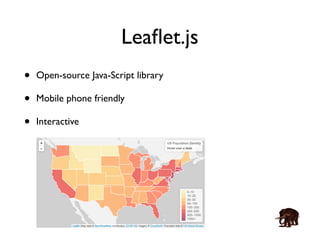
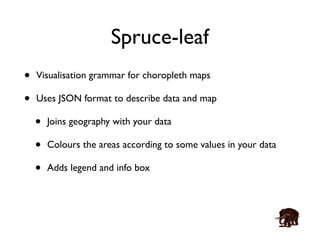
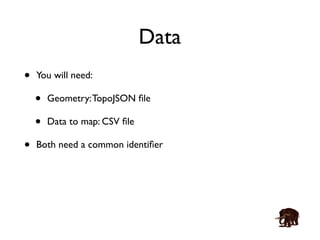
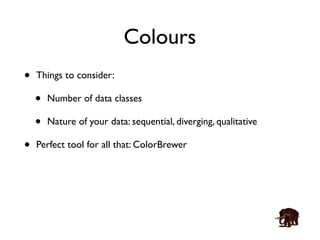

The document discusses tools for visualizing data on interactive maps using technologies like leaflet.js and spruce-leaf, emphasizing their open-source nature and mobile compatibility. It highlights the need for a common identifier between geographic data and CSV data for effective mapping, along with considerations for color selection based on data type. Additional resources, including links to tools and examples, are provided for further exploration.