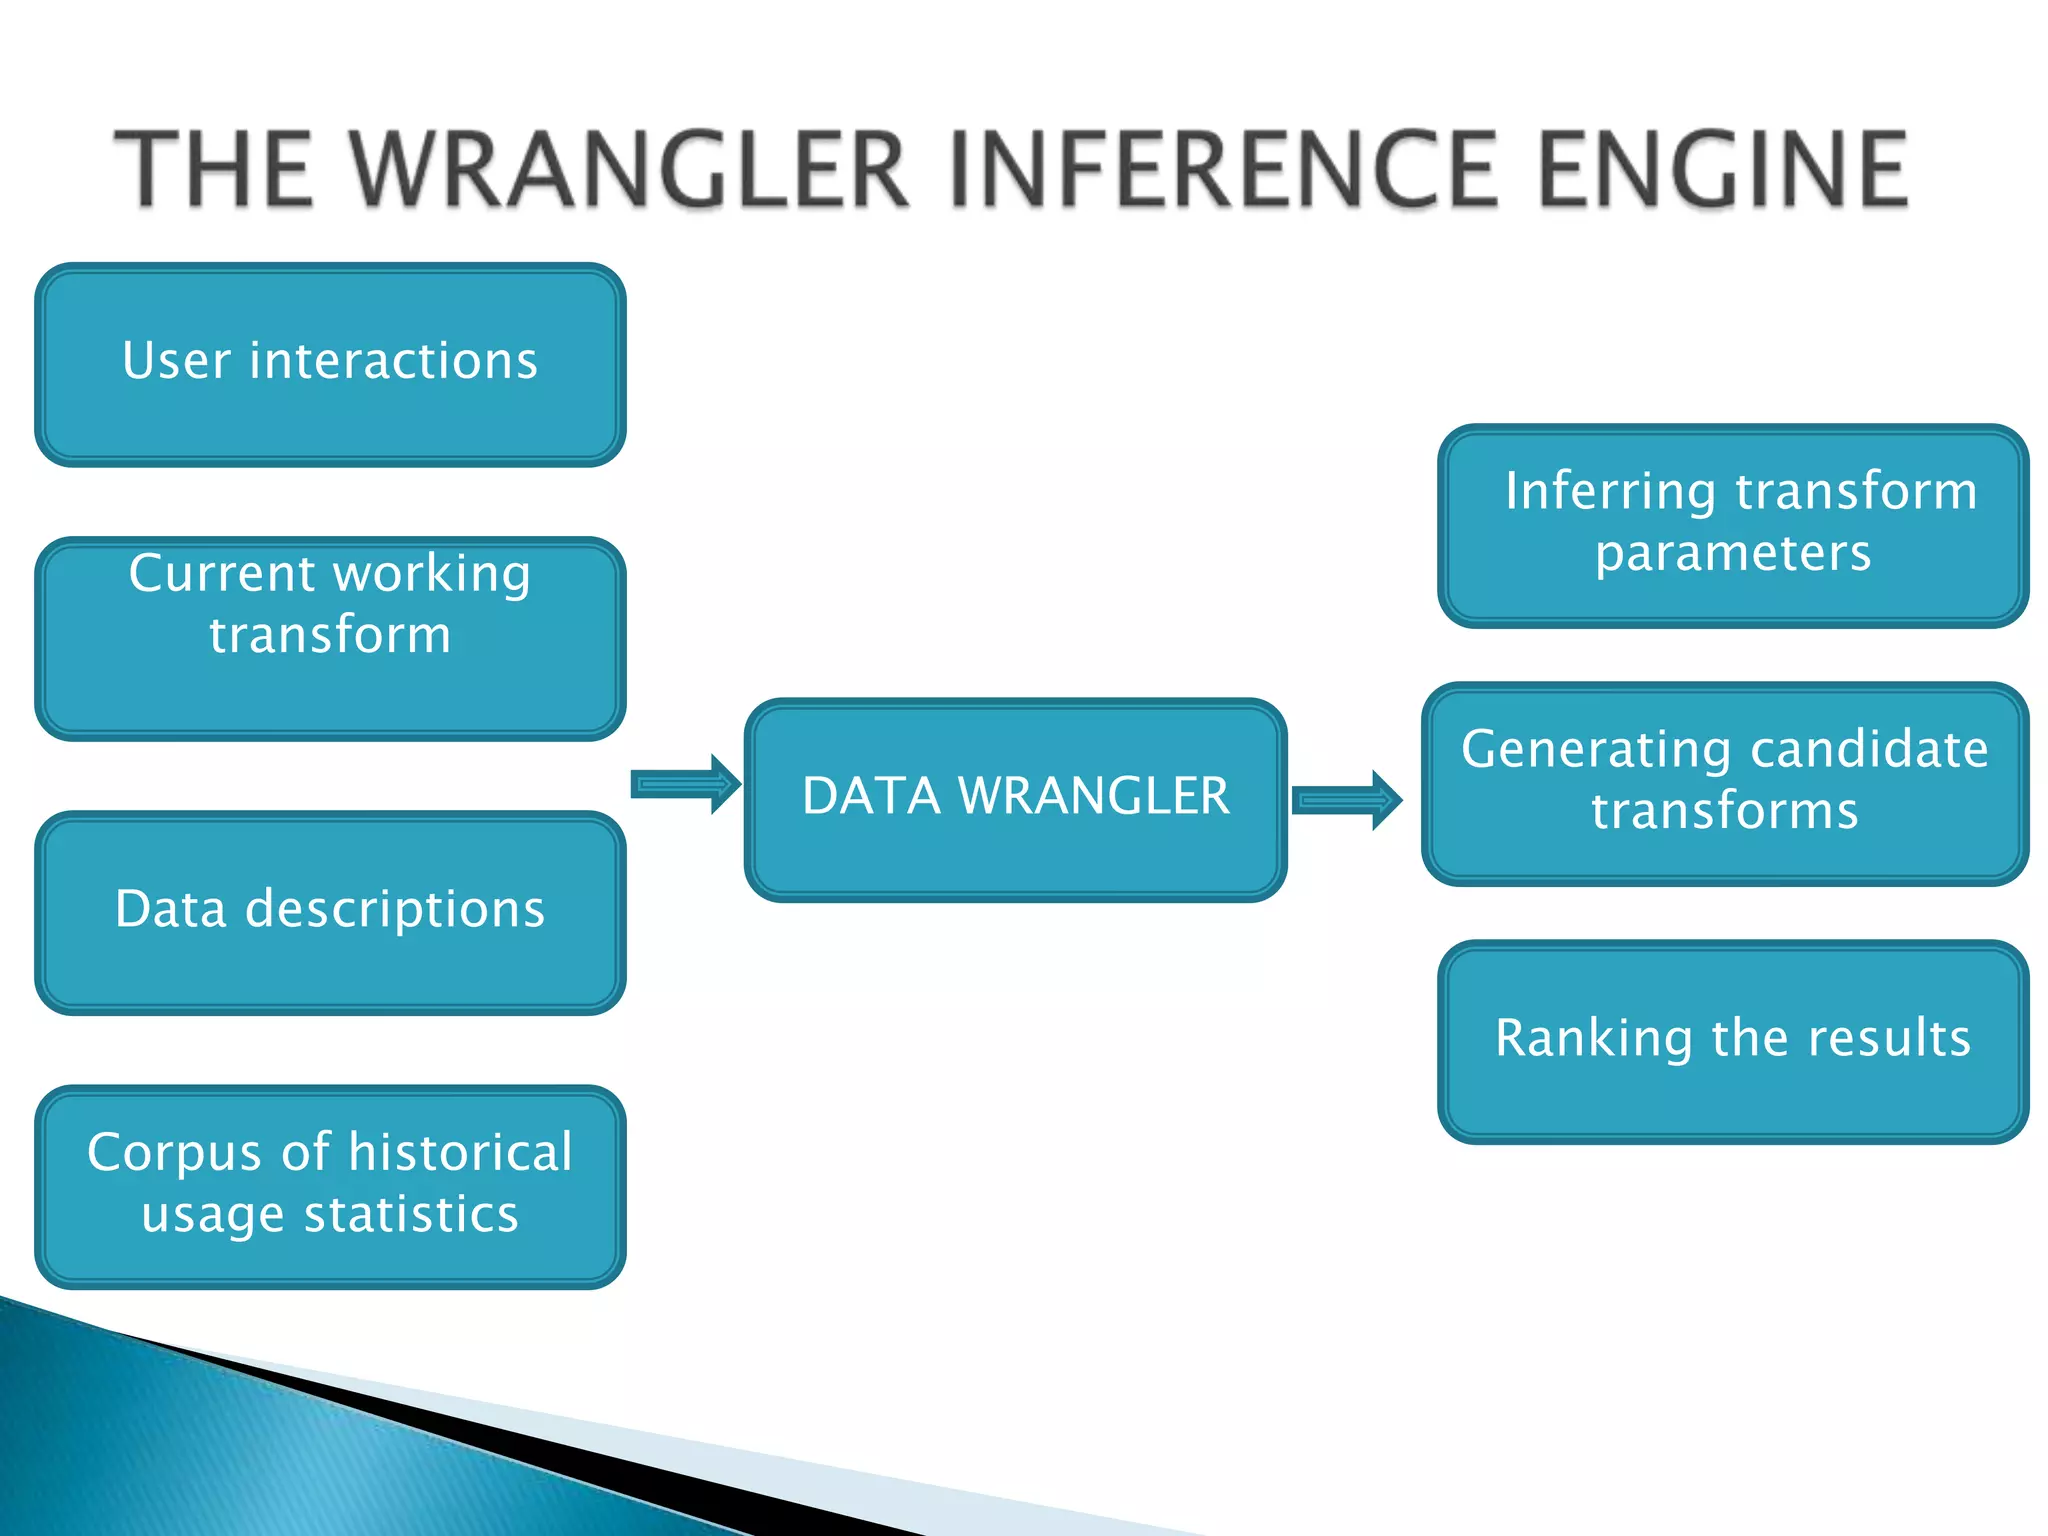
2. an interactive data transformation tool
developed by the Stanford Visualization
Group.
allows direct manipulation of visual data
provides automatic suggestions for relevant
transformations
used in activities like reformatting data values
and formats, integrating data from multiple
sources, missing values etc
use of Wrangler reduces the specification
time significantly
3. When the user selects any data, applicable transformations are
suggested by the tool based on the current context of interaction
Data wrangler uses a modeling technique to enumerate and rate the
possible transformations
This model combines user's inputs with diversity, frequency and
specification difficulty of applicable transform types
Wrangler provides short natural language descriptions of the
transforms and also provides the visual previews of the transform
results
This helps analysts to assess the viable transforms quickly
Wrangler's interactive history viewer records and shows the step of
transforms applied on the data set so as to facilitate reuse.
Wrangler scripts can be run in a web browser using JavaScript or
Python code
4. underlying declarative data transformation language
language consists of 8 classes of transformations
◦ Map
One to zero
One to One
One to Many
◦ Look ups and Joins
◦ Reshape
Fold
unfold
◦ Positional
Fill
Lag
◦ Sorting
◦ Aggregation
◦ Key Generation
◦ Schema Transforms
5. This is the example data available with data
wrangler.
House crime data from the U.S. Bureau of
Justice Statistics
Csv format data
6. User interactions
Inferring transform
Current working parameters
transform
Generating candidate
DATA WRANGLER transforms
Data descriptions
Ranking the results
Corpus of historical
usage statistics
7. GETTING STARTED
◦ Browser based tool: http://vis.stanford.edu/wrangler/
DATA ENTRY
◦ copy and paste the data to be wrangled into the input window.
◦ Input format : csv files, tsv files and manual entry
TRANSFORMS
• Cut • Merge
• Delete • Promote
• Drop • Split
• Edit • Translate
• Extract • Transpose
• Fill • Unfold
• Fold
OUTPUT
Two types of outputs:
◦ Data Output.xlsx
Csv, tsv, row oriented JSON, column oriented JSON, look up tables
◦ Script
Python, java script
8. helps to speed up the process of data
manipulation
helps managers to spend more time analyzing
and learning from their data rather than
spending much of the time just rearranging it
allows interactive transformation of messy, real-
world data and export data for use in
Excel, R, Tableau, Protovis etc
LIMITATION: data containing more than 40
columns and 1000 rows cannot be wrangled