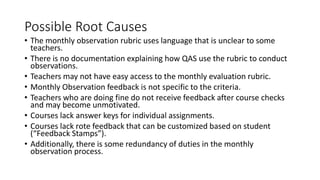
Teacher Support in a Virtual School
Analysis Results
Prepared by: Cassandra Gaul
May 2, 2016
Performance Analysis
Problem Analysis
• Discover
needs, gaps,
opportunities
• Determine
distinguishing
characteristics
between
groups
Cause Analysis
• Uncover root
problems
• Determine
leading factors
Interventions
• Prioritize
impact
• Begin with
least costly
Problem Analysis
Goals Data Collection
1. To discover teachers’ perceptions of the administration,
knowledge of support systems, and opinion of the evaluation
system.
2. To discover distinguishing trends between the behaviors and
characteristics of teachers who report “Exceeds” on summative
evaluations and those who report “Needs Attention.”
3. To discover how ASIs and ILTs interact with teachers and how
they identify, support, and communicate with teachers
identified as needing attention.
4. To discover potential weaknesses, needs, and opportunities of
the teacher evaluation process.
• Surveys: Teacher Support
Survey, ASI Feedback Survey,
ILT Feedback Survey
• TQ Interviews
• Document Review:
Eduphoria, Monthly
Observation Rubric,
Description of Duties
Problem Analysis Results
The Teacher Support
Survey showed teachers
overwhelmingly had a
positive perception of
both ASIs and ILTs.
Figure 1
When asking for help, teachers are more likely to “go up the chain of command,” by asking
the ILT first. Figures 2 and 3 show the topics teachers communicate with their supervisors.
policy
25%
departmental/
curriculum
17%
student issues
22%
parents
5%
other*
31%
Topics Teachers ask ILTs
Figure 2: *other includes topics with
5% or less representation.
policy
19%
student situation
17%
department/
curricular
10%
no contact
10%
parent/student
16%
unique situation
8%
grade reporting/
student enrollment
8% technical
7%
other*
5%
Topics Teachers ask ASIs
Figure 3: *other includes topics with 5%
or less representation.
Teachers and ILT and ASI communication
Time constraints
There does not seem to be a correlation between time spent on duties and professional
development attendance, tasks that take the most time to complete, and their evaluation
score. Figure 4 shows what duties take the most of teachers’ time.
0%
10%
20%
30%
40%
50%
60%
70%
80%
90%
Grades Communication Preparation Feedback Development
PercentageofResponses
Reported Duties
Time Consuming Teaching Duties
Professional Development
The survey showed many teachers attend live
professional development offerings or watch the
recording. Although more teachers who self-reported as
“Exceeds” or “Meets” attend professional development,
there did not seem to be a consistent trend (see Table
1).
Table 1: Professional Development Teacher Attendance by Evaluation
Score
General Comments about PD
• Teachers attend for ideas, skills, current
information
• “sometime they provide affirmation that I
have also done a good job in that area.”
• “I am new and I need to learn everything I
can to do a better job! “
• “Many are helpful, some are redundant.
But you never know unless you go.”
• Time constraints prevent teachers from
attending live.
• Teachers report a direct connection
between PD and improving their online
teaching skills.
• Many who reported no did say they
watched the recordings.
Recommendations
• Offer during working hours.
• Cover topics related to data and new tools.
• "ePortfolio presented again and again is not helpful."
• "Wish some of these were offered in the a.m."
Perception of the evaluation system
0
5
10
15
20
25
Strongly Agree Agree Neutral Disagree Strongly Disagree
TeacherCount
"The feedback in my monthly and summative evaluations gives me valuable information on how to
improve."
Teachers' Perception of the Evaluation Feedback's Value
Exceeds Meets Neets Attention
Survey results show 75% of the
respondents agreed or strongly
agreed with the statement, “The
feedback in my monthly and
summative evaluations gives me
valuable information on how to
improve.”
However, there is a correlation
between the evaluation score and
their response (see Figure 5).
Figure 5
0
5
10
15
20
25
30
Strongly Agree Agree Neutral Disagree Strongly Disagree
TeacherCount
"The monthly and summative evaluations accurately depict my performance."
Teachers' Perception of the Accuracy of Evaluations
Exceeds Meets Neets Attention
Responses to the
statement, “The
monthly and
summative
evaluations accurately
depict my
performance” follow
the same trend (see
Figure 6).
75% of the total
respondents agreed
or strongly agreed.
Figure 6
Cause Analysis
Leading factors affecting performance were analyzed by six categories:
• Expectations – Do teachers know what to do?
• Feedback – Do teachers have the feedback they need?
• Environment/ Tools – Do teachers have the tools and resources?
• Incentives – What is in place to motivate teachers?
• Organizational Support – Does the school support teachers’ improvement?
• Skills and Knowledge – If their life depended on it, could they perform?
These categories correspond to the suggested interventions, and they go
from the least time consuming to the most time consuming.
Factors in place Factors not in place
Expectations - QAS present at JIT and faculty meetings
- Emailed links to evaluations
- Some teachers found the rubric language unclear
- No documentation describing how QAS use the rubric
Feedback - Monthly observation feedback
- QAS, ILT, and ASI email alerts
- Teachers who are doing fine do not receive feedback after
course checks.
- QAS feedback is categorical but may not address individual
criteria.
Environment
/Tools
- ASIs and ILTs offer help
- TQ supports: newsletters, PD
- Rubrics for grading
- OneNote Department notebooks
- Courses lack answer keys for individual assignments.
- Courses lack rote feedback that can be customized based on
student (“Feedback Stamps”).
Incentives - Invited to share at PD
- OneNote Department notebooks recognize
best practices
- Presenting at professional development is more work for
teachers who may not have the time.
- Best practices do not necessarily correlate with improved
student performance, attendance, or engagement with the
course.
Organizational
Support
- Support systems: strategies, tips, resources,
teacher-pairs, Teacher Quality, PD, newsletters,
and mentoring.
- OneNote Department notebooks depend on organizational
guidance and support
Skills and
Knowledge
- Teachers can perform all assigned duties.
- Teachers know what support systems are in
place to help them.
- Teachers may not know the best process to complete a task.
Possible Root Causes
• The monthly observation rubric uses language that is unclear to some
teachers.
• There is no documentation explaining how QAS use the rubric to conduct
observations.
• Teachers may not have easy access to the monthly evaluation rubric.
• Monthly Observation feedback is not specific to the criteria.
• Teachers who are doing fine do not receive feedback after course checks
and may become unmotivated.
• Courses lack answer keys for individual assignments.
• Courses lack rote feedback that can be customized based on student
(“Feedback Stamps”).
• Additionally, there is some redundancy of duties in the monthly
observation process.
Suggested Interventions
Interventions were selected based on the three criteria: the likelihood of
stakeholder buy-in, the most impact, and ease of implementation.
• Provide labeled screenshots of examples for Meets and Exceeds criteria.
• Create an annotated Observation Rubric depicting how monthly observations are conducted.
Upload the document to Eduphoria and add a link to the Teacher Handbook.
• Upload the current monthly evaluation rubric under “Resources” in Eduphoria.
• Modify the observation rubric so each criteria is a checkbox.
• ASIs and ILTs could send feedback to all teachers after conducting a course check. Exceptional
examples of best practices could be featured in newsletters or in the new OneNote Departmental
notebook.
• Upload answer keys to the course page in the OneNote Departmental notebook.
• Provide “Feedback Stamps” in the course files.
• Revise the process for conducting course checks and spot checks among ASIs, ILTs, and QAS.
Questions?
A thorough description of the analysis and an intervention
implementation plan is in the Teacher Support Report

Virtual Teacher Support Analysis

  • 1.
    Teacher Support ina Virtual School Analysis Results Prepared by: Cassandra Gaul May 2, 2016
  • 2.
    Performance Analysis Problem Analysis •Discover needs, gaps, opportunities • Determine distinguishing characteristics between groups Cause Analysis • Uncover root problems • Determine leading factors Interventions • Prioritize impact • Begin with least costly
  • 3.
    Problem Analysis Goals DataCollection 1. To discover teachers’ perceptions of the administration, knowledge of support systems, and opinion of the evaluation system. 2. To discover distinguishing trends between the behaviors and characteristics of teachers who report “Exceeds” on summative evaluations and those who report “Needs Attention.” 3. To discover how ASIs and ILTs interact with teachers and how they identify, support, and communicate with teachers identified as needing attention. 4. To discover potential weaknesses, needs, and opportunities of the teacher evaluation process. • Surveys: Teacher Support Survey, ASI Feedback Survey, ILT Feedback Survey • TQ Interviews • Document Review: Eduphoria, Monthly Observation Rubric, Description of Duties
  • 4.
    Problem Analysis Results TheTeacher Support Survey showed teachers overwhelmingly had a positive perception of both ASIs and ILTs. Figure 1
  • 5.
    When asking forhelp, teachers are more likely to “go up the chain of command,” by asking the ILT first. Figures 2 and 3 show the topics teachers communicate with their supervisors. policy 25% departmental/ curriculum 17% student issues 22% parents 5% other* 31% Topics Teachers ask ILTs Figure 2: *other includes topics with 5% or less representation. policy 19% student situation 17% department/ curricular 10% no contact 10% parent/student 16% unique situation 8% grade reporting/ student enrollment 8% technical 7% other* 5% Topics Teachers ask ASIs Figure 3: *other includes topics with 5% or less representation. Teachers and ILT and ASI communication
  • 6.
    Time constraints There doesnot seem to be a correlation between time spent on duties and professional development attendance, tasks that take the most time to complete, and their evaluation score. Figure 4 shows what duties take the most of teachers’ time. 0% 10% 20% 30% 40% 50% 60% 70% 80% 90% Grades Communication Preparation Feedback Development PercentageofResponses Reported Duties Time Consuming Teaching Duties
  • 7.
    Professional Development The surveyshowed many teachers attend live professional development offerings or watch the recording. Although more teachers who self-reported as “Exceeds” or “Meets” attend professional development, there did not seem to be a consistent trend (see Table 1). Table 1: Professional Development Teacher Attendance by Evaluation Score General Comments about PD • Teachers attend for ideas, skills, current information • “sometime they provide affirmation that I have also done a good job in that area.” • “I am new and I need to learn everything I can to do a better job! “ • “Many are helpful, some are redundant. But you never know unless you go.” • Time constraints prevent teachers from attending live. • Teachers report a direct connection between PD and improving their online teaching skills. • Many who reported no did say they watched the recordings. Recommendations • Offer during working hours. • Cover topics related to data and new tools. • "ePortfolio presented again and again is not helpful." • "Wish some of these were offered in the a.m."
  • 8.
    Perception of theevaluation system 0 5 10 15 20 25 Strongly Agree Agree Neutral Disagree Strongly Disagree TeacherCount "The feedback in my monthly and summative evaluations gives me valuable information on how to improve." Teachers' Perception of the Evaluation Feedback's Value Exceeds Meets Neets Attention Survey results show 75% of the respondents agreed or strongly agreed with the statement, “The feedback in my monthly and summative evaluations gives me valuable information on how to improve.” However, there is a correlation between the evaluation score and their response (see Figure 5). Figure 5
  • 9.
    0 5 10 15 20 25 30 Strongly Agree AgreeNeutral Disagree Strongly Disagree TeacherCount "The monthly and summative evaluations accurately depict my performance." Teachers' Perception of the Accuracy of Evaluations Exceeds Meets Neets Attention Responses to the statement, “The monthly and summative evaluations accurately depict my performance” follow the same trend (see Figure 6). 75% of the total respondents agreed or strongly agreed. Figure 6
  • 10.
    Cause Analysis Leading factorsaffecting performance were analyzed by six categories: • Expectations – Do teachers know what to do? • Feedback – Do teachers have the feedback they need? • Environment/ Tools – Do teachers have the tools and resources? • Incentives – What is in place to motivate teachers? • Organizational Support – Does the school support teachers’ improvement? • Skills and Knowledge – If their life depended on it, could they perform? These categories correspond to the suggested interventions, and they go from the least time consuming to the most time consuming.
  • 11.
    Factors in placeFactors not in place Expectations - QAS present at JIT and faculty meetings - Emailed links to evaluations - Some teachers found the rubric language unclear - No documentation describing how QAS use the rubric Feedback - Monthly observation feedback - QAS, ILT, and ASI email alerts - Teachers who are doing fine do not receive feedback after course checks. - QAS feedback is categorical but may not address individual criteria. Environment /Tools - ASIs and ILTs offer help - TQ supports: newsletters, PD - Rubrics for grading - OneNote Department notebooks - Courses lack answer keys for individual assignments. - Courses lack rote feedback that can be customized based on student (“Feedback Stamps”). Incentives - Invited to share at PD - OneNote Department notebooks recognize best practices - Presenting at professional development is more work for teachers who may not have the time. - Best practices do not necessarily correlate with improved student performance, attendance, or engagement with the course. Organizational Support - Support systems: strategies, tips, resources, teacher-pairs, Teacher Quality, PD, newsletters, and mentoring. - OneNote Department notebooks depend on organizational guidance and support Skills and Knowledge - Teachers can perform all assigned duties. - Teachers know what support systems are in place to help them. - Teachers may not know the best process to complete a task.
  • 12.
    Possible Root Causes •The monthly observation rubric uses language that is unclear to some teachers. • There is no documentation explaining how QAS use the rubric to conduct observations. • Teachers may not have easy access to the monthly evaluation rubric. • Monthly Observation feedback is not specific to the criteria. • Teachers who are doing fine do not receive feedback after course checks and may become unmotivated. • Courses lack answer keys for individual assignments. • Courses lack rote feedback that can be customized based on student (“Feedback Stamps”). • Additionally, there is some redundancy of duties in the monthly observation process.
  • 13.
    Suggested Interventions Interventions wereselected based on the three criteria: the likelihood of stakeholder buy-in, the most impact, and ease of implementation. • Provide labeled screenshots of examples for Meets and Exceeds criteria. • Create an annotated Observation Rubric depicting how monthly observations are conducted. Upload the document to Eduphoria and add a link to the Teacher Handbook. • Upload the current monthly evaluation rubric under “Resources” in Eduphoria. • Modify the observation rubric so each criteria is a checkbox. • ASIs and ILTs could send feedback to all teachers after conducting a course check. Exceptional examples of best practices could be featured in newsletters or in the new OneNote Departmental notebook. • Upload answer keys to the course page in the OneNote Departmental notebook. • Provide “Feedback Stamps” in the course files. • Revise the process for conducting course checks and spot checks among ASIs, ILTs, and QAS.
  • 14.
    Questions? A thorough descriptionof the analysis and an intervention implementation plan is in the Teacher Support Report