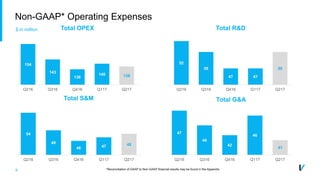
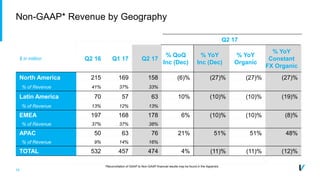
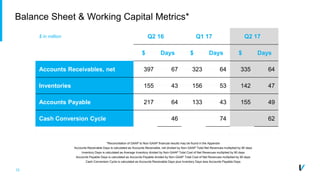
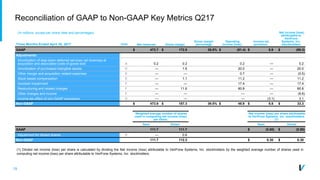
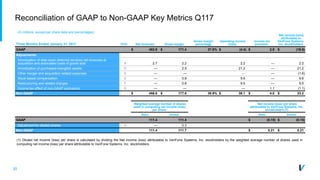
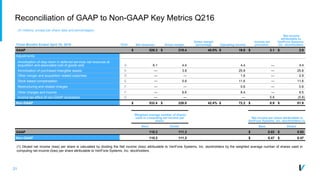
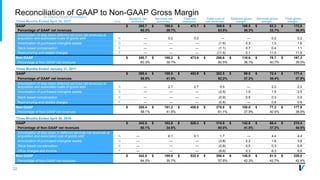
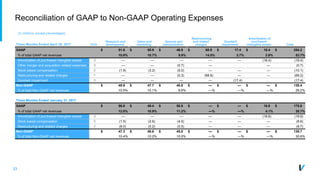
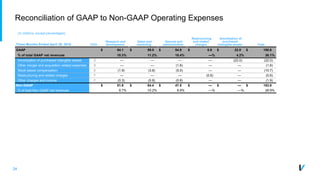
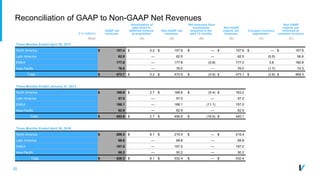
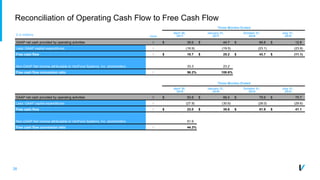
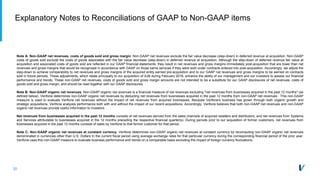
The document summarizes Verifone's use of non-GAAP financial measures in addition to GAAP measures to evaluate performance. It states that reconciliations of non-GAAP to GAAP measures can be found in Verifone's SEC filings and presentation materials. Management believes the non-GAAP measures are useful to compare performance across periods and companies by excluding certain items like amortization, restructuring charges, and stock compensation. However, the non-GAAP measures should be considered as supplements, not substitutes for, GAAP disclosures.
In this edition, we're covering:
RISE OF THE MACHINES • THE PRIVACY PARADOX VISIONS OF EXPERIENCE • NEW CARD TRICKS • MADE TO ORDER • CLASSIC/REFINED, CONTEMPORARY/DEFINED
LET'S GET PHYSICAL • THE CODE OF BETTER BUSINESS
HELPING MERCHANTS GROW • NON-BANKS DOING WHAT BANKS DO BEST PAYMENTS GONE WILD • GIVE A LITTLE BIT • ACCEPT ANYWHERE
At Verifone, we are committed to helping merchants grow. We've partnered with developers at Talech, Homebase, Ecwid, GiftFly and vPromos to share their stories on how they are leveraging the Verifone platform to help merchants grow and drive revenue.
Guiding Merchants to Success in the 21st Century: How to provide the solutions merchants need to stay relevant in this ever-changing retail environment.
Paybook Vol. 5 includes stories on Carbon 8, e285, the spread of mPOS, cashless trends in Asia Pacific and our Points app. Follow the conversation on Twitter: @Verifone
Surviving the Retail Jungle: how to continue to grow and stay relevant in this ever-changing retail environment.
Know Thy Customer
Mind the Millennial
Spread Out Investments
Stay Secure
Think Outside the Queue
Unify Your Brand
Create "Instagrammable" Experiences
Paybook Volume 4 includes stories from Allrecipes, Alipay and our all-new Verifone M400 multilane solution. Follow the conversation on Twitter: @Verifone
Paybook Volume 3 includes: the era of the savvy shopper, the winners of our Appathon, doing business today with the tools of tomorrow and ingenuity from the inside out.
Speedy Parking at #SB50 with Verifone's e315Verifone
Verifone's e315 was used by ParkHub to accept parking payments and vaildate pre-purchased parking vouchers at Levi's Stadium for Super Bowl 50. At peak time, one vehicle was processed every two seconds. The Verifone mobile payment terminals were an integrated component of ParkHub.com’s PRIME parking system, developed by Dallas based Dialexa and launched in January 2015 and currently in use at seven venues worldwide.
The Checkout is Getting Smarter in GermanyVerifone
Today, customers expect a unique and appealing shopping experience beyond the simple purchase of goods. Our clients want solutions that make checkout dynamic and engaging. One effective way to create additional value at the checkout is via multimedia services. A new DooH survey found 99 per cent of buyers in a German department store noticed digital advertising displays while waiting in line.
how to sell pi coins effectively (from 50 - 100k pi)DOT TECH
Anywhere in the world, including Africa, America, and Europe, you can sell Pi Network Coins online and receive cash through online payment options.
Pi has not yet been launched on any exchange because we are currently using the confined Mainnet. The planned launch date for Pi is June 28, 2026.
Reselling to investors who want to hold until the mainnet launch in 2026 is currently the sole way to sell.
Consequently, right now. All you need to do is select the right pi network provider.
Who is a pi merchant?
An individual who buys coins from miners on the pi network and resells them to investors hoping to hang onto them until the mainnet is launched is known as a pi merchant.
debuts.
I'll provide you the Telegram username
@Pi_vendor_247
Currently pi network is not tradable on binance or any other exchange because we are still in the enclosed mainnet.
Right now the only way to sell pi coins is by trading with a verified merchant.
What is a pi merchant?
A pi merchant is someone verified by pi network team and allowed to barter pi coins for goods and services.
Since pi network is not doing any pre-sale The only way exchanges like binance/huobi or crypto whales can get pi is by buying from miners. And a merchant stands in between the exchanges and the miners.
I will leave the telegram contact of my personal pi merchant. I and my friends has traded more than 6000pi coins successfully
Tele-gram
@Pi_vendor_247
The secret way to sell pi coins effortlessly.DOT TECH
Well as we all know pi isn't launched yet. But you can still sell your pi coins effortlessly because some whales in China are interested in holding massive pi coins. And they are willing to pay good money for it. If you are interested in selling I will leave a contact for you. Just telegram this number below. I sold about 3000 pi coins to him and he paid me immediately.
Telegram: @Pi_vendor_247
where can I find a legit pi merchant onlineDOT TECH
Yes. This is very easy what you need is a recommendation from someone who has successfully traded pi coins before with a merchant.
Who is a pi merchant?
A pi merchant is someone who buys pi network coins and resell them to Investors looking forward to hold thousands of pi coins before the open mainnet.
I will leave the telegram contact of my personal pi merchant to trade with
@Pi_vendor_247
how to swap pi coins to foreign currency withdrawable.DOT TECH
As of my last update, Pi is still in the testing phase and is not tradable on any exchanges.
However, Pi Network has announced plans to launch its Testnet and Mainnet in the future, which may include listing Pi on exchanges.
The current method for selling pi coins involves exchanging them with a pi vendor who purchases pi coins for investment reasons.
If you want to sell your pi coins, reach out to a pi vendor and sell them to anyone looking to sell pi coins from any country around the globe.
Below is the contact information for my personal pi vendor.
Telegram: @Pi_vendor_247
BYD SWOT Analysis and In-Depth Insights 2024.pptxmikemetalprod
Indepth analysis of the BYD 2024
BYD (Build Your Dreams) is a Chinese automaker and battery manufacturer that has snowballed over the past two decades to become a significant player in electric vehicles and global clean energy technology.
This SWOT analysis examines BYD's strengths, weaknesses, opportunities, and threats as it competes in the fast-changing automotive and energy storage industries.
Founded in 1995 and headquartered in Shenzhen, BYD started as a battery company before expanding into automobiles in the early 2000s.
Initially manufacturing gasoline-powered vehicles, BYD focused on plug-in hybrid and fully electric vehicles, leveraging its expertise in battery technology.
Today, BYD is the world’s largest electric vehicle manufacturer, delivering over 1.2 million electric cars globally. The company also produces electric buses, trucks, forklifts, and rail transit.
On the energy side, BYD is a major supplier of rechargeable batteries for cell phones, laptops, electric vehicles, and energy storage systems.
The European Unemployment Puzzle: implications from population agingGRAPE
We study the link between the evolving age structure of the working population and unemployment. We build a large new Keynesian OLG model with a realistic age structure, labor market frictions, sticky prices, and aggregate shocks. Once calibrated to the European economy, we quantify the extent to which demographic changes over the last three decades have contributed to the decline of the unemployment rate. Our findings yield important implications for the future evolution of unemployment given the anticipated further aging of the working population in Europe. We also quantify the implications for optimal monetary policy: lowering inflation volatility becomes less costly in terms of GDP and unemployment volatility, which hints that optimal monetary policy may be more hawkish in an aging society. Finally, our results also propose a partial reversal of the European-US unemployment puzzle due to the fact that the share of young workers is expected to remain robust in the US.
what is the future of Pi Network currency.DOT TECH
The future of the Pi cryptocurrency is uncertain, and its success will depend on several factors. Pi is a relatively new cryptocurrency that aims to be user-friendly and accessible to a wide audience. Here are a few key considerations for its future:
Message: @Pi_vendor_247 on telegram if u want to sell PI COINS.
1. Mainnet Launch: As of my last knowledge update in January 2022, Pi was still in the testnet phase. Its success will depend on a successful transition to a mainnet, where actual transactions can take place.
2. User Adoption: Pi's success will be closely tied to user adoption. The more users who join the network and actively participate, the stronger the ecosystem can become.
3. Utility and Use Cases: For a cryptocurrency to thrive, it must offer utility and practical use cases. The Pi team has talked about various applications, including peer-to-peer transactions, smart contracts, and more. The development and implementation of these features will be essential.
4. Regulatory Environment: The regulatory environment for cryptocurrencies is evolving globally. How Pi navigates and complies with regulations in various jurisdictions will significantly impact its future.
5. Technology Development: The Pi network must continue to develop and improve its technology, security, and scalability to compete with established cryptocurrencies.
6. Community Engagement: The Pi community plays a critical role in its future. Engaged users can help build trust and grow the network.
7. Monetization and Sustainability: The Pi team's monetization strategy, such as fees, partnerships, or other revenue sources, will affect its long-term sustainability.
It's essential to approach Pi or any new cryptocurrency with caution and conduct due diligence. Cryptocurrency investments involve risks, and potential rewards can be uncertain. The success and future of Pi will depend on the collective efforts of its team, community, and the broader cryptocurrency market dynamics. It's advisable to stay updated on Pi's development and follow any updates from the official Pi Network website or announcements from the team.
US Economic Outlook - Being Decided - M Capital Group August 2021.pdfpchutichetpong
The U.S. economy is continuing its impressive recovery from the COVID-19 pandemic and not slowing down despite re-occurring bumps. The U.S. savings rate reached its highest ever recorded level at 34% in April 2020 and Americans seem ready to spend. The sectors that had been hurt the most by the pandemic specifically reduced consumer spending, like retail, leisure, hospitality, and travel, are now experiencing massive growth in revenue and job openings.
Could this growth lead to a “Roaring Twenties”? As quickly as the U.S. economy contracted, experiencing a 9.1% drop in economic output relative to the business cycle in Q2 2020, the largest in recorded history, it has rebounded beyond expectations. This surprising growth seems to be fueled by the U.S. government’s aggressive fiscal and monetary policies, and an increase in consumer spending as mobility restrictions are lifted. Unemployment rates between June 2020 and June 2021 decreased by 5.2%, while the demand for labor is increasing, coupled with increasing wages to incentivize Americans to rejoin the labor force. Schools and businesses are expected to fully reopen soon. In parallel, vaccination rates across the country and the world continue to rise, with full vaccination rates of 50% and 14.8% respectively.
However, it is not completely smooth sailing from here. According to M Capital Group, the main risks that threaten the continued growth of the U.S. economy are inflation, unsettled trade relations, and another wave of Covid-19 mutations that could shut down the world again. Have we learned from the past year of COVID-19 and adapted our economy accordingly?
“In order for the U.S. economy to continue growing, whether there is another wave or not, the U.S. needs to focus on diversifying supply chains, supporting business investment, and maintaining consumer spending,” says Grace Feeley, a research analyst at M Capital Group.
While the economic indicators are positive, the risks are coming closer to manifesting and threatening such growth. The new variants spreading throughout the world, Delta, Lambda, and Gamma, are vaccine-resistant and muddy the predictions made about the economy and health of the country. These variants bring back the feeling of uncertainty that has wreaked havoc not only on the stock market but the mindset of people around the world. MCG provides unique insight on how to mitigate these risks to possibly ensure a bright economic future.
Falcon stands out as a top-tier P2P Invoice Discounting platform in India, bridging esteemed blue-chip companies and eager investors. Our goal is to transform the investment landscape in India by establishing a comprehensive destination for borrowers and investors with diverse profiles and needs, all while minimizing risk. What sets Falcon apart is the elimination of intermediaries such as commercial banks and depository institutions, allowing investors to enjoy higher yields.
Even tho Pi network is not listed on any exchange yet.
Buying/Selling or investing in pi network coins is highly possible through the help of vendors. You can buy from vendors[ buy directly from the pi network miners and resell it]. I will leave the telegram contact of my personal vendor.
@Pi_vendor_247
how can I sell pi coins after successfully completing KYCDOT TECH
Pi coins is not launched yet in any exchange 💱 this means it's not swappable, the current pi displaying on coin market cap is the iou version of pi. And you can learn all about that on my previous post.
RIGHT NOW THE ONLY WAY you can sell pi coins is through verified pi merchants. A pi merchant is someone who buys pi coins and resell them to exchanges and crypto whales. Looking forward to hold massive quantities of pi coins before the mainnet launch.
This is because pi network is not doing any pre-sale or ico offerings, the only way to get my coins is from buying from miners. So a merchant facilitates the transactions between the miners and these exchanges holding pi.
I and my friends has sold more than 6000 pi coins successfully with this method. I will be happy to share the contact of my personal pi merchant. The one i trade with, if you have your own merchant you can trade with them. For those who are new.
Message: @Pi_vendor_247 on telegram.
I wouldn't advise you selling all percentage of the pi coins. Leave at least a before so its a win win during open mainnet. Have a nice day pioneers ♥️
#kyc #mainnet #picoins #pi #sellpi #piwallet
#pinetwork
how can I sell pi coins after successfully completing KYC
Verifone Q2 2017 Earnings
1.
2. 2
Non-GAAP Financial Measures
With respect to any non-GAAP financial measures
presented in the information, reconciliations of non-
GAAP to GAAP financial measures may be found in
Verifone’s quarterly earnings release as filed with the
Securities and Exchange Commission as well as the
Appendix to these slides. Management uses non-GAAP
financial measures only in addition to and in conjunction
with results presented in accordance with GAAP.
Management believes that these Non-GAAP financial
measures help it to evaluate Verifone’s performance
and to compare Verifone’s current results with those for
prior periods as well as with the results of peer
companies. These non-GAAP financial measures
contain limitations and should be considered as a
supplement to, and not as a substitute for, or superior
to, disclosures made in accordance with GAAP
Forward Looking Statements
Today’s discussion may include “forward-looking
statements” within the meaning of the Private Securities
Litigation Reform Act of 1995. Such statements relate to
future events and expectations and involve known and
unknown risks and uncertainties. Verifone’s actual
results or actions may differ materially from those
projected in the forward-looking statements. For a
summary of the specific risk factors that could cause
results to differ materially from those expressed in the
forward-looking statements, please refer to Verifone’s
filings with the Securities and Exchange Commission,
including its annual report on Form 10-K and quarterly
reports on Form 10-Q. Verifone is under no obligation to,
and expressly disclaims any obligation to, update or
alter its forward-looking statements, whether as a result
of new information, future events, changes in
assumptions or otherwise
3. 3
Paul Galant
CEO
Business Update
Marc Rothman
CFO
Financial Update
Q&A
Paul Galant, CEO
Marc Rothman, CFO
Vin D’Agostino, Strategy
Chris Mammone, IR
Agenda
3
4. 4
Solid Execution in Q2 FY17
Q2 Non-GAAP Net
Revenues
$474M High end of guidance
Q2 Non-GAAP EPS $0.30 Above guidance
Sequential growth in North America Retail and SMB verticals
Strong demand in India and countries executing electronification and fiscalization
5. 5
2017 – Launch Year Progress
PCI certifications
on current lineup
Early success in
first-out markets
Engage Mobile
Carbon
Driving Tier 1 growth
and expanding into
hospitality and
emerging markets
Addresses growing
iPOS demand
Client engagements
in all regions
Services
Growing PaaS for
QSR and Lottery
Growing Payment
Services and Omni-
channel
6. 6
Strategic Initiatives and Divestitures
Petro Media JV Taxi China
• Transaction closed in Q2
• JV creates scaled national
media platform
• Verifone to focus resources
and capital on core business
• Pursuing sale of business
• Best value creation for all
stakeholders
• Verifone to focus resources
and capital on core business
• Divesting to local team and
maintaining minority interest
• Optimal path to participating
in China market
7. 7
To be our clients’ most trusted,
secure, and innovative
technology partner, providing
integrated payments and
commerce solutions globally
Non-GAAP* Financial Results
Q2 17
$ in million, except EPS Q2 16 Q1 17 Q2 17 % QoQ % YoY
Net Revenues 532 457 474 4% (11)%
Gross Margin 226 178 187 5% (17)%
% of Revenue 42.4% 38.9% 39.5% 0.6pts (2.9)pts
Operating Expenses 154 140 138 (1)% (10)%
Operating Income 72 38 49 28% (32)%
% of Revenue 13.6% 8.3% 10.3% 2.0pts (3.3)pts
Net Income** 52 23 33 43% (36)%
EPS 0.47 0.21 0.30 43% (36)%
Operating Cash Flow*** 52 45 36 (20)% (31)%
Free Cash Flow 24 25 19 (22)% (17)%
*Reconciliation of GAAP to Non-GAAP financial results may be found in the Appendix
**Net Income = Net Income attributable to VeriFone Systems, Inc. stockholders
***Operating Cash Flow = GAAP net cash provided by operating activities
8. 8
Non-GAAP* Revenue and Gross Margin by Business
$ in million Q2 16 Q1 17 Q2 17
Systems 342 265 286
Services 190 191 188
Total Net Revenue 532 457 474
Services % of Net Revenue 36% 42% 40%
As a % of Revenue Q2 16 Q1 17 Q2 17
Systems 42.3% 37.9% 38.7%
Services 42.7% 40.4% 40.7%
Gross Margin % 42.4% 38.9% 39.5%
*Reconciliation of GAAP to Non-GAAP financial results may be found in the Appendix
9. 9
Non-GAAP* Operating Expenses
54
49
46 47 48
Q216 Q316 Q416 Q117 Q217
Total S&M
154
143
136
140 138
Q216 Q316 Q416 Q117 Q217
Total OPEX
47
44
42
46
41
Q216 Q316 Q416 Q117 Q217
Total G&A
52
50
47 47
50
Q216 Q316 Q416 Q117 Q217
Total R&D
*Reconciliation of GAAP to Non-GAAP financial results may be found in the Appendix
$ in million
10. 10
Non-GAAP* Revenue by Geography
Q2 17
$ in million Q2 16 Q1 17 Q2 17
% QoQ
Inc (Dec)
% YoY
Inc (Dec)
% YoY
Organic
% YoY
Constant
FX Organic
North America 215 169 158 (6)% (27)% (27)% (27)%
% of Revenue 41% 37% 33%
Latin America 70 57 63 10% (10)% (10)% (19)%
% of Revenue 13% 12% 13%
EMEA 197 168 178 6% (10)% (10)% (8)%
% of Revenue 37% 37% 38%
APAC 50 63 76 21% 51% 51% 48%
% of Revenue 9% 14% 16%
TOTAL 532 457 474 4% (11)% (11)% (12)%
*Reconciliation of GAAP to Non-GAAP financial results may be found in the Appendix
11. 11
Cash & Debt
843 814 799
933 955 974 926 904 878
Q215 Q315 Q415 Q116 Q216 Q316 Q416 Q117 Q217
Gross Debt
234 242
209
186
157 157 148 147
134
Q215 Q315 Q415 Q116 Q216 Q316 Q416 Q117 Q217
Total Cash$ in million
609
572 590
747
798 817
778 757 744
Q215 Q315 Q415 Q116 Q216 Q316 Q416 Q117 Q217
Net Debt
Debt Statistics Credit Ratings
As of April 30, 2017
Short Term $75M S&P BB
Long Term $803M Moody’s Ba2
Outstanding $878M
12. 12
Balance Sheet & Working Capital Metrics*
$ in million Q2 16 Q1 17 Q2 17
$ Days $ Days $ Days
Accounts Receivables, net 397 67 323 64 335 64
Inventories 155 43 156 53 142 47
Accounts Payable 217 64 133 43 155 49
Cash Conversion Cycle 46 74 62
*Reconciliation of GAAP to Non-GAAP financial results may be found in the Appendix
Accounts Receivable Days is calculated as Accounts Receivable, net divided by Non-GAAP Total Net Revenues multiplied by 90 days
Inventory Days is calculated as Average Inventory divided by Non-GAAP Total Cost of Net Revenues multiplied by 90 days
Accounts Payable Days is calculated as Accounts Payable divided by Non-GAAP Total Cost of Net Revenues multiplied by 90 days
Cash Conversion Cycle is calculated as Accounts Receivable Days plus Inventory Days less Accounts Payable Days
13. 13
Cash Flow*
57
71
80
66
52
13
67
45
36
Q215 Q315 Q415 Q116 Q216 Q316 Q416 Q117 Q217
Operating cash flow**
28
41
52
36
24
(11)
44
25
19
Q215 Q315 Q415 Q116 Q216 Q316 Q416 Q117 Q217
Free cash flow***
$36M
Operating Cash Flow
$17M
Cap Ex
$19M
Free Cash Flow
*Reconciliation of GAAP to Non-GAAP financial results may be found in the Appendix
**Operating Cash Flow = GAAP net cash provided by operating activities
***Free Cash Flow is a non-GAAP financial measure
$ in million
14. 14
Impact of Divestitures on Financial Guidance
Petro Media JV
• Transaction closed in Q2
• FY17 guidance reflects deconsolidation of financials
post-close
China
• Intend to divest to locally owned and operated company
• Maintaining minority interest
• FY17 guidance excludes revenue of $15M in Q3/Q4
Taxi
• In discussions to sell business
• Will report operating results until disposition
• FY17 guidance includes revenue of $60M in Q3/Q4
15. 15
FY17 Non-GAAP* Guidance Bridge
Current
Guidance
Petro EMV Impact
(20-30)
China Divestiture
(15)
Prior
Guidance
1,900 - 1,915
1,865 - 1,870
In $ million
EPS above reflects guidance at the midpoint
China Divestiture: EPS improves by approximately $0.04 resulting from elimination of operating losses in 2H17
*Reconciliation of GAAP to Non-GAAP guidance may be found in the Appendix
$1.37 $1.33
Petro Impact: EPS decreases by approximately ($0.08) related primarily to North America Petro business
16. 16
Non-GAAP* Guidance
*Reconciliation of GAAP to Non-GAAP guidance may be found in the Appendix
Q3 17 Q4 17 FY17
Net Revenues $463-465M $472-475M $1.865-1.870B
Gross Margin ~41.0% ~42.5% ~40.5%
Operating Expenses Low $130M’s Low $130M’s ~$540M
Operating Margin ~12.5% ~15.0% ~11.5%
Effective Tax Rate ~15% ~15% ~15%
EPS $0.35-0.36 $0.46-0.47 $1.32-1.34
Fully Diluted Shares ~112M ~112M ~112M
Free Cash Flow ~$100M
Capital Expenditure $90M
19. 19
Reconciliation of GAAP to Non-GAAP Key Metrics Q217
(In millions, except per share data and percentages)
Note Net revenues Gross margin
Gross margin
percentage
Operating
income (loss)
Income tax
provision
Net income (loss)
attributable to
VeriFone
Systems, Inc.
stockholdersThree Months Ended April 30, 2017
GAAP $ 473.7 $ 172.8 36.5% $ (81.4) $ 8.9 $ (89.3)
Adjustments:
Amortization of step-down deferred services net revenues at
acquisition and associated costs of goods sold A 0.2 0.2 0.2 — 0.2
Amortization of purchased intangible assets D — 1.6 20.0 — 20.0
Other merger and acquisition related expenses D — — 0.7 — (0.5)
Stock based compensation E — 1.1 11.2 — 11.2
Goodwill Impairment F — — 17.4 — 17.4
Restructuring and related charges F — 11.6 80.8 — 80.8
Other charges and income F — — — — (9.6)
Income tax effect of non-GAAP exclusions G — — — (3.1) 3.1
Non-GAAP $ 473.9 $ 187.3 39.5% $ 48.9 $ 5.8 $ 33.3
Weighted average number of shares
used in computing net income (loss)
per share:
Net income (loss) per share attributable
to VeriFone Systems, Inc. stockholders
(1)
Basic Diluted Basic Diluted
GAAP 111.7 111.7 $ (0.80) $ (0.80)
Adjustment for diluted shares H — 0.6
Non-GAAP 111.7 112.3 $ 0.30 $ 0.30
(1) Diluted net income (loss) per share is calculated by dividing the Net income (loss) attributable to VeriFone Systems, Inc. stockholders by the weighted average number of shares used in
computing net income (loss) per share attributable to VeriFone Systems, Inc. stockholders.
20. 20
Reconciliation of GAAP to Non-GAAP Key Metrics Q117
(In millions, except per share data and percentages)
Note Net revenues Gross margin
Gross margin
percentage
Operating income
(loss)
Income tax
provision
Net income (loss)
attributable to
VeriFone Systems,
Inc. stockholdersThree Months Ended January 31, 2017
GAAP $ 453.9 $ 171.4 37.8% $ (4.4) $ 2.9 $ (16.6)
Adjustments:
Amortization of step-down deferred services net revenues at
acquisition and associated costs of goods sold A 2.7 2.2 2.2 — 2.2
Amortization of purchased intangible assets D — 2.5 21.2 — 21.2
Other merger and acquisition related expenses D — — — — (1.6)
Stock based compensation E — 0.9 9.6 — 9.6
Restructuring and related charges F — 0.8 9.5 — 9.5
Income tax effect of non-GAAP exclusions G — — — 1.1 (1.1)
Non-GAAP $ 456.6 $ 177.8 38.9% $ 38.1 $ 4.0 $ 23.2
Weighted average number of shares
used in computing net income (loss)
per share:
Net income (loss) per share
attributable to VeriFone Systems, Inc.
stockholders (1)
Basic Diluted Basic Diluted
GAAP 111.4 111.4 $ (0.15) $ (0.15)
Adjustment for diluted shares H — 0.3
Non-GAAP 111.4 111.7 $ 0.21 $ 0.21
(1) Diluted net income (loss) per share is calculated by dividing the Net income (loss) attributable to VeriFone Systems, Inc. stockholders by the weighted average number of shares used in
computing net income (loss) per share attributable to VeriFone Systems, Inc. stockholders.
21. 21
Reconciliation of GAAP to Non-GAAP Key Metrics Q216
(1) Diluted net income (loss) per share is calculated by dividing the Net income (loss) attributable to VeriFone Systems, Inc. stockholders by the weighted average number of shares used in
computing net income (loss) per share attributable to VeriFone Systems, Inc. stockholders.
(In millions, except per share data and percentages)
Note Net revenues Gross margin
Gross margin
percentage Operating income
Income tax
provision
Net income
attributable to
VeriFone Systems,
Inc. stockholdersThree Months Ended April 30, 2016
GAAP $ 526.3 $ 210.4 40.0% $ 19.8 $ 3.1 $ 2.9
Adjustments:
Amortization of step-down in deferred services net revenues at
acquisition and associated cost of goods sold A 6.1 4.4 4.4 — 4.4
Amortization of purchased intangible assets D — 3.8 25.8 — 25.8
Other merger and acquisition related expenses D — — 1.6 — 2.9
Stock based compensation E — 0.8 11.6 — 11.6
Restructuring and related charges F — — 0.6 — 0.6
Other charges and income F — 6.6 8.4 — 9.5
Income tax effect of non-GAAP exclusions G — — — 5.8 (5.8)
Non-GAAP $ 532.4 $ 226.0 42.4% $ 72.2 $ 8.9 $ 51.9
Weighted average number of shares
used in computing net income per
share:
Net income per share attributable to
VeriFone Systems, Inc. stockholders (1)
Basic Diluted Basic Diluted
GAAP 110.3 111.3 $ 0.03 $ 0.03
Non-GAAP 110.3 111.3 $ 0.47 $ 0.47
22. 22
Reconciliation of GAAP to Non-GAAP Gross Margin(In millions, except percentages)
Note
Systems net
revenues
Services net
revenues
Total net
revenues
Total cost of
net revenues
Systems gross
margin
Services gross
margin
Total gross
marginThree Months Ended April 30, 2017
GAAP $ 285.7 $ 188.0 $ 473.7 $ 300.9 $ 109.5 $ 63.3 $ 172.8
Percentage of GAAP net revenues 60.3% 39.7% 63.5% 38.3% 33.7% 36.5%
Amortization of step-down deferred services net revenues at
acquisition and associated costs of goods sold A — 0.2 0.2 — — 0.2 0.2
Amortization of purchased intangible assets D — — — (1.6) 0.3 1.3 1.6
Stock based compensation E — — — (1.1) 0.7 0.4 1.1
Restructuring and related charges F — — — (11.6) 0.1 11.5 11.6
Non-GAAP $ 285.7 $ 188.2 $ 473.9 $ 286.6 $ 110.6 $ 76.7 $ 187.3
Percentage of Non-GAAP net revenues 60.3% 39.7% 60.5% 38.7% 40.7% 39.5%
Three Months Ended January 31, 2017
GAAP $ 265.4 $ 188.5 $ 453.9 $ 282.5 $ 99.0 $ 72.4 $ 171.4
Percentage of GAAP net revenues 58.5% 41.5% 62.2% 37.3% 38.4% 37.8%
Amortization of step-down deferred services net revenues at
acquisition and associated costs of goods sold A — 2.7 2.7 0.5 — 2.2 2.2
Amortization of purchased intangible assets D — — — (2.5) 1.0 1.5 2.5
Stock based compensation E — — — (0.9) 0.6 0.3 0.9
Restructuring and related charges F — — — (0.8) — 0.8 0.8
Non-GAAP $ 265.4 $ 191.2 $ 456.6 $ 278.8 $ 100.6 $ 77.2 $ 177.8
Percentage of Non-GAAP net revenues 58.1% 41.9% 61.1% 37.9% 40.4% 38.9%
Three Months Ended April 30, 2016
GAAP $ 342.5 $ 183.8 $ 526.3 $ 315.9 $ 142.0 $ 68.4 $ 210.4
Percentage of Non-GAAP net revenues 65.1% 34.9% 60.0% 41.5% 37.2% 40.0%
Amortization of step-down in deferred services net revenues at
acquisition and associated cost of goods sold A — 6.1 6.1 1.7 — 4.4 4.4
Amortization of purchased intangible assets D — — — (3.8) 2.2 1.6 3.8
Stock based compensation E — — — (0.8) 0.5 0.3 0.8
Other charges and income F — — — (6.6) 0.3 6.3 6.6
Non-GAAP $ 342.5 $ 189.9 $ 532.4 $ 306.4 $ 145.0 $ 81.0 $ 226.0
Percentage of Non-GAAP net revenues 64.3% 35.7% 57.6% 42.3% 42.7% 42.4%
23. 23
Reconciliation of GAAP to Non-GAAP Operating Expenses
(In millions, except percentages)
Note
Research and
development
Sales and
marketing
General and
administrative
Restructuring
and related
charges
Goodwill
impairment
Amortization of
purchased
intangible assets TotalThree Months Ended April 30, 2017
GAAP $ 51.8 $ 50.9 $ 46.8 $ 68.9 $ 17.4 $ 18.4 $ 254.2
% of total GAAP net revenues 10.9% 10.7% 9.9% 14.5% 3.7% 3.9% 53.7%
Amortization of purchased intangible assets D — — — — — (18.4) (18.4)
Other merger and acquisition related expenses D — — (0.7) — — (0.7)
Stock based compensation E (1.9) (3.2) (5.0) — — — (10.1)
Restructuring and related charges F — — (0.3) (68.9) — — (69.2)
Goodwill impairment D — — — — (17.4) (17.4)
Non-GAAP $ 49.9 $ 47.7 $ 40.8 $ — $ — $ — $ 138.4
% of total Non-GAAP net revenues 10.5% 10.1% 8.6% —% —% —% 29.2%
Three Months Ended January 31, 2017
GAAP $ 56.8 $ 49.4 $ 50.8 $ — $ — $ 18.8 $ 175.8
% of total GAAP net revenues 12.5% 10.9% 11.2% —% —% 4.1% 38.7%
Amortization of purchased intangible assets D — — — — — (18.8) (18.8)
Stock based compensation E (1.5) (2.6) (4.5) — — — (8.6)
Restructuring and related charges F (8.0) (0.2) (0.5) — — — (8.7)
Non-GAAP $ 47.3 $ 46.6 $ 45.8 $ — $ — $ — $ 139.7
% of total Non-GAAP net revenues 10.4% 10.2% 10.0% —% —% —% 30.6%
24. 24
Reconciliation of GAAP to Non-GAAP Operating Expenses
(In millions, except percentages)
Note
Research and
development
Sales and
marketing
General and
administrative
Restructuring
and related
charges
Amortization of
purchased
intangible assets TotalThree Months Ended April 30, 2016
GAAP $ 54.1 $ 59.0 $ 54.9 $ 0.6 $ 22.0 $ 190.6
% of total GAAP net revenues 10.3% 11.2% 10.4% —% 4.2% 36.1%
Amortization of purchased intangible assets D — — — — (22.0) (22.0)
Other merger and acquisition related expenses D — — (1.6) — — (1.6)
Stock based compensation E (1.9) (3.8) (5.0) — — (10.7)
Restructuring and related charges F — — — (0.6) — (0.6)
Other charges and income F (0.3) (0.8) (0.8) — — (1.9)
Non-GAAP $ 51.9 $ 54.4 $ 47.5 $ — $ — $ 153.8
% of total Non-GAAP net revenues 9.7% 10.2% 8.9% —% —% 28.9%
25. 25
Reconciliation of GAAP to Non-GAAP Net Revenues
$ in millions
GAAP net
revenues
Amortization of
step-down in
deferred revenue
at acquisition
Non-GAAP net
revenues
Net revenues from
businesses
acquired in the
past 12 months
Non-GAAP
organic net
revenues
Constant currency
adjustment
Non-GAAP
organic net
revenues at
constant currency
Note (A) (A) (B) (B) (C) (C)
Three Months Ended April 30, 2017
North America $ 157.4 $ 0.2 $ 157.6 $ — $ 157.6 $ — $ 157.6
Latin America 62.5 — 62.5 — 62.5 (5.9) 56.6
EMEA 177.8 — 177.8 (0.8) 177.0 3.8 180.8
Asia-Pacific 76.0 — 76.0 — 76.0 (1.7) 74.3
Total $ 473.7 $ 0.2 $ 473.9 $ (0.8) $ 473.1 $ (3.8) $ 469.3
Three Months Ended January 31, 2017
North America $ 165.9 $ 2.7 $ 168.6 $ (5.4) $ 163.2
Latin America 57.0 — 57.0 — 57.0
EMEA 168.1 — 168.1 (11.1) 157.0
Asia-Pacific 62.9 — 62.9 — 62.9
Total $ 453.9 $ 2.7 $ 456.6 $ (16.5) $ 440.1
Three Months Ended April 30, 2016
North America $ 209.3 $ 6.1 $ 215.4 $ — $ 215.4
Latin America 69.8 — 69.8 — 69.8
EMEA 197.0 — 197.0 — 197.0
Asia-Pacific 50.2 — 50.2 — 50.2
Total $ 526.3 $ 6.1 $ 532.4 $ — $ 532.4
26. 26
Reconciliation of Operating Cash Flow to Free Cash Flow
Three Months Ended
$ in millions
Note
April 30,
2017
January 31,
2017
October 31,
2016
July 31,
2016
GAAP net cash provided by operating activities I $ 35.6 $ 44.7 $ 66.8 $ 12.8
Less: GAAP capital expenditures I (16.9) (19.5) (23.1) (23.9)
Free cash flow I $ 18.7 $ 25.2 $ 43.7 $ (11.1)
Non-GAAP Net income attributable to VeriFone Systems, Inc. stockholders 33.3 23.2
Free cash flow conversion ratio I 56.2% 108.6%
Three Months Ended
April 30,
2016
January 31,
2016
October 31,
2015
July 31,
2015
GAAP net cash provided by operating activities I $ 50.8 $ 66.4 $ 79.9 $ 70.7
Less: GAAP capital expenditures I (27.8) (30.6) (28.0) (29.6)
Free cash flow I $ 23.0 $ 35.8 $ 51.9 $ 41.1
Non-GAAP Net income attributable to VeriFone Systems, Inc. stockholders 51.9
Free cash flow conversion ratio I 44.3%
27. 27
Reconciliation of Net Revenues and Gross Margin Guidance
Three Months Ending
July 31, 2017
Three Months Ending
October 31, 2017
Year Ending October 31,
2017$ in millions, except per share amounts Note
GAAP net revenues $ 463-465 $ 472-475 $ 1,861-1,866
Adjustments to net revenues: A — — 4.0
Non-GAAP net revenues $ 463-465 $ 472-475 $ 1,865-1,870
GAAP Gross Margin Percentage 40.4% 41.9% 39.2%
Adjustments: (1)
Amortization of step-down deferred services net revenues and associated costs of goods sold
at acquisition A —% —% —%
Amortization of purchased intangible assets D 0.4% 0.4% 0.4%
Stock based compensation E 0.2% 0.2% 0.2%
Restructuring and related charges F —% —% 0.7%
Non-GAAP Gross Margin Percentage 41.0% 42.5% 40.5%
(1) Except for the adjustments noted herein, this guidance does not include the effects of any future acquisitions/divestitures, restructuring activities, significant legal matters, and non-recurring income tax
adjustments, which are difficult to predict and which may or may not be significant.
THIS FOOTNOTE MAINTAINED BY WHITNEY ON HER VERSION. PLEASE REVIEW THERE.
28. 28
Reconciliation of Operating Expenses and Operating Margin Guidance
Three Months Ending
July 31, 2017
Three Months Ending
October 31, 2017
Year Ending October 31,
2017$ in millions, except per share amounts Note
GAAP Operating Expenses $ 155.5 $ 155.5 $ 742.3
Adjustments: (1)
Amortization of purchased intangible assets D 16.5 16.5 70.2
Other merger and acquisition related expenses D — — 0.1
Stock based compensation E 9.0 9.0 36.6
Restructuring and related charges F — — 78.0
Goodwill Impairment F — — 17.4
Non-GAAP Operating Expenses $ 130.0 $ 130.0 $ 540.0
GAAP Operating Margin 6.5% 9.0% (0.8)%
Adjustments: (1)
Amortization of step-down deferred services net revenues and associated costs of goods sold
at acquisition A —% —% 0.1%
Amortization of purchased intangible assets D 4.0% 4.0% 4.2%
Other merger and acquisition related expenses D —% —% —%
Stock based compensation E 2.0% 2.0% 2.0%
Restructuring and related charges F —% —% 5.0%
Goodwill Impairment F —% —% 1.0%
Non-GAAP Operating Margin G 12.5% 15.0% 11.5%
(1) Except for the adjustments noted herein, this guidance does not include the effects of any future acquisitions/divestitures, restructuring activities, significant legal matters, and non-recurring income tax
adjustments, which are difficult to predict and which may or may not be significant.
THIS FOOTNOTE MAINTAINED BY WHITNEY ON HER VERSION. PLEASE REVIEW THERE.
29. 29
Reconciliation of EPS Guidance
Three Months Ending
July 31, 2017
Three Months Ending
October 31, 2017
Year Ending October 31,
2017$ in millions, except per share amounts Note
Diluted GAAP earnings (loss) per share (1) $ 0.14 - 0.15 $ 0.25 - 0.26 $ (0.51) - (0.53)
Adjustments: (2)
Amortization of step-down deferred services net revenues and associated costs of goods sold
at acquisition A $ — $ — 0.03
Amortization of purchased intangible assets D 0.16 0.16 0.67
Stock based compensation E 0.09 0.09 0.36
Restructuring and related charges F — — 0.69
Goodwill Impairment F — — 0.15
Income tax effect of non-GAAP exclusions (3) G (0.04) (0.04) (0.05)
Diluted Non-GAAP earnings per share (1) $ 0.35 - 0.36 $ 0.46 - 0.47 $ 1.32 - 1.34
(1) GAAP and non-GAAP diluted earnings (loss) per share are determined using the most dilutive measure, which includes outstanding RSU and RSA shares in the calculation of the weighted average diluted
shares outstanding in periods in which we expect net income.
(2) Except for the adjustments noted herein, this guidance does not include the effects of any future acquisitions/divestitures, restructuring activities, significant legal matters, and non-recurring income tax
adjustments, which are difficult to predict and which may or may not be significant.
(3) Assuming a GAAP effective tax rate of 14.5% applied to the above non-GAAP exclusions.
THIS FOOTNOTE MAINTAINED BY WHITNEY ON HER VERSION. PLEASE REVIEW THERE.
30. 30
Explanatory Notes to Reconciliations of GAAP to Non-GAAP items
Note A: Non-GAAP net revenues, costs of goods sold and gross margin. Non-GAAP net revenues exclude the fair value decrease (step-down) in deferred revenue at acquisition. Non-GAAP
costs of goods sold exclude the costs of goods associated with the fair value decrease (step-down) in deferred revenue at acquisition. Although the step-down of deferred revenue fair value at
acquisition and associated costs of goods sold are reflected in our GAAP financial statements, they result in net revenues and gross margins immediately post-acquisition that are lower than net
revenues and gross margins that would be recognized in accordance with GAAP on those same services if they were sold under contracts entered into post-acquisition. Accordingly, we adjust the
step-down to achieve comparability to net revenues and gross margins of the acquired entity earned pre-acquisition and to our GAAP net revenues and gross margins to be earned on contracts
sold in future periods. These adjustments, which relate principally to our acquisition of AJB during February 2016, enhance the ability of our management and our investors to assess our financial
performance and trends. These non-GAAP net revenues, costs of goods sold and gross margin amounts are not intended to be a substitute for our GAAP disclosures of net revenues, costs of
goods sold and gross margin, and should be read together with our GAAP disclosures.
Note B: Non-GAAP organic net revenues. Non-GAAP organic net revenues is a financial measure of net revenues excluding "net revenues from businesses acquired in the past 12 months" (as
defined below). Verifone determines non-GAAP organic net revenues by deducting net revenues from businesses acquired in the past 12 months from non-GAAP net revenues. This non-GAAP
measure is used to evaluate Verifone net revenues without the impact of net revenues from acquired businesses. Because Verifone's business has grown through both organic growth and
strategic acquisitions, Verifone analyzes performance both with and without the impact of our recent acquisitions. Accordingly, Verifone believes that both non-GAAP net revenues and non-GAAP
organic net revenues provide useful information to investors.
Net revenues from businesses acquired in the past 12 months consists of net revenues derived from the sales channels of acquired resellers and distributors, and net revenues from Systems
and Services attributable to businesses acquired in the 12 months preceding the respective financial quarter(s). During periods prior to our acquisition of former customers, net revenues from
businesses acquired in the past 12 months consists of sales by Verifone to that former customer for that period.
Note C: Non-GAAP organic net revenues at constant currency. Verifone determines non-GAAP organic net revenues at constant currency by recomputing non-GAAP organic net revenues
denominated in currencies other than U.S. Dollars in the current fiscal period using average exchange rates for that particular currency during the corresponding financial period of the prior year.
Verifone uses this non-GAAP measure to evaluate business performance and trends on a comparable basis excluding the impact of foreign currency fluctuations.
31. 31
Explanatory Notes to Reconciliations of GAAP to Non-GAAP items
Note D: Merger and Acquisition Related. Verifone adjusts certain revenues and expenses for items that are the result of mergers and acquisitions. Merger and acquisition related adjustments
include the amortization of intangible assets, contingent consideration fair market value adjustments, interest on contingent consideration, transaction expenses associated with acquisitions, and
acquisition integration expenses.
Amortization of intangible assets: Verifone incurs amortization of intangible assets in connection with its acquisitions, such as amortization of finite lived customer relationships intangibles. We are
required to allocate a portion of the purchase price of each business acquisition to the intangible assets acquired and to amortize this amount over the estimated useful lives of those acquired
intangible assets. Because these amounts have no direct correlation to Verifone’s underlying business operations, we eliminate these amortization charges and any associated minority interest
impact from our non-GAAP operating results to provide better comparability of pre-acquisition and post-acquisition operating results.
Contingent consideration fair market value adjustments and interest on contingent consideration: In connection with its acquisitions, Verifone owes contingent consideration payments based upon
the post-acquisition performance of and other factors related to acquired businesses. These contingent consideration liabilities are reported at fair market value and incur non-cash imputed
interest. Changes in the fair market value of contingent consideration and imputed interest expense vary independent of our ongoing operating results and have no direct correlation to our
underlying business operations. Accordingly, Verifone excludes these amounts from our non-GAAP operating results to provide better comparability of pre-acquisition and post-acquisition
operating results.
Transaction expenses associated with acquisitions: Verifone incurs transaction expenses in connection with its acquisitions, which include legal and other professional fees such as advisory,
accounting, valuation and consulting fees. These transaction expenses are related to acquisitions and have no direct correlation with the ongoing operation of Verifone’s business. Accordingly,
Verifone excludes these amounts from our non-GAAP operating results to provide better comparability of pre-acquisition and post-acquisition operating results.
Acquisition integration expenses: In connection with its acquisitions, Verifone incurs costs relating to the integration of the acquired business with Verifone’s ongoing business, which includes
expenses relating to the integration of facilities and other infrastructure, information technology systems and employee-related costs such as costs of personnel required to assist with integration
transitions. These acquisition integration expenses are related to acquisitions and have no direct correlation with the ongoing operation of Verifone’s business. Accordingly, Verifone excludes these
amounts from our non-GAAP operating results to provide better comparability of pre-acquisition and post-acquisition operating results.
Note E: Stock-Based Compensation. Our non-GAAP financial measures eliminate the effect of expense for stock-based compensation because they are non-cash expenses and. because of
varying available valuation methodologies, subjective assumptions and the variety of award types which affect the calculations of stock-based compensation, we believe that the exclusion of stock-
based compensation allows for more accurate comparisons of our operating results to our peer companies. Stock-based compensation is very different from other forms of compensation. A cash
salary or bonus has a fixed and unvarying cash cost. In contrast the expense associated with a stock based award is unrelated to the amount of compensation ultimately received by the employee;
and the cost to the company is based on valuation methodology and underlying assumptions that may vary over time and does not reflect any cash expenditure by the company. Furthermore, the
expense associated with granting an employee a stock based award can be spread over multiple years and may be reversed based on forfeitures which may differ from our original assumptions
unlike cash compensation expense which is typically recorded contemporaneously with the time of award or payment. Accordingly, we believe that excluding stock-based compensation expense
from our non-GAAP operating results facilitates better understanding of our long-term business performance and enhances period-to-period comparability.
32. 32
Explanatory Notes to Reconciliations of GAAP to Non-GAAP items
Note F: Other Charges and Income. Verifone excludes certain expenses, other income (expense) and gains (losses) that we have determined are not reflective of ongoing operating results or
that vary independent of business performance. It is difficult to estimate the amount or timing of these items in advance. Although these events are reflected in our GAAP financial statements, we
exclude them in our non-GAAP financial measures because we believe these items limit the comparability of our ongoing operations with prior and future periods. These adjustments for other
charges and income include:
Transformation and restructuring: Over the past several years, we have had gains and incurred expenses, such as professional services, contract cancellation fees and certain personnel and
personnel costs related to initiatives to transform, streamline, centralize and restructure our global operations. The transformation gain relates to the contribution of certain business assets and
associated equity ownership in Gas Media. Charges include involuntary termination costs, costs to cancel facility leases, write down of assets held for sale, and associated legal and other advisory
fees, as well as fiscal year 2016 operating income and losses of businesses identified to exit as part of our strategic review of under-performing businesses and global transformation initiatives.
Each of these items has been incurred in connection with discrete activities in furtherance of specific business objectives in light of prevailing circumstances, and each item and the associated
activity or activities have had differing impacts on our business operations. We do not recognize gains or incur costs of this nature in the ordinary course of business. While certain of these items
have recurred in recent years and may continue to recur in the near future, the amount of these items has varied significantly from period to period. Accordingly, management assesses our
operating performance with these amounts included and excluded, and we believe that by providing this information, users of our financial statements are better able to understand the financial
results of what we consider to be our continuing operations and compare our current operating performance to our past operating performance.
Foreign exchange losses related to obligations denominated in currencies of highly inflationary economies: Our non-GAAP operating results do not include foreign exchange losses related to
obligations denominated in highly inflationary economies, such as the devaluation of the Argentina Peso during the first quarter of fiscal year 2016. We believe that excluding such losses provides
a better indication of our business performance, as the existence of high inflation in these economies varies independent of our business performance, and enhances the comparability of our
business performance during periods before and after such inflation occurred.
Goodwill impairment: Our non-GAAP results exclude any goodwill impairment. We believe that excluding goodwill impairments provides a better indication of our business performance and
enhances the comparability of our business performance during periods before and after we recorded the impairment.
Note G: Income Tax Effect of Non-GAAP exclusions. Income taxes are adjusted for the tax effect of the adjusting items related to our non-GAAP financial measures and to reflect our medium
to long term estimate of taxes on a non-GAAP basis, in order to provide our management and users of the financial statements with better clarity regarding the on-going comparable performance.
For the purpose of computing non-GAAP actual results, we used a 14.5% rate for all periods presented.
Note H: Non-GAAP diluted shares. Diluted GAAP and non-GAAP weighted-average shares outstanding are the same in all periods except where there is a GAAP net loss. In accordance with
GAAP, we do not consider dilutive shares in periods that there is a net loss. However, in periods when we have a non-GAAP net income and a GAAP basis net loss, diluted non-GAAP weighted
average shares include additional shares that are dilutive for non-GAAP computations of earnings per share.
Note I: Free Cash Flow. Verifone determines free cash flow as net cash provided by operating activities less capital expenditures. The free cash flow conversion ratio is free cash flow divided by
non-GAAP Net income attributable to VeriFone Systems, Inc. stockholders.
Editor's Notes
Fix the (11) and Q3
EPS Impact
China: EPS improves by approximately $0.04 resulting from elimination of operating losses in 2H FY17
Petro: EPS decreases by approximately $0.08 related primarily to our North America Petro business
EPS above reflects guidance at the midpoint