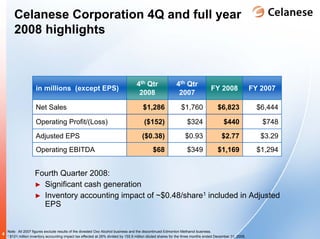
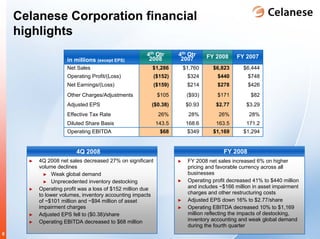
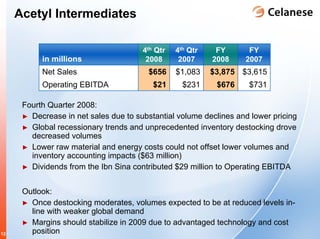
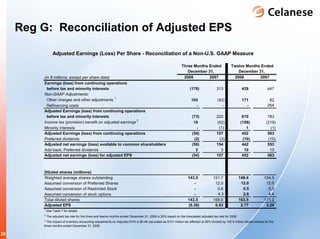
The document summarizes Celanese's 4Q 2008 earnings conference call. It discusses Celanese's 4Q 2008 financial results including a net loss of $152 million compared to an operating profit in 4Q 2007, and an adjusted EPS of ($0.38) compared to $2.77 in 4Q 2007. It also provides highlights for each of Celanese's business segments and discusses the outlook for 2009 including expected continued volume declines.
The document summarizes Celanese Corporation's 1Q 2009 earnings conference call. It provides an overview of the participants in the call and includes forward-looking statements and information on non-GAAP measures. The financial highlights show a year-over-year decline in net sales, operating profit, and adjusted EPS due to lower volumes and pricing pressure. Segment results are also down across most businesses compared to prior year. However, the company maintained a strong cash position and generated positive adjusted free cash flow for the quarter.
The document summarizes an upcoming earnings call for Celanese Corporation for the fourth quarter and full year of 2007. It lists Dave Weidman, Chairman and CEO, and Steven Sterin, Senior Vice President and CFO, as speakers on the call. The document also provides key financial highlights including year-over-year increases in 4Q 2007 net sales, operating profit, adjusted EPS, and operating EBITDA compared to 4Q 2006, as well as increases in full year 2007 net sales and operating EBITDA compared to full year 2006.
Celanese will hold a conference call on April 22, 2008 at 10:00 am ET to discuss its first quarter 2008 earnings. The call will feature Dave Weidman, Chairman and CEO, and Steven Sterin, Senior Vice President and CFO. The document provides forward-looking statements and non-GAAP financial measures to supplement GAAP reporting. It summarizes Celanese's financial highlights for Q1 2008, including revenue increases across most business segments and higher adjusted EPS compared to Q1 2007. Celanese affirms its 2008 guidance for adjusted EPS and operating EBITDA.
The document summarizes Celanese's 2Q 2008 earnings conference call. It includes an agenda with the Chairman and CEO and SVP and CFO scheduled to speak. It also provides forward-looking statements, non-GAAP financial measure definitions, and notes the results are unaudited. Key highlights are record net sales for the quarter driven by higher pricing and volumes in Asia, but lower operating profit and EPS due to higher raw material costs, and a plan to achieve growth objectives by 2010 through volume growth in advanced materials and consumer/industrial specialties.
The document summarizes Celanese Corporation's 3Q 2008 earnings conference call and webcast scheduled for October 21, 2008. It includes an agenda with the Chairman and CEO and SVP and CFO slated to speak. The document also provides forward-looking statements, non-GAAP reconciliations, and highlights of Celanese's 3Q 2008 financial results including net sales, operating profit, adjusted EPS, and operating EBITDA by business segment. Celanese's affiliates continued to deliver value through dividends in 3Q 2008.
Celanese will hold a conference call on February 6, 2007 at 10:00 am CT to discuss its 4th quarter 2006 earnings. The call will feature presentations from Dave Weidman, President and CEO, and John J. Gallagher III, Executive Vice President and CFO. The document provides an overview of Celanese's 4th quarter and full year 2006 financial highlights including net sales, operating profit, adjusted EPS, operating EBITDA, and free cash flow. It also outlines Celanese's objectives to grow operating EBITDA to $300-350 million by 2010 through business revitalization, innovation, organic growth in Asia, and a focus on operational excellence.
public serviceenterprise group 3Q 2007 slides3finance20
The document provides details on PSEG's third quarter 2007 earnings conference call, highlighting that operating earnings exceeded expectations. It summarizes financial results for various subsidiaries including PSE&G and PSEG Power. Additionally, it discusses PSEG Power's strong operating performance at its nuclear plants and benefits seen from PJM's capacity auction pricing model.
public serviceenterprise group 3Q 2008 slidesfinance20
PSEG reported solid third quarter 2008 earnings, maintaining guidance for the full year. Operating earnings were $476 million compared to $497 million in the prior year quarter. PSEG Power contributed $328 million in operating earnings, while PSE&G contributed $97 million. PSEG Energy Holdings contributed $56 million in operating earnings. PSEG is on track to meet its full year 2008 guidance and has provided guidance of $3.05 to $3.35 per share for 2009, but financial market stress may limit growth to the lower half of the range.
Celanese will hold a conference call on October 31, 2006 to discuss its third quarter 2006 earnings. The call will include presentations from Dave Weidman, President and CEO, and John J. Gallagher III, Executive Vice President and CFO. They will discuss Celanese's financial results for the third quarter, business segment highlights, capitalization, guidance for full year 2006, and reconciliation of certain non-GAAP financial measures used by management.
public serviceenterprise group 4Q_2007_Webcast_Slides_FINALfinance20
This document summarizes a conference call by PSEG (Public Service Enterprise Group) discussing their fourth quarter and full year 2007 earnings. Some key points:
- For Q4 2007, PSEG reported operating earnings of $277 million compared to $136 million in Q4 2006. Full year 2007 operating earnings were $1.377 billion compared to $872 million in 2006.
- PSEG provided 2008 guidance of $5.60-$6.10 in operating earnings per share, representing 8% growth over 2007 results.
- 2007 results were at the top end of prior guidance. Focus was on core businesses like nuclear power generation and transmission investment. Debt was reduced and the dividend was increased 10%.
This document provides a summary of AES Corporation's financial results for the second quarter of 2008. Some key highlights include:
- Increased full year adjusted EPS guidance to $1.16 per share.
- Reported Q2 2008 adjusted EPS of $0.17, including foreign currency losses.
- Began construction on four new power projects totaling 954 MW in three countries.
- Expanded wind platform in China and registered the company's first greenfield methane recovery project in Malaysia.
public serviceenterprise group european_tripfinance20
1) Public Service Enterprise Group (PSEG) is holding a European marketing trip from February 25-29, 2008 to promote its business.
2) PSEG provides forward-looking statements about its performance, which are subject to various risks and uncertainties that could cause actual results to differ.
3) PSEG presents non-GAAP operating earnings in addition to GAAP net income to exclude certain one-time items in order to provide a consistent performance measure.
The document summarizes Celanese Corporation's 1Q 2006 earnings conference call and webcast scheduled for May 9, 2006. It includes an agenda with the CEO and CFO slated to speak. Financial highlights are provided for Celanese's 1Q 2006 results including net sales growth of 12% and diluted adjusted EPS growth of 16% year-over-year. Guidance for full year 2006 adjusted EPS is given in the range of $2.50 to $2.90 per share. Various non-GAAP financial measures are reconciled to the most comparable GAAP measures.
public serviceenterprise group 2Q2007Slidesfinance20
This document provides an earnings conference call transcript for Public Service Enterprise Group (PSEG) for the second quarter of 2007. Some key details include:
- Operating earnings per share for Q2 2007 were $1.15, up from $0.68 in Q2 2006. Year-to-date operating earnings per share were $2.47, up from $1.52.
- PSEG Power saw improved earnings from higher energy and capacity prices. PSE&G's performance improved due to rate relief and normal weather. Holdings earnings declined due to lower spark spreads in Texas and an extended outage in Italy.
- Results are on track to meet full-year earnings guidance and commitments around system
Time Warner provided forward-looking statements about future financial performance that are based on current expectations and subject to uncertainty. Actual results may differ materially from projections. More details on risk factors are in SEC filings. Non-GAAP measures are used to discuss historical performance and future expectations, and reconciliations to GAAP measures are available on the company's website. In Q1 2009, revenues declined 7% to $6.9 billion while adjusted EPS declined 6% to $0.45, and free cash flow declined 12% to $1.3 billion. Networks and Filmed Entertainment saw revenue declines while adjusting operating income increased for Networks and declined for Filmed Entertainment.
The document summarizes Celanese Corporation's third quarter 2007 earnings conference call that was scheduled for October 23, 2007 at 10:00 am ET. It would be led by Dave Weidman, Chairman and CEO, and Steven Sterin, Senior Vice President and CFO. The document provides an overview of Celanese's business segments and key financial highlights for the third quarter of 2007, including adjusted EPS of $0.73, a 7% increase in net sales, and operating EBITDA of $302 million. It also reviews the company's outlook and growth strategies for 2007.
This document provides details on Celanese Corporation's second quarter 2006 earnings conference call, including an agenda with the CEO and CFO as speakers. It also provides financial highlights for Q2 2006 such as an 11% increase in net sales and an 18% rise in operating EBITDA. Celanese issues guidance for full year 2006 of adjusted EPS between $2.50-$2.80.
The document summarizes Celanese Corporation's 1Q 2008 earnings conference call. It includes details on the speakers, forward-looking statements, non-GAAP reconciliations, and 1Q 2008 financial highlights for each business segment. Celanese reports higher sales driven by price increases and currency effects, though margins were pressured by rising input costs. Affiliate earnings and dividends increased. Celanese affirms 2008 guidance for adjusted EPS of $3.60-$3.85 and operating EBITDA of $1.355-$1.415 billion.
The document summarizes Celanese Corporation's 4Q 2007 earnings conference call. It includes highlights such as a 23% increase in 4Q net sales and a 52% increase in adjusted EPS compared to the same period last year. Celanese also provides guidance for 2008, forecasting adjusted EPS between $3.40-$3.70 and operating EBITDA of $1,290-$1,360 million. Segment results are presented for Advanced Engineered Materials, Consumer Specialties, Industrial Specialties, and Acetyl Intermediates. Affiliate contributions and continued strong cash generation are also discussed.
The document summarizes Celanese Corporation's 4Q 2007 earnings conference call. It includes highlights such as a 23% increase in 4Q net sales and a 52% increase in adjusted EPS compared to the same period last year. Celanese also provides guidance for 2008, forecasting adjusted EPS between $3.40-$3.70 and operating EBITDA of $1,290-$1,360 million. Segment results and details on continued strong cash generation are also presented. Key executives Dave Weidman and Steven Sterin will discuss 4Q performance and business outlook further on the earnings call.
The document summarizes Celanese Corporation's 3Q 2008 earnings conference call. It provides an overview of the company's performance including a 16% increase in net sales driven by higher pricing and volumes. Operating profit increased to $151 million though margins were compressed by higher raw material costs. Adjusted EPS increased 7% to $0.78 per share. All business segments saw sales growth with Advanced Engineered Materials and Industrial Specialties impacted by weaker automotive and industrial end markets respectively. Affiliates continued to deliver value with $54 million in earnings. Strong cash generation resulted in $195 million in adjusted free cash flow.
The document summarizes Celanese Corporation's second quarter 2008 earnings conference call. It provides an overview of the participants in the call, including the Chairman and CEO and Senior Vice President and CFO. Key highlights from the second quarter include record sales driven by higher pricing and growth in Asia, though operating profit declined due to higher raw material costs. The document reviews financial results and performance across Celanese's business segments and discusses continued strong cash generation and the company's outlook for 2008.
The document summarizes Celanese's 2Q 2008 earnings conference call. It includes an agenda with the Chairman and CEO and SVP and CFO scheduled to speak. It also provides forward-looking statements, non-GAAP reconciliations, and describes results as unaudited. Key highlights are record net sales for the quarter driven by higher pricing and volumes in Asia, though operating profit and EPS declined from significantly higher raw material costs. The company also reaffirms its path to achieving operating EBITDA growth objectives by 2010 through volume growth in advanced materials and further acetate tow penetration.
public serviceenterprise group 4Q_2007_Webcast_Slides_FINALfinance20
Public Service Enterprise Group (PSEG) held an earnings conference call to discuss its fourth quarter and full year 2007 results. PSEG reported operating earnings of $277 million for Q4 2007 compared to $136 million for Q4 2006. For the full year, operating earnings were $1.377 billion compared to $872 million in 2006. PSEG's strong results were driven by improved performance at its power generation subsidiary PSEG Power due to favorable market conditions and asset sales. Looking ahead, PSEG expects continued earnings growth of 8% in 2008.
This document provides details on Celanese Corporation's second quarter 2007 earnings conference call, including details on the call participants, forward-looking statements, and reconciliation of non-GAAP measures. It also summarizes key financial highlights and performance details for Celanese's business segments, including increased sales and operating EBITDA compared to the prior year. Equity investments also continued to deliver increased income and cash flow.
This document discusses Celanese Corporation's performance in 2008 and strategies going forward. It contains the following key points:
1. Celanese reported strong financial results for the third quarter and year-to-date 2008, despite challenging market conditions.
2. The company has executed a strategy focused on specialty businesses and divesting non-core assets to create a more resilient portfolio.
3. Going forward, Celanese aims to accelerate growth in specialty businesses like Consumer Specialties and leverage its integrated operations and global positions.
public serviceenterprise group 1Q2007Slidesfinance20
This document provides a summary of PSEG's earnings conference call for the first quarter of 2007. Key highlights include:
1) PSEG reported operating earnings of $335 million or $1.32 per share for Q1 2007, an increase from $213 million or $0.85 per share in Q1 2006.
2) PSEG Power delivered strong results driven by the roll-off of below-market contracts and sustained top quartile nuclear performance.
3) PSE&G saw improved earnings from rate relief received in Q4 2006 and more normal weather compared to unusually warm conditions in 2006.
4) Cash flow and liquidity remain strong, allowing PSEG to reduce parent debt
public serviceenterprise group 1Q 2007 Slidesfinance20
This document provides a summary of PSEG's earnings conference call for the first quarter of 2007. Key highlights include:
1) PSEG reported operating earnings of $335 million or $1.32 per share for Q1 2007, an increase from $213 million or $0.85 per share in Q1 2006.
2) PSEG Power delivered strong results driven by the roll-off of below-market contracts and sustained top quartile nuclear performance.
3) PSE&G saw earnings growth from rate relief received in late 2006 and more normal weather compared to unusually warm conditions in 2006.
4) Cash flow and liquidity remain strong, allowing PSEG to reduce parent debt levels
public serviceenterprise group library.corporate-irfinance20
PSEG held an earnings conference call to discuss its fourth quarter and full-year 2008 results. For Q4 2008, PSEG reported operating earnings of $250 million compared to $272 million in Q4 2007. For the full year, operating earnings were $1,487 million compared to $1,385 million in 2007. PSEG Power's Q4 operating earnings were $207 million, matching the prior year, while PSE&G's were $76 million compared to $77 million in Q4 2007. PSEG provided 2009 operating earnings guidance of $3.00-$3.25 per share.
This document provides a summary of PSEG's 4th quarter and full-year 2008 earnings conference call. It discusses PSEG meeting its 2008 earnings guidance despite challenges. Key points include PSEG focusing on operational excellence, laying a foundation for the future through carbon abatement and infrastructure programs, and strengthening its financial position by reducing debt and recognizing reserves for tax risks. The document also provides guidance for 2009 operating earnings of $3.00-$3.25 per share.
public serviceenterprise group Investor library.corporatefinance20
PSEG held an earnings conference call to discuss its fourth quarter and full-year 2008 results. For the fourth quarter, PSEG reported operating earnings of $250 million compared to $272 million in the prior year quarter. For the full year, operating earnings were $1,487 million compared to $1,385 million in 2007. PSEG Power's fourth quarter operating earnings were $207 million, matching the prior year, while PSE&G's were $76 million, down slightly from $77 million in 2007. PSEG provided 2009 operating earnings guidance of $3.00-$3.25 per share.
public serviceenterprise group library.corporatefinance20
PSEG held an earnings conference call to discuss its fourth quarter and full-year 2008 results. For the fourth quarter, PSEG reported operating earnings of $250 million compared to $272 million in the prior year quarter. For the full year, operating earnings were $1,487 million compared to $1,385 million in 2007. PSEG Power's fourth quarter operating earnings were $207 million, matching the prior year, while PSE&G's were $76 million, down slightly from $77 million in 2007. PSEG provided 2009 operating earnings guidance of $3.00-$3.25 per share.
public serviceenterprise grouplibrary.corporate-ifinance20
This document provides a summary of PSEG's 4th quarter and full-year 2008 earnings conference call. It discusses PSEG meeting its 2008 earnings guidance despite challenges. Key points include PSEG focusing on operational excellence, laying a foundation for the future through carbon abatement and infrastructure programs, and strengthening its financial position by reducing debt and recognizing reserves for tax risks. The document also provides guidance for 2009 operating earnings of $3.00-$3.25 per share.
public serviceenterprise group library.corporate-irfinance20
PSEG held an earnings conference call to discuss its fourth quarter and full-year 2008 results. For Q4 2008, PSEG reported operating earnings of $250 million compared to $272 million in Q4 2007. For the full year, operating earnings were $1,487 million compared to $1,385 million in 2007. PSEG Power's Q4 operating earnings were $207 million, matching the prior year, while PSE&G's were $76 million compared to $77 million in Q4 2007. PSEG provided 2009 operating earnings guidance of $3.00-$3.25 per share.
public serviceenterprise group library.corporatefinance20
PSEG held an earnings conference call to discuss its fourth quarter and full-year 2008 results. For Q4 2008, PSEG reported operating earnings of $250 million compared to $272 million in Q4 2007. For the full year, operating earnings were $1,487 million compared to $1,385 million in 2007. PSEG Power's Q4 operating earnings were $207 million, matching the prior year, while PSE&G's were $76 million, down slightly from $77 million in Q4 2007. PSEG provided 2009 operating earnings guidance of $3.00-$3.25 per share.
PSEG held an earnings conference call to discuss its fourth quarter and full-year 2008 results. For the fourth quarter, PSEG reported operating earnings of $250 million compared to $272 million in the prior year quarter. For the full year, operating earnings were $1,487 million compared to $1,385 million in 2007. PSEG Power's fourth quarter operating earnings were $207 million, matching the prior year, while PSE&G's were $76 million, down slightly from $77 million in 2007. PSEG provided 2009 operating earnings guidance of $3.00-$3.25 per share.
public serviceenterprise group Investor library.corporatefinance20
PSEG held an earnings conference call to discuss its fourth quarter and full-year 2008 results. For the fourth quarter, PSEG reported operating earnings of $250 million compared to $272 million in the prior year quarter. For the full year, operating earnings were $1,487 million compared to $1,385 million in 2007. PSEG Power's fourth quarter operating earnings were $207 million, matching the prior year, while PSE&G's were $76 million, down slightly from $77 million in 2007. PSEG provided 2009 operating earnings guidance of $3.00-$3.25 per share.
Similar to celanese q4_2008_earnings_presentation (20)
Robert G. Bohn, Chairman, President and CEO of Oshkosh Truck Corporation, and Charles L. Szews, Executive VP and CFO, reported record financial results for the first quarter of fiscal year 2006. Sales increased 22.5% to $790.3 million and operating income grew 28.6% to $87 million. EPS increased 28.6% to $0.72. For fiscal year 2006, the company estimates sales between $3.3-3.4 billion, operating income between $316.5-329 million, and EPS between $2.55-2.65, representing growth of 17-21.6%.
1) Oshkosh reported record second quarter fiscal year 2006 results with sales up 25.6% and operating income up 27.3% driven by strong performance in the defense segment.
2) The defense segment results nearly doubled compared to the previous year due to growth in remanufactured and new truck sales, however challenges remain in locating used vehicle carcasses for remanufacturing.
3) The fire and emergency segment saw a temporary dip in earnings as anticipated due to heavily weighted airport product sales in the second half of the year and two component issues that delayed revenue recognition.
Robert G. Bohn, Chairman, President and CEO of Oshkosh Truck Corporation, discussed the company's strong third quarter fiscal year 2006 results and provided an outlook for fiscal years 2006 and 2007. Some highlights included record sales and operating income for Q3 2006. The company also announced two acquisitions, AK Specialty Vehicles and Iowa Mold Tooling, expected to be accretive to earnings in fiscal 2007. For fiscal 2006, Oshkosh estimates sales growth of 14.9-16.6% and EPS growth of 24-26%. Fiscal 2007 estimates include sales of $3.65-$3.75 billion and EPS of $3.05-$3.15.
Oshkosh Truck Corporation presented an investor presentation on its proposed acquisition of JLG Industries, Inc. The presentation discussed Oshkosh's track record of successful acquisitions and shareholder value creation. It also outlined the objectives of acquiring JLG to support growth above 15%, diversify into the fast-growing aerial work platform market, and execute its long-term acquisition strategy. Finally, the presentation provided an overview of Oshkosh Truck Corporation and its proven strategy of new product leadership, operational excellence, and strategic acquisitions that have fueled strong sales and earnings growth.
Robert Bohn, Chairman of Oshkosh Truck Corporation, discussed the company's strong fiscal 2006 financial results and outlook for fiscal 2007. Key points include:
1) Fiscal 2006 sales increased 15.8% and operating income grew 22%, with EPS up 26.6%.
2) The acquisition of JLG Industries was announced, which will diversify the company and support growth of over 15%.
3) Fiscal 2007 stand-alone estimates include sales of $3.65-$3.75 billion and EPS of $3.05-$3.15, with the JLG acquisition expected to be modestly accretive.
In this earnings call, Oshkosh Truck Corporation discusses its first quarter 2007 results. Sales increased 27.4% to $1.01 billion due to the acquisition of JLG Industries. Operating income decreased 3.9% to $83.6 million and EPS decreased 23.6% to $0.55. The company increased its full-year 2007 EPS estimate range to $3.15 to $3.25 per share. JLG is meeting expectations and integration is progressing well. Defense sales were lower compared to strong prior year results while fire and emergency and commercial saw strong performance.
This document summarizes an earnings conference call for Oshkosh Truck Corporation for the second quarter of fiscal year 2007. Sales increased 96.6% to $1.66 billion and operating income grew 69.1% to $134.8 million. For fiscal year 2007, the company estimates sales of $6.1-6.2 billion and operating income of $568-580 million. It also provides segment-level results and highlights for access equipment, defense, fire & emergency, and commercial.
1) Oshkosh reported strong third quarter 2007 results with sales increasing 108% to $1.85 billion and operating income up 133% to $192.7 million.
2) Access equipment and defense led the growth in sales and operating income. The acquisition of JLG was accretive to EPS by $0.35 per share.
3) For fiscal year 2007, Oshkosh estimates sales between $6.3-6.35 billion and EPS between $3.35-3.40, and for fiscal year 2008 estimates sales between $7-7.2 billion and EPS between $4.15-4.35.
The document summarizes Oshkosh Truck Corporation's fourth quarter fiscal 2007 earnings conference call. It discusses record sales and operating income for fiscal 2007. Projections are provided for fiscal 2008, estimating sales between $7.1-7.3 billion and operating income between $690-715 million. Segment performances are reviewed, with access equipment and defense highlighted as key growth drivers. Estimates are also given for interest expense, tax rates, capital expenditures and debt levels for fiscal 2008.
Oshkosh Corporation held an earnings conference call to discuss its first quarter fiscal year 2008 results. Sales increased 49% to $1.5 billion due to strong growth in access equipment and defense, while earnings per share declined 9.1% to $0.50. For fiscal year 2008, the company estimates revenue of $7.1-7.3 billion, operating income of $675-700 million, and earnings per share of $4.15-4.35. Challenging economic conditions are impacting commercial and fire & emergency segments, but global initiatives and cost reductions will support the full-year outlook.
The document summarizes Oshkosh Corporation's earnings conference call for the second quarter of fiscal year 2008. Key highlights include sales increasing 6.7% to $1.8 billion and operating income rising 24.8% to $168.2 million. EPS grew 42.6% to $0.97. While access equipment and defense saw strong demand, commercial and fire & emergency faced challenging market conditions. The company maintained its fiscal year 2008 EPS estimate range of $4.15 to $4.35.
The document summarizes Oshkosh Corporation's earnings conference call for the third quarter of fiscal year 2008. It discusses increases in sales revenue but decreases in operating income and earnings per share compared to the previous year. Several initiatives are mentioned to manage costs and cash flow in changing market conditions. Business segment results are provided, with strength in access equipment and defense but challenges in commercial and fire & emergency sectors.
This document is the transcript from Oshkosh Corporation's earnings conference call for the fourth quarter of fiscal year 2008. It discusses Oshkosh's financial results for Q4 and fiscal year 2008, including sales, operating income, earnings per share, and debt reduction. It also provides an outlook for fiscal year 2009, estimating revenues of $6.3-6.7 billion, operating income of $350-400 million, and EPS of $1.65-2.05. The transcript reviews performance and outlook for each of Oshkosh's business segments and discusses its financing plans.
Robert Bohn and David Sagehorn of Oshkosh Corporation gave a presentation at the Goldman Sachs Conference in November 2008. They discussed Oshkosh's strong financial position and actions taken to reduce costs and debt. While market conditions were volatile due to the economic downturn, Oshkosh was well positioned with backlogs in defense, fire, and refuse collection vehicles. The presentation outlined Oshkosh's segments and strategies to manage through the difficult economy.
1) The document is from a presentation given by Oshkosh executives Charles Szews and David Sagehorn at the R.W. Baird Industrial Conference on November 12, 2008.
2) Oshkosh reported sales increased 13.2% to $7.1 billion in fiscal 2008, with international sales reaching $2.1 billion. However, operating income decreased 1.5% and EPS decreased 5.9% due to non-cash impairment charges.
3) Oshkosh recently secured multiple defense contracts and sees opportunities in the domestic refuse collection vehicle market, but the current market volatility and credit crisis make fiscal 2009 projections difficult given exposure to construction and municipal spending.
Charles Szews, President and COO of Oshkosh Corporation, presented at the Cowen and Company Aerospace & Defense Conference on February 5, 2009. He discussed Oshkosh's business segments, products, competitive advantages, challenges, and actions taken in response to the economic downturn. Key points included reduced revenues and earnings in Q1 2009, cost reduction efforts, and focus on core businesses with strong backlogs like defense and fire apparatus that have gained market share.
Oshkosh Corporation held an earnings conference call to discuss its first quarter fiscal year 2008 results. Sales increased 49% to $1.5 billion due to strong growth in access equipment and defense, while earnings per share declined 9.1% to $0.50. For fiscal year 2008, the company estimates revenue of $7.1-7.3 billion, operating income of $675-700 million, and earnings per share of $4.15-4.35. Challenging economic conditions are impacting commercial and fire & emergency segments, but global initiatives and cost reductions will support the full-year outlook.
The document summarizes Oshkosh Corporation's earnings conference call for the second quarter of fiscal year 2008. Key highlights include sales increasing 6.7% to $1.8 billion and operating income rising 24.8% to $168.2 million. EPS grew 42.6% to $0.97. While access equipment and defense saw strong demand, commercial and fire & emergency faced challenging market conditions. The company maintained its fiscal year 2008 EPS estimate range of $4.15 to $4.35.
This document contains the transcript from Oshkosh Corporation's earnings conference call for the third quarter of fiscal year 2008. Key highlights include a 6.6% increase in quarterly sales to $1.97 billion but a 5.9% decrease in operating income to $181.2 million. EPS for the quarter decreased 1.7% to $1.19. Oshkosh revised its estimate for full year 2008 EPS to a range of $3.15 to $3.30.
This document summarizes an earnings conference call for Oshkosh Corporation for the fourth quarter of fiscal year 2008. It discusses the company's financial results including a 5.8% increase in sales to $1.9 billion but a 32% decrease in operating income to $122 million. The document also provides an overview of Oshkosh's fiscal year 2008 results and discusses challenges faced in various business segments due to economic conditions. It notes actions taken by the company to reduce costs and debt. An outlook is given for fiscal year 2009 noting market volatility and a plan to drive over $500 million in debt reduction. Business segment results and outlooks are also summarized.
Vicinity Jobs’ data includes more than three million 2023 OJPs and thousands of skills. Most skills appear in less than 0.02% of job postings, so most postings rely on a small subset of commonly used terms, like teamwork.
Laura Adkins-Hackett, Economist, LMIC, and Sukriti Trehan, Data Scientist, LMIC, presented their research exploring trends in the skills listed in OJPs to develop a deeper understanding of in-demand skills. This research project uses pointwise mutual information and other methods to extract more information about common skills from the relationships between skills, occupations and regions.
Abhay Bhutada, the Managing Director of Poonawalla Fincorp Limited, is an accomplished leader with over 15 years of experience in commercial and retail lending. A Qualified Chartered Accountant, he has been pivotal in leveraging technology to enhance financial services. Starting his career at Bank of India, he later founded TAB Capital Limited and co-founded Poonawalla Finance Private Limited, emphasizing digital lending. Under his leadership, Poonawalla Fincorp achieved a 'AAA' credit rating, integrating acquisitions and emphasizing corporate governance. Actively involved in industry forums and CSR initiatives, Abhay has been recognized with awards like "Young Entrepreneur of India 2017" and "40 under 40 Most Influential Leader for 2020-21." Personally, he values mindfulness, enjoys gardening, yoga, and sees every day as an opportunity for growth and improvement.
TEST BANK Principles of cost accounting 17th edition edward j vanderbeck mari...Donc Test
TEST BANK Principles of cost accounting 17th edition edward j vanderbeck maria r mitchell.docx
Every business, big or small, deals with outgoing payments. Whether it’s to suppliers for inventory, to employees for salaries, or to vendors for services rendered, keeping track of these expenses is crucial. This is where payment vouchers come in – the unsung heroes of the accounting world.
An accounting information system (AIS) refers to tools and systems designed for the collection and display of accounting information so accountants and executives can make informed decisions.
Optimizing Net Interest Margin (NIM) in the Financial Sector (With Examples).pdfshruti1menon2
NIM is calculated as the difference between interest income earned and interest expenses paid, divided by interest-earning assets.
Importance: NIM serves as a critical measure of a financial institution's profitability and operational efficiency. It reflects how effectively the institution is utilizing its interest-earning assets to generate income while managing interest costs.
Enhancing Asset Quality: Strategies for Financial Institutionsshruti1menon2
Ensuring robust asset quality is not just a mere aspect but a critical cornerstone for the stability and success of financial institutions worldwide. It serves as the bedrock upon which profitability is built and investor confidence is sustained. Therefore, in this presentation, we delve into a comprehensive exploration of strategies that can aid financial institutions in achieving and maintaining superior asset quality.
South Dakota State University degree offer diploma Transcriptynfqplhm
办理美国SDSU毕业证书制作南达科他州立大学假文凭定制Q微168899991做SDSU留信网教留服认证海牙认证改SDSU成绩单GPA做SDSU假学位证假文凭高仿毕业证GRE代考如何申请南达科他州立大学South Dakota State University degree offer diploma Transcript
Economic Risk Factor Update: June 2024 [SlideShare]Commonwealth
May’s reports showed signs of continued economic growth, said Sam Millette, director, fixed income, in his latest Economic Risk Factor Update.
For more market updates, subscribe to The Independent Market Observer at https://blog.commonwealth.com/independent-market-observer.
Fabular Frames and the Four Ratio ProblemMajid Iqbal
Digital, interactive art showing the struggle of a society in providing for its present population while also saving planetary resources for future generations. Spread across several frames, the art is actually the rendering of real and speculative data. The stereographic projections change shape in response to prompts and provocations. Visitors interact with the model through speculative statements about how to increase savings across communities, regions, ecosystems and environments. Their fabulations combined with random noise, i.e. factors beyond control, have a dramatic effect on the societal transition. Things get better. Things get worse. The aim is to give visitors a new grasp and feel of the ongoing struggles in democracies around the world.
Stunning art in the small multiples format brings out the spatiotemporal nature of societal transitions, against backdrop issues such as energy, housing, waste, farmland and forest. In each frame we see hopeful and frightful interplays between spending and saving. Problems emerge when one of the two parts of the existential anaglyph rapidly shrinks like Arctic ice, as factors cross thresholds. Ecological wealth and intergenerational equity areFour at stake. Not enough spending could mean economic stress, social unrest and political conflict. Not enough saving and there will be climate breakdown and ‘bankruptcy’. So where does speculative design start and the gambling and betting end? Behind each fabular frame is a four ratio problem. Each ratio reflects the level of sacrifice and self-restraint a society is willing to accept, against promises of prosperity and freedom. Some values seem to stabilise a frame while others cause collapse. Get the ratios right and we can have it all. Get them wrong and things get more desperate.
1. Celanese 4Q 2008 Earnings
Conference Call / Webcast
Tuesday, February 3, 2009 9:00 a.m. ET
Dave Weidman, Chairman and CEO
Steven Sterin, Senior Vice President and CFO
1
2. Forward Looking Statements, Reconciliation and Use of Non-
GAAP Measures to U.S. GAAP
Forward-Looking Statements
This presentation may contain “forward-looking statements,” which include information concerning the company’s plans, objectives, goals, strategies, future revenues or performance, capital expenditures, financing
needs and other information that is not historical information. When used in this release, the words “outlook,” “forecast,” “estimates,” “expects,” “anticipates,” “projects,” “plans,” “intends,” “believes,” and variations of
such words or similar expressions are intended to identify forward-looking statements. All forward-looking statements are based upon current expectations and beliefs and various assumptions. There can be no
assurance that the company will realize these expectations or that these beliefs will prove correct. There are a number of risks and uncertainties that could cause actual results to differ materially from the forward-
looking statements contained in this release. Numerous factors, many of which are beyond the company’s control, could cause actual results to differ materially from those expressed as forward-looking statements.
Certain of these risk factors are discussed in the company’s filings with the Securities and Exchange Commission. Any forward-looking statement speaks only as of the date on which it is made, and the company
undertakes no obligation to update any forward-looking statements to reflect events or circumstances after the date on which it is made or to reflect the occurrence of anticipated or unanticipated events or
circumstances.
Reconciliation of Non-U.S. GAAP Measures to U.S. GAAP
This presentation reflects five performance measures, operating EBITDA, affiliate EBITDA, adjusted earnings per share, net debt and adjusted free cash flow, as non-U.S. GAAP measures. The most directly
comparable financial measure presented in accordance with U.S. GAAP in our consolidated financial statements for operating EBITDA is operating profit; for affiliate EBITDA is equity in net earnings of affiliates; for
adjusted earnings per share is earnings per common share-diluted; for net debt is total debt; and for adjusted free cash flow is cash flow from operations.
Use of Non-U.S. GAAP Financial Information
EBITDA, a measure used by management to measure performance, is defined as operating profit from continuing operations, plus equity in net earnings from affiliates, other income and depreciation and
►Operating
amortization, and further adjusted for other charges and adjustments. We provide guidance on operating EBITDA and are unable to reconcile forecasted operating EBITDA to a GAAP financial measure because a
forecast of Other Charges and Adjustments is not practical. Our management believes operating EBITDA is useful to investors because it is one of the primary measures our management uses for its planning and
budgeting processes and to monitor and evaluate financial and operating results. Operating EBITDA is not a recognized term under U.S. GAAP and does not purport to be an alternative to operating profit as a
measure of operating performance or to cash flows from operating activities as a measure of liquidity. Because not all companies use identical calculations, this presentation of operating EBITDA may not be
comparable to other similarly titled measures of other companies. Additionally, operating EBITDA is not intended to be a measure of free cash flow for management’s discretionary use, as it does not consider certain
cash requirements such as interest payments, tax payments and debt service requirements nor does it represent the amount used in our debt covenants.
►Affiliate EBITDA, a measure used by management to measure performance of its equity investments, is defined as the proportional operating profit plus the proportional depreciation and amortization of its equity
investments. Affiliate EBITDA, including Celanese Proportional Share of affiliate information on Table 8, is not a recognized term under U.S. GAAP and is not meant to be an alternative to operating cash flow of the
equity investments. The company has determined that it does not have sufficient ownership for operating control of these investments to consider their results on a consolidated basis. The company believes that
investors should consider affiliate EBITDA when determining the equity investments’ overall value in the company.
►Adjusted earnings per share is a measure used by management to measure performance. It is defined as net earnings (loss) available to common shareholders plus preferred dividends, adjusted for other charges
and adjustments, and divided by the number of basic common shares, diluted preferred shares, and options valued using the treasury method. We provide guidance on an adjusted earnings per share basis and are
unable to reconcile forecasted adjusted earnings per share to a GAAP financial measure without unreasonable effort because a forecast of Other Items is not practical. We believe that the presentation of this non-
U.S. GAAP measure provides useful information to management and investors regarding various financial and business trends relating to our financial condition and results of operations, and that when U.S. GAAP
information is viewed in conjunction with non-U.S. GAAP information, investors are provided with a more meaningful understanding of our ongoing operating performance. This non-U.S. GAAP information is not
intended to be considered in isolation or as a substitute for U.S. GAAP financial information.
►The tax rate used for adjusted earnings per share is the tax rate based on our initial guidance, less changes in uncertain tax positions. We adjust this tax rate during the year only if there is a substantial change in
our underlying operations; an updated forecast would not necessarily result in a change to our tax rate used for adjusted earnings per share. The adjusted tax rate may differ significantly from the tax rate used for
U.S. GAAP reporting in any given reporting period. It is not practical to reconcile our prospective adjusted tax rate to the actual U.S. GAAP tax rate in any future period.
►Net debt is defined as total debt less cash and cash equivalents. We believe that the presentation of this non-U.S. GAAP measure provides useful information to management and investors regarding changes to
the company’s capital structure. Our management and credit analysts use net debt to evaluate the company's capital structure and assess credit quality. This non-U.S. GAAP information is not intended to be
considered in isolation or as a substitute for U.S. GAAP financial information
►Adjusted free cash flow is defined as cash flow from operations less capital expenditures, other productive asset purchases, operating cash from discontinued operations and certain other charges and adjustments.
We believe that the presentation of this non-U.S. GAAP measure provides useful information to management and investors regarding changes to the company’s cash flow. Our management and credit analysts use
adjusted free cash flow to evaluate the company’s liquidity and assess credit quality. This non-U.S. GAAP information is not intended to be considered in isolation or as a substitute for U.S. GAAP financial
information.
Results Unaudited
The results presented in this presentation, together with the adjustments made to present the results on a comparable basis, have not been audited and are based on internal financial data furnished to management.
Quarterly results should not be taken as an indication of the results of operations to be reported for any subsequent period or for the full fiscal year.
2
3. Dave Weidman
Chairman and Chief Executive Officer
3
4. Celanese Corporation 4Q and full year
2008 highlights
4th Qtr 4th Qtr
in millions (except EPS) FY 2008 FY 2007
2008 2007
Net Sales $1,760 $6,444
$1,286 $6,823
Operating Profit/(Loss) $324 $748
($152) $440
Adjusted EPS $0.93 $3.29
($0.38) $2.77
Operating EBITDA $349 $1,294
$68 $1,169
Fourth Quarter 2008:
► Significant cash generation
► Inventory accounting impact of ~$0.48/share1 included in Adjusted
EPS
Note: All 2007 figures exclude results of the divested Oxo Alcohol business and the discontinued Edmonton Methanol business.
4 1 $101 million inventory accounting impact tax effected at 26% divided by 155.9 million diluted shares for the three months ended December 31, 2008.
5. Peak and trough relative performance
Relative Peak versus Trough Quarter – Operating EBIDTA
Acetyl Intermediates
Advanced Engineered Materials
Industrial Specialties
Consumer Specialties
Other Activities
18 – 20%
Operating EBITDA
Impacting Factors
Seasonality
►
13 – 15%
22 – 25%
18 – 20%
Inventory accounting
►
8 – 10% 10 – 12%
impacts
21 – 23%
20 – 22%
Customer destocking
►
Normalized Normalized
Peak Conditions Trough Conditions
Trough defined as four quarters of sustained -1% to 1% global GDP
5 Note: Earnings from strategic affiliates included in total Operating EBITDA amounts but excluded from margin % amounts
6. Advantaged technology and cost position
2009E Acetic Acid Cost Curve (kt) (based on nameplate capacity)
Ethanol
Ethylene
Acetyl
Highest Cost
Intermediates
China MeOH
>15% ROIC
Lower Cost
China MeOH
Avg Non-China
MeOH Carbonylation
Average Celanese Avg Other Leading
Technology
By Prod
0% 15% 30% 45% 60% 75% 90%
Assumes Oil
Effective Industry Utilization Rates
at $60/barrel
6 Source: Celanese estimates, available public data
8. Celanese Corporation financial
highlights
4th Qtr 4th Qtr FY 2008 FY 2007
2008 2007
in millions (except EPS)
Net Sales $1,760 $6,444
$1,286 $6,823
Operating Profit/(Loss) $324 $748
($152) $440
Net Earnings/(Loss) $214 $426
($159) $278
Other Charges/Adjustments $105 ($93) $171 $82
Adjusted EPS $0.93 $3.29
($0.38) $2.77
Effective Tax Rate 26% 28% 26% 28%
Diluted Share Basis 143.5 168.6 163.5 171.2
Operating EBITDA $349 $1,294
$68 $1,169
FY 2008
4Q 2008
4Q 2008 net sales decreased 27% on significant FY 2008 net sales increased 6% on higher
► ►
volume declines pricing and favorable currency across all
businesses
► Weak global demand
Operating profit decreased 41% to $440 million
► Unprecedented inventory destocking ►
and includes ~$166 million in asset impairment
Operating profit was a loss of $152 million due
►
charges and other restructuring costs
to lower volumes, inventory accounting impacts
Adjusted EPS down 16% to $2.77/share
of ~$101 million and ~$94 million of asset ►
impairment charges Operating EBITDA decreased 10% to $1,169
►
million reflecting the impacts of destocking,
Adjusted EPS fell to ($0.38)/share
►
inventory accounting and weak global demand
Operating EBITDA decreased to $68 million
►
during the fourth quarter
8
9. Consumer Specialties
4th Qtr 4th Qtr FY FY
in millions 2008 2007 2008 2007
Net Sales $279 $1,111
$286 $1,155
Operating EBITDA $57 $274
$65 $293
Fourth Quarter 2008:
► Net sales increase primarily driven by higher pricing which more than offset
lower volumes and unfavorable currency
► Easing raw material and energy costs resulted in margin expansion
► Operating EBITDA improvement demonstrates sustained earnings
performance during challenging economic environment
Outlook:
► Stable volumes expected in 2009
► Continued margin expansion with ongoing decreases in energy and raw
material costs
9
10. Industrial Specialties
4th Qtr 4th Qtr FY FY
in millions 2008 2007 2008 2007
Net Sales $331 $1,346
$277 $1,406
Operating EBITDA $41 $119
$8 $117
Fourth Quarter 2008:
► Net sales decrease primarily driven by lower volumes and unfavorable
currency effects
► Higher pricing helped to offset significant volume declines
► Inventory accounting impacts ($15 million) and lower volumes primary
reason for decrease in Operating EBITDA
Outlook:
► Volumes in North America and Europe remain challenged
► Continued success in Asia and new product development help offset volume
weakness
► Raw material and energy cost reductions should positively impact margins
10
11. Advanced Engineered Materials
4th Qtr 4th Qtr FY FY
in millions 2008 2007 2008 2007
Net Sales $253 $1,061 $1,030
$195
Operating EBITDA $45 $252
($3) $170
Fourth Quarter 2008:
► Net sales decreased as positive pricing actions and improved mix could not
offset significant volume pressures
► Substantial reductions in US and European automotive production but only
modest declines in many non-automotive applications
► Operating EBITDA loss due to lower volumes, inventory accounting impacts
($23 million) and lower affiliate earnings
Outlook:
► Continued volume pressures due to further reductions in US and Europe
auto builds
► Easing raw material and energy costs coupled with higher pricing should
positively impact margins
11
12. Acetyl Intermediates
4th Qtr 4th Qtr FY FY
in millions 2008 2007 2008 2007
Net Sales $1,083 $3,875 $3,615
$656
Operating EBITDA $231 $731
$21 $676
Fourth Quarter 2008:
► Decrease in net sales due to substantial volume declines and lower pricing
► Global recessionary trends and unprecedented inventory destocking drove
decreased volumes
► Lower raw material and energy costs could not offset lower volumes and
inventory accounting impacts ($63 million)
► Dividends from the Ibn Sina contributed $29 million to Operating EBITDA
Outlook:
► Once destocking moderates, volumes expected to be at reduced levels in-
line with weaker global demand
► Margins should stabilize in 2009 due to advantaged technology and cost
position
12
13. Affiliates continue to deliver significant
value
4Q 2008: Earnings impact of $37 million modestly down versus prior year;
►
Cash flows relatively flat for the period
FY 2008: Total earnings impact relatively flat year over year; Increased cash
►
flows driven by higher dividends from cost affiliates
Outlook: cost and equity affiliates challenged by weakened global demand
►
environment
Income Statement Cash Flows
200 200
150 150
$ millions
$ millions
100 100
50 50
0
0
4Q 2007 4Q 2008 FY 2007 FY 2008
Earnings - Equity Investments Dividends - Cost Investments Dividends - Equity Investments Dividends - Cost Investments
13
14. Celanese capital structure
Primary Components Structure Characteristics
Cash - $676 million
Sources of Liquidity
Credit Linked Revolver -
Cost
$137 million
Revolver - $650 million
Advance Fraport Payment
~$415 million Stability
Debt Obligations
Term Loan - $2.8 billion
Other Debt Obligations -
Flexibility
$739 million
Net Debt* - $2.4 billion
Strong balance sheet provides flexibility and stability in current environment
14 Represents proforma net debt including receipt of advance payment from Fraport.
*
15. Solid cash generation
Adjusted Free Cash Flow
FY2008 FY2007
$ in millions
Net cash provided by operating activities $566
$568
Adjustments to operating cash for discontinued operations $84
($3)
Net cash provided by operating activities from continuing operations $650
$565
Less: Capital expenditures $288
$274
Add: Other charges and adjustments1 $23
$76
Adjusted Free Cash Flow $367 $385
Factors contributing to cash generation during 2008:
► Favorable trade working capital helped to offset lower operating performance
► Increased dividends from cost affiliates
► Lower cash taxes
► One additional interest payment versus prior year (due to timing of refinancing)
► Growth from strategic investments in Asia
1Amounts primarily associated with certain other charges and adjustments and the cash outflows for purchases of other productive assets that are classified as ‘investing activities’
15
for U.S. GAAP purposes.
16. 2009 cash flow elements
Elements of Cash Flows* Assumptions
$ in millions
Cash Taxes $80 - $120
Cash taxes expected to align
►
Capital Expenditures $150 - $175
with adjusted earnings profile
Productivity improvements
Reserve Spending $50 - $60 ►
and cost reduction programs
Net Interest $220 - $230
remain a priority
Pension $50 - $60
Available funding credits to
►
significantly offset required
Dividends/Debt Service $80 - $90
pension contributions over
Kelsterbach Relocation $350 - $370
the next two years
Fraport Advance Payment ~$415
Starting from an Operating EBITDA base.
*
16
17. Continued financial flexibility
Long-Term Debt Repayment Stable, Flexible & Low Cost
Advantages of structure:
►
3,000
► LIBOR +150 – 175 bps
► Term loan maturity not until 2014
$ in millions
► 1% annual term loan
amortization
► “Covenant-lite”
– no financial
maintenance covenants on term
100
loan
Net debt is ~75% fixed with a
►
2008 average borrowing cost of
~6.96%
2009 2010 2011 2012 2013 Thereafter
17
19. 4Q 2008 Other Charges and Other Adjustments
by Segment
$ in millions AEM CS IS AI Other Total
Employee termination benefits - 1 (1) 2 - 2
Ticona Kelsterbach relocation 4 - - - - 4
Clear Lake insurance recoveries - - - (15) - (15)
Asset impairments 16 - - 78 - 94
Other - - - (1) - (1)
Total other charges 20 1 (1) 64 - 84
Business optimization - 1 1 - 4 6
Ticona Kelsterbach relocation 2 - - - - 2
Plant closures - - 2 7 - 9
Other - - - 4 - 4
Total other adjustments 2 1 3 11 4 21
Total other charges and 22 2 2 75 4 105
other adjustments
19
20. Reg G: Reconciliation of Adjusted EPS
Adjusted Earnings (Loss) Per Share - Reconciliation of a Non-U.S. GAAP Measure
Three Months Ended Twelve Months Ended
December 31, December 31,
2008 2007 2008 2007
(in $ millions, except per share data)
Earnings (loss) from continuing operations
313 447
before tax and minority interests (178) 439
Non-GAAP Adjustments:
1
Other charges and other adjustments (93) 82
105 171
- 254
Refinancing costs - -
Adjusted Earnings (loss) from continuing operations
220 783
before tax and minority interests (73) 610
2
Income tax (provision) benefit on adjusted earnings (62) (219)
19 (159)
(1)
Minority interests (1)
- 1
Adjusted Earnings (loss) from continuing operations (54) 157 452 563
Preferred dividends (3) (10)
(2) (10)
Adjusted net earnings (loss) available to common shareholders (56) 154 442 553
Add back: Preferred dividends 3 10
2 10
Adjusted net earnings (loss) for adjusted EPS (54) 157 452 563
Diluted shares (millions)
Weighted average shares outstanding 151.7 154.5
143.5 148.4
12.0
Assumed conversion of Preferred Shares 12.0 12.0
-
0.3
Assumed conversion of Restricted Stock 0.6 0.5
-
4.3 4.4
Assumed conversion of stock options 2.6
-
Total diluted shares 168.6 171.2
143.5 163.5
Adjusted EPS (0.38) 0.93 2.77 3.29
1
See Table 7 for details
2
The adjusted tax rate for the three and twelve months ended December 31, 2008 is 26% based on the forecasted adjusted tax rate for 2008.
3
The impact of inventory accounting adjustments on Adjusted EPS is $0.48 calculated as $101 million tax effected at 26% divided by 155.9 million diluted shares for the
three months ended December 31, 2008.
20
21. Reg G: Reconciliation of Net Debt
Net Debt - Reconciliation of a Non-U.S. GAAP Measure
December 31, December 31,
2008 2007
(in $ millions)
Short-term borrowings and current
installments of long-term debt - third party and affiliates 272
233
Long-term debt 3,284
3,300
Total debt 3,533 3,556
Less: Cash and cash equivalents 825
676
Net Debt 2,857 2,731
21
22. Reg G: Other Charges and Other Adjustments
Reconciliation of Other Charges and Other Adjustments
Other Charges:
Three Months Ended Twelve Months Ended
December 31, December 31,
(in $ millions) 2008 2007 2008 2007
32
Employee termination benefits 5
2 21
11
Plant/office closures 7 7
-
(4)
Insurance recoveries associated with plumbing cases (2) -
-
74
Long-term compensation triggered by Exit Event - -
-
9
Asset impairments - 115
94
(40)
Clear Lake insurance recoveries (40) (38)
(15)
(31)
Resolution of commercial disputes with a vendor (31) -
-
-
Sorbates settlement - (8)
-
Ticona Kelsterbach plant relocation 1 5
4 12
-
Other 2
(1)
(1)
Total 84 (60) 108 58
1
Other Adjustments:
Three Months Ended Twelve Months Ended Income
December 31, December 31, Statement
Classification
(in $ millions) 2008 2007 2008 2007
Ethylene pipeline exit costs - 10 Other income (expense), net
- (2)
8
Business optimization 18 SG&A
6 33
-
Foreign exchange loss related to refinancing transaction 22 Other income (expense), net
- -
-
Ticona Kelsterbach plant relocation - Cost of sales
2 (4)
-
Plant closures - Cost of sales
9 23
AT Plastics films sale - 7 Gain on disposition
- -
Gain on Edmonton sale (34) (34) Gain on disposition
- -
(7)
Other 1 Various
4 13
21 (33) 63 24
Total
105 (93) 171 82
Total other charges and other adjustments
1
These items are included in net earnings but not included in other charges.
22
23. 23
Segment Data and Reconciliation of Operating Profit (Loss) to Operating EBITDA -
a Non-U.S. GAAP Measure
Three Months Ended Twelve Months Ended
December 31, December 31,
(in $ millions) 2008 2007 2008 2007
Net Sales
195 1,061
Advanced Engineered Materials 253 1,030
286 1,155
Consumer Specialties 279 1,111
277 1,406
Industrial Specialties 331 1,346
656 3,875
Acetyl Intermediates 1,083 3,615
1
Other Activities 1 2
0 2
(129) (676)
Intersegment eliminations (186) (660)
Total 1,286 1,760 6,823 6,444
Operating Profit (Loss)
(48) 32
Advanced Engineered Materials 30 133
52 190
Consumer Specialties 69 199
(8) 47
Industrial Specialties 26 28
(116) 309
Acetyl Intermediates 276 616
1
Other Activities (32) (138)
(77) (228)
Total (152) 324 440 748
Equity Earnings, Cost - Dividend Income and Other Income (Expense)
5 37
Advanced Engineered Materials 7 55
(2) 47
Consumer Specialties 3 40
- -
Industrial Specialties - -
30 125
Acetyl Intermediates 27 78
1
Other Activities 3 20
8 -
Total 36 45 229 173
Other Charges and Other Adjustments 2
22 25
Advanced Engineered Materials (10) (5)
2 3
Consumer Specialties (27) (16)
2 13
Industrial Specialties (1) 32
75 108
Acetyl Intermediates (97) (69)
1
Other Activities 4 22
42 140
Total 105 (93) 171 82
Depreciation and Amortization Expense
18 76
Advanced Engineered Materials 18 69
13 53
Consumer Specialties 12 51
14 57
Industrial Specialties 16 59
32 134
Acetyl Intermediates 25 106
1
Other Activities 2 6
9
2
Total 79 73 329 291
Reg G: Reconciliation of Operating EBITDA
Operating EBITDA
(3) 170
Advanced Engineered Materials 45 252
65 293
Consumer Specialties 57 274
8 117
Industrial Specialties 41 119
21 676
Acetyl Intermediates 231 731
1
Other Activities (23) (87)
(25) (82)
Total 68 349 1,169 1,294
1
Other Activities primarily includes corporate selling, general and administrative expenses and the results from captive insurance companies.
2
See Table 7.
24. Reg G: Equity Affiliate Preliminary Results and
Celanese Proportional Share - Unaudited
Equity Affiliate Preliminary Results - Celanese Proportional Share - Unaudited4
Equity Affiliate Preliminary Results - Total - Unaudited
Three Months Ended Twelve Months Ended
(in $ millions) December 31, December 31,
2008 2007 2008 2007
2008 2007 2008 2007 Net Sales
Net Sales Ticona Affiliates 155 587
127 642
Ticona Affiliates1 336 1,270 Infraserv 199 587
173 722
277 1,394
Infraserv2 Total 300 354 1,364 1,174
623 1,798
537 2,243
Total 814 959 3,637 3,068 Operating Profit
Ticona Affiliates 19 89
8 61
Operating Profit Infraserv 9 29
9 34
Ticona Affiliates 40 188
17 133 Total 17 28 95 118
Infraserv 26 87
19 98
Depreciation and Amortization
Total 36 66 231 275
Ticona Affiliates 8 26
10 35
Infraserv 11 31
6 34
Depreciation and Amortization
Total 16 19 69 57
Ticona Affiliates 17 56
22 76
Affiliate EBITDA3
Infraserv 26 87
21 106
Ticona Affiliates 27 115
18 96
Total 43 43 182 143
Infraserv 20 59
15 68
Total
Affiliate EBITDA3 33 47 164 174
Ticona Affiliates 57 244
39 209 Equity in net earnings of affiliates (as reported on the Income Statement)
Infraserv 52 174 Ticona Affiliates 9 56
4 35
40 204
Infraserv 8 26
Total 4 19
79 109 413 418
Total 8 17 54 82
Net Income
Affiliate EBITDA in excess of Equity in net earnings of affiliates5
Ticona Affiliates 21 119
10 77
Ticona Affiliates 18 59
14 61
Infraserv 18 77
6 55
Infraserv 12 33
11 49
Total 16 39 132 196
Total 25 30 110 92
Net Debt Net Debt
Ticona Affiliates 208 208
216 216 Ticona Affiliates 96 96
98 98
Infraserv 39 39 Infraserv 20 20
160 160
508 508
Total 258 116 258 116
Total 724 247 724 247
1
Ticona Affiliates includes Polyplastics (45% ownership), Korean Engineering Plastics (50%), Fortron Industries (50%), and Una SA (50%)
2
Infraserv includes Infraserv Entities valued as equity investments (Infraserv Höchst - 31% ownership, Infraserv Gendorf - 39% and Infraserv Knapsack 28%)
3
Affiliate EBITDA is the sum of Operating Profit and Depreciation and Amortization, a non-U.S. GAAP measure
4
Calculated as the product of figures from the above table times Celanese ownership percentage
5
Product of Celanese proportion of Affiliate EBITDA less Equity in net earnings of affiliates; not included in Celanese operating EBITDA
24