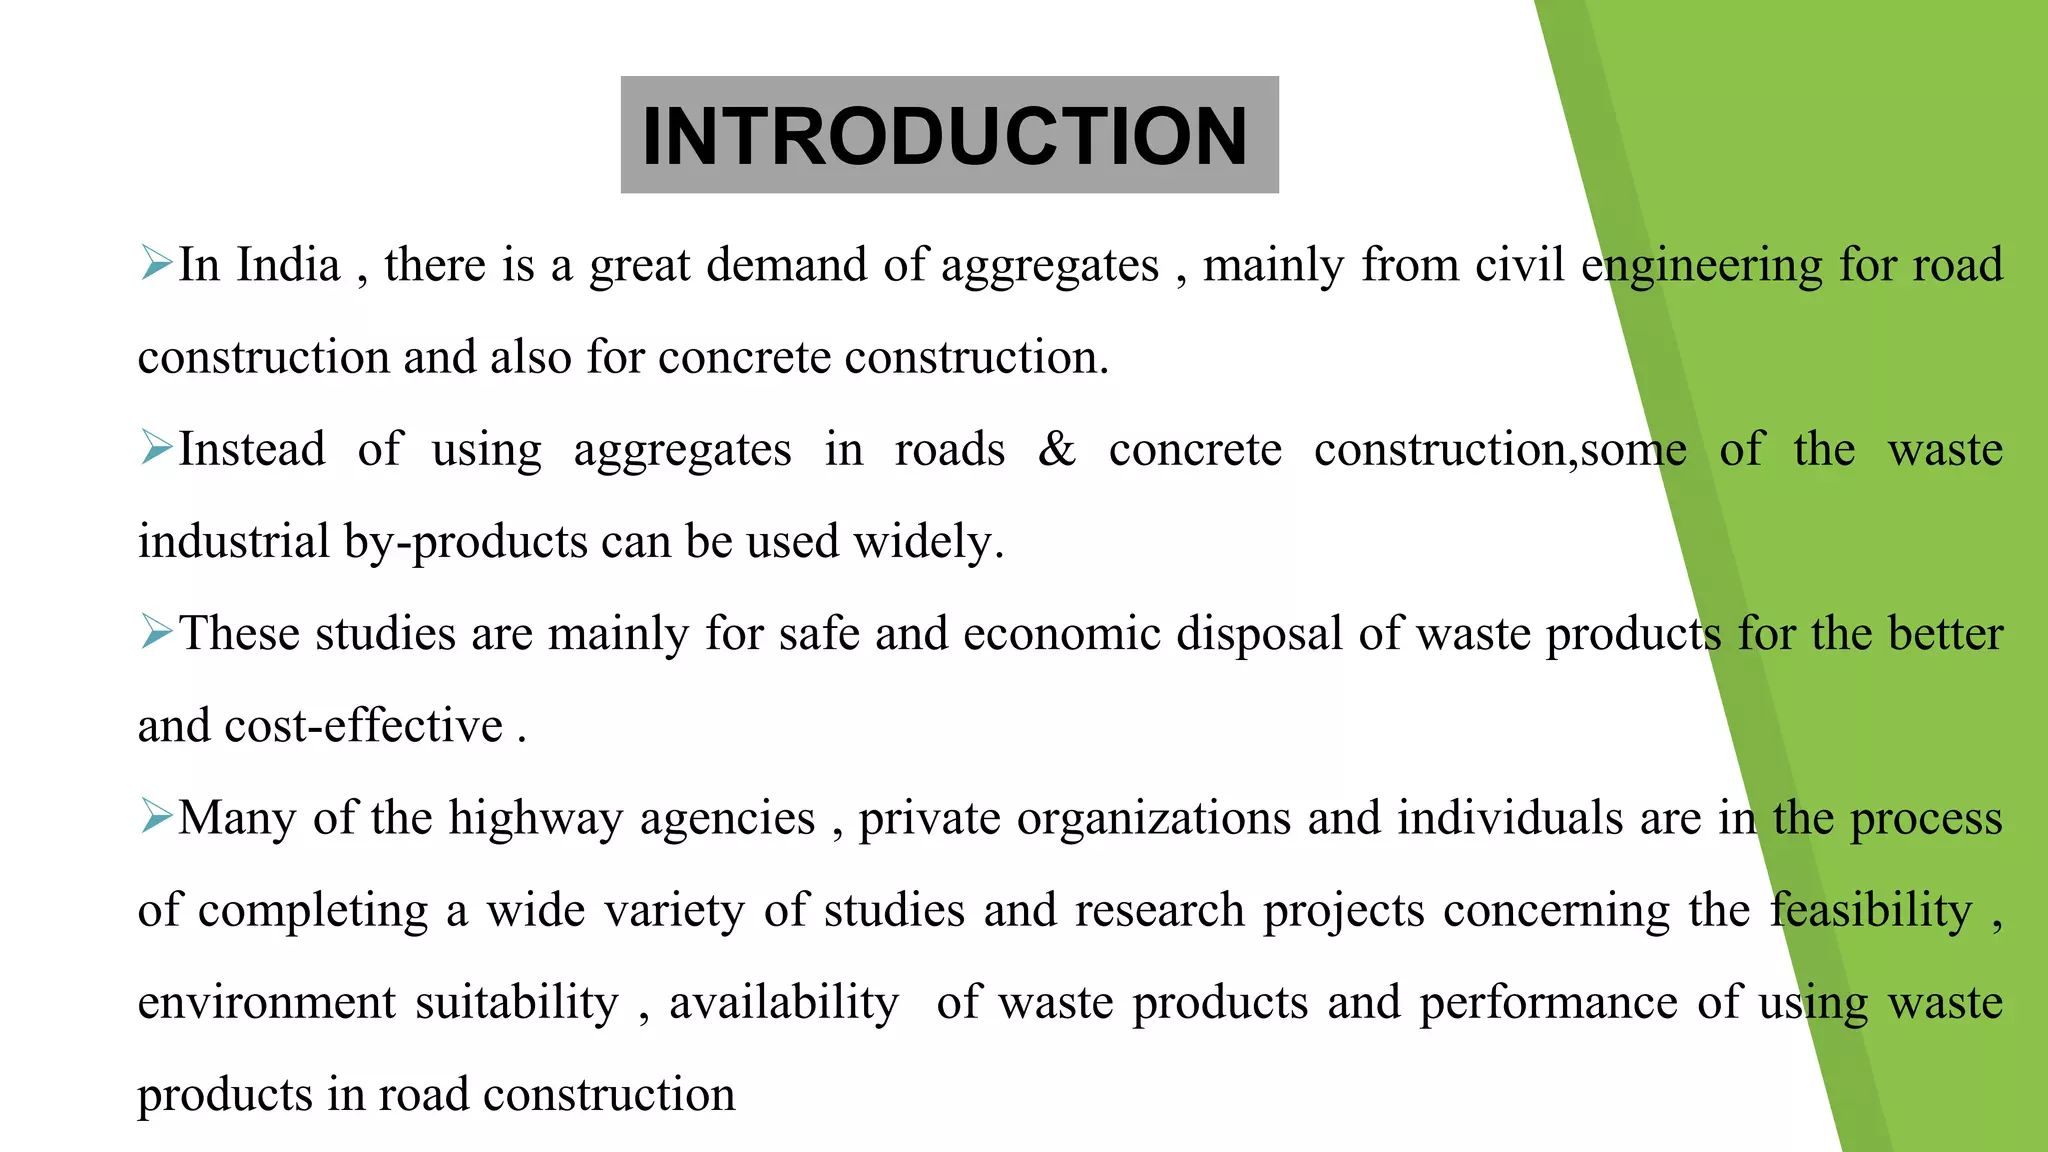
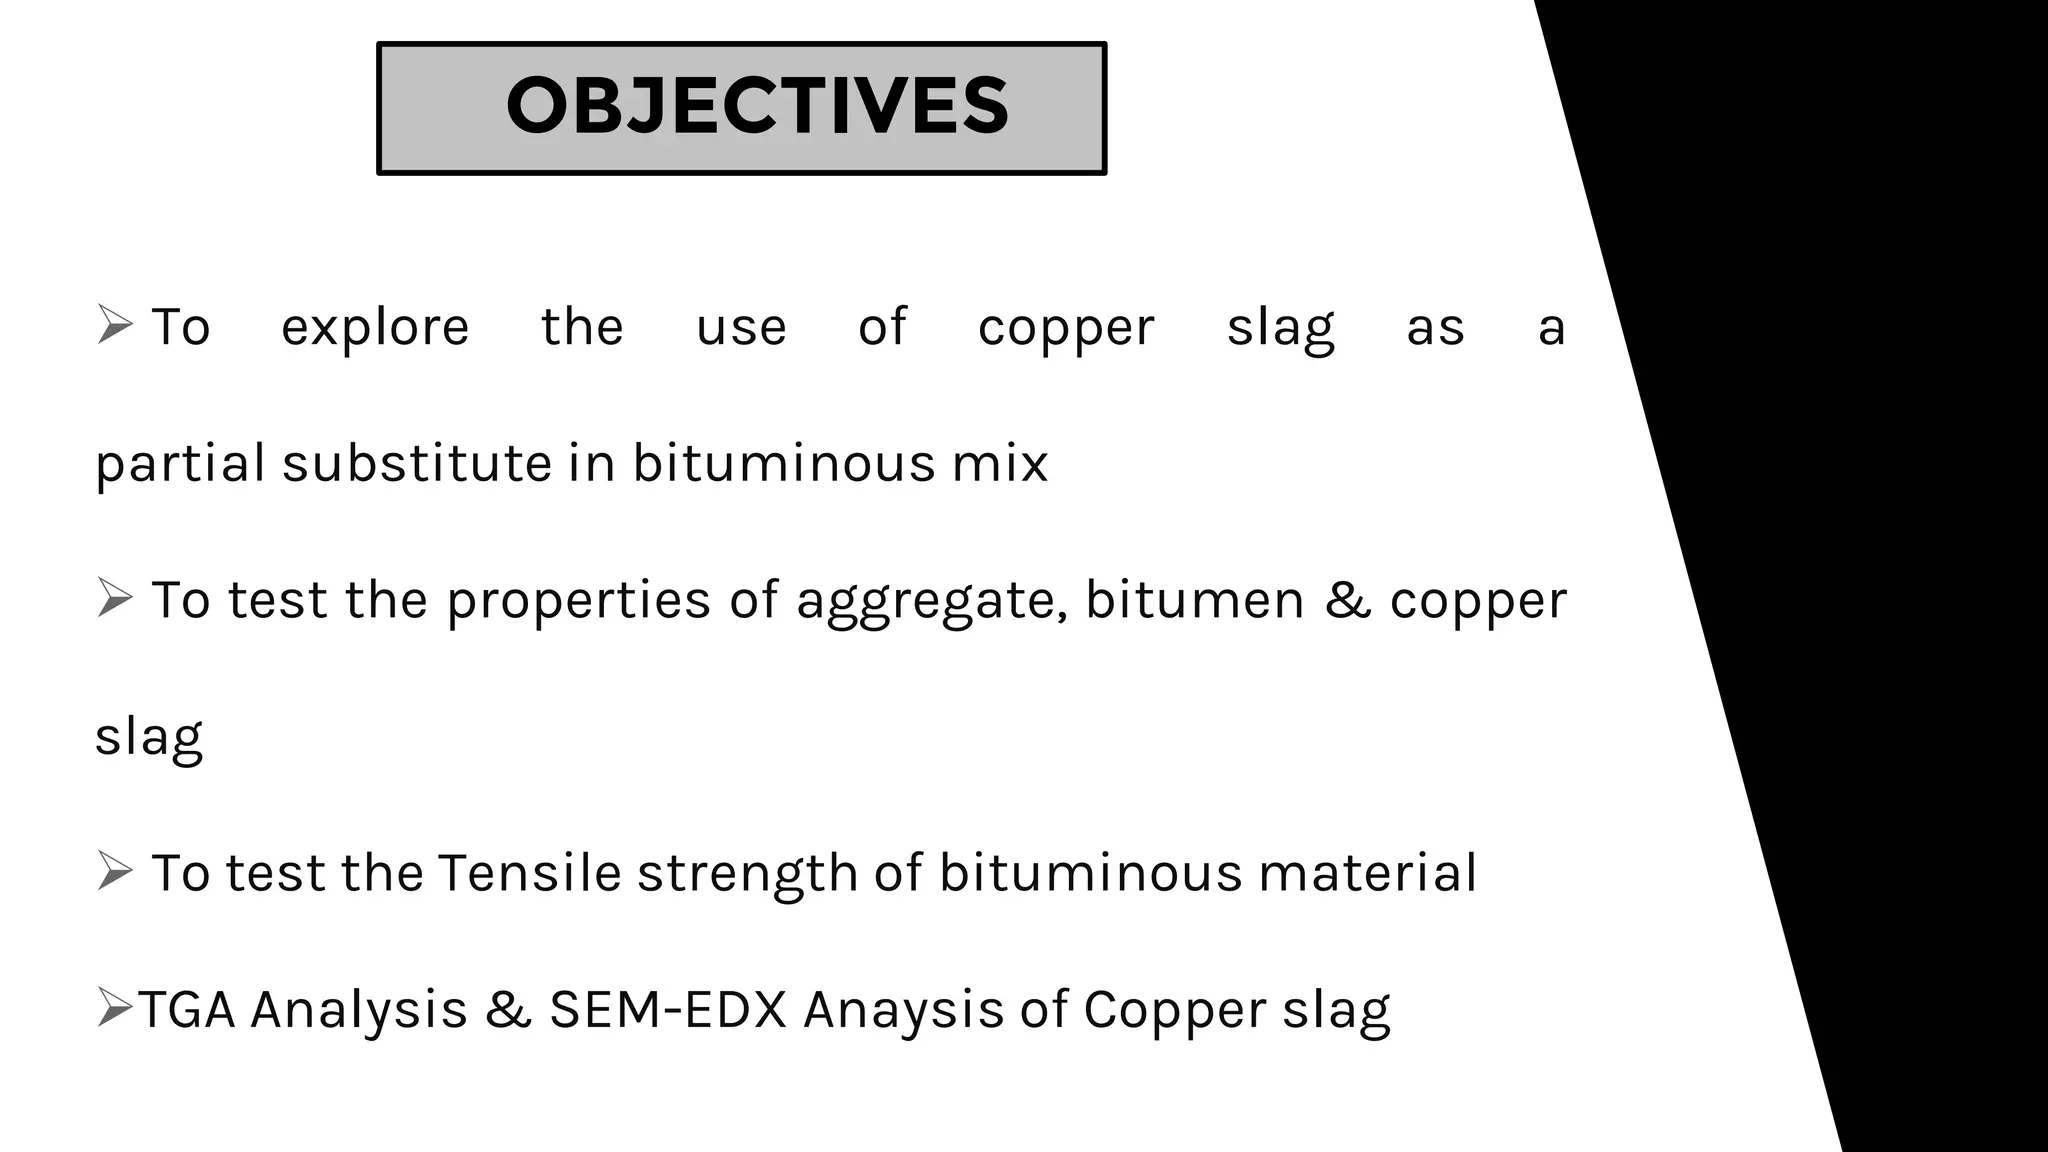
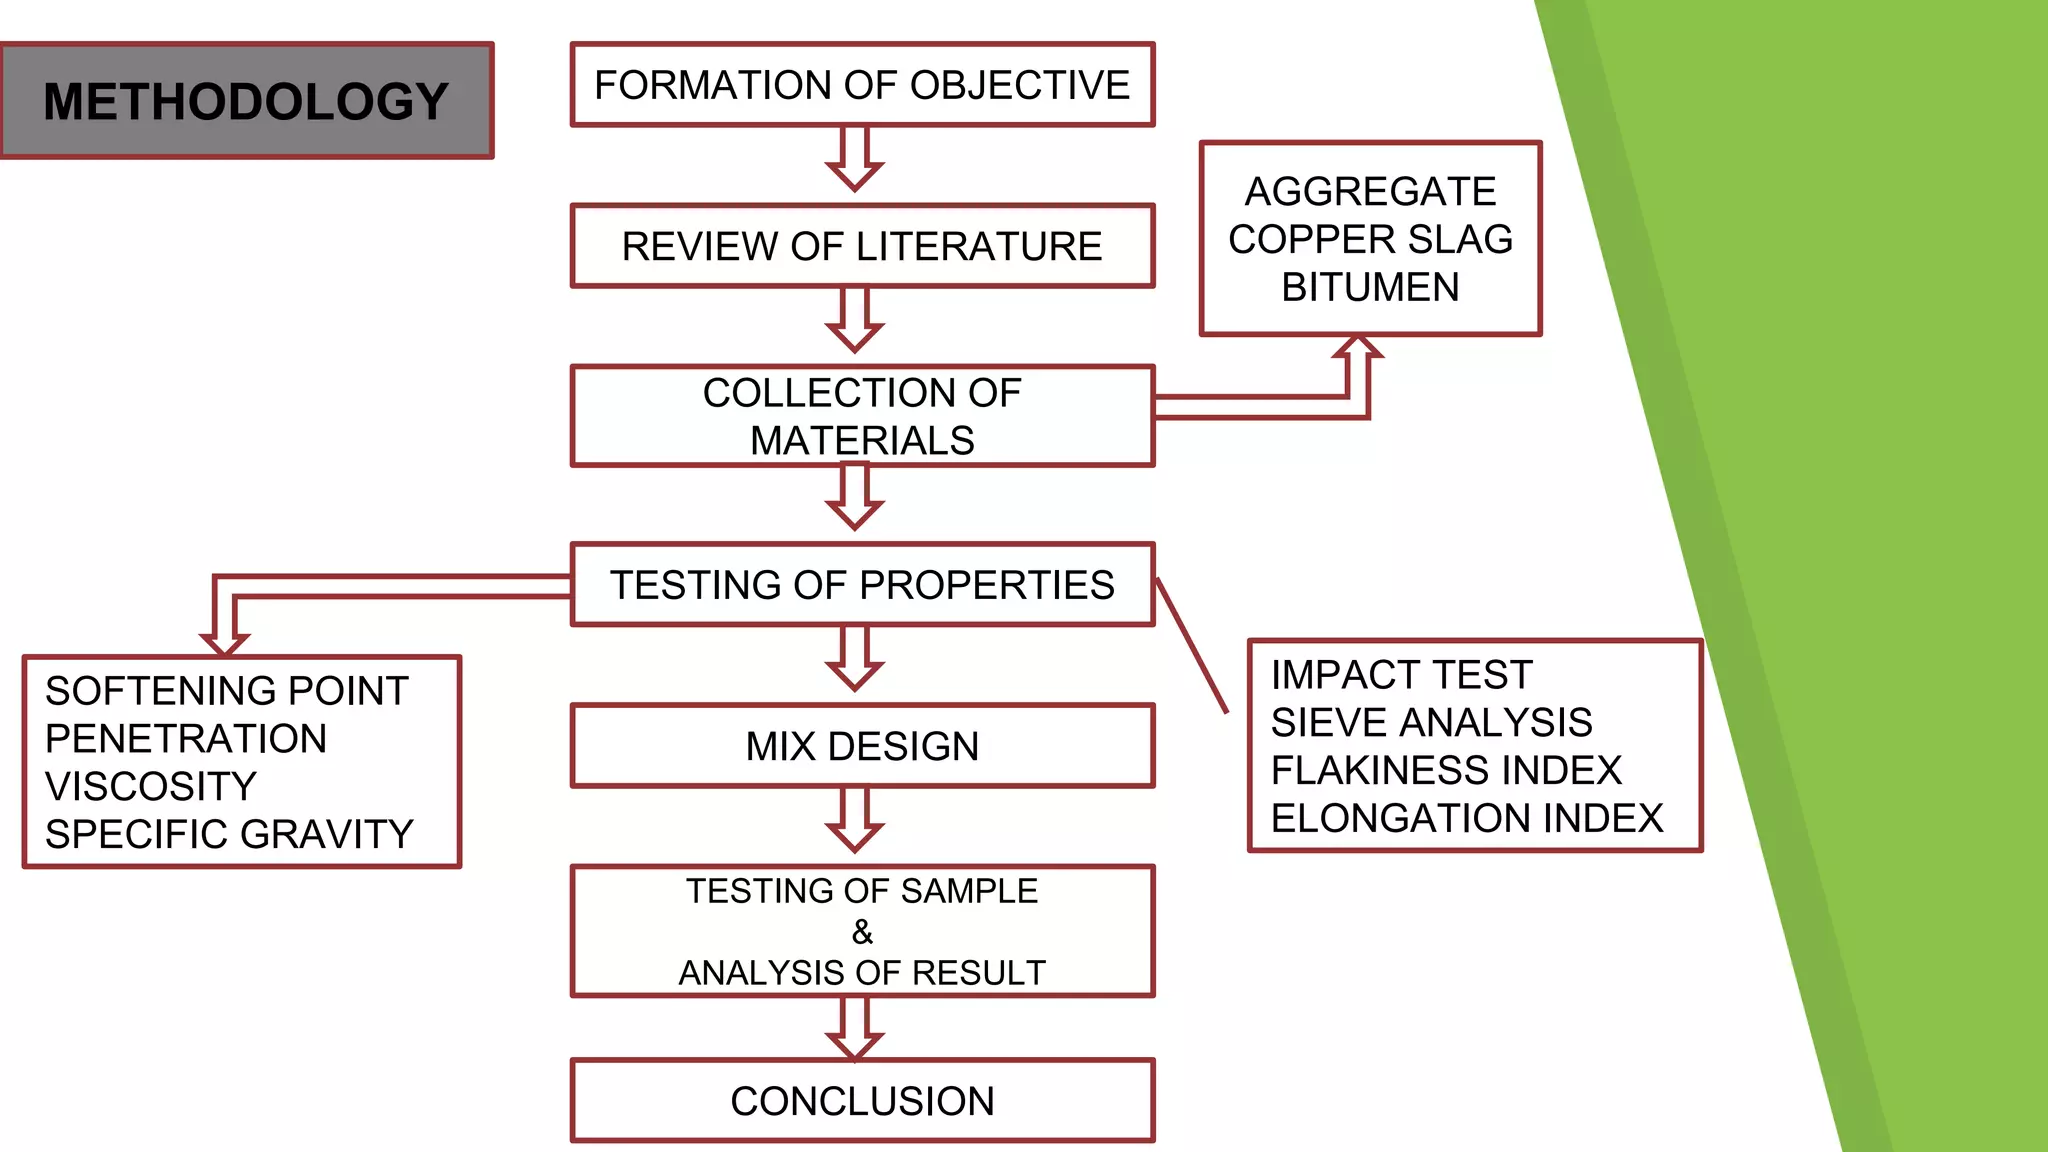
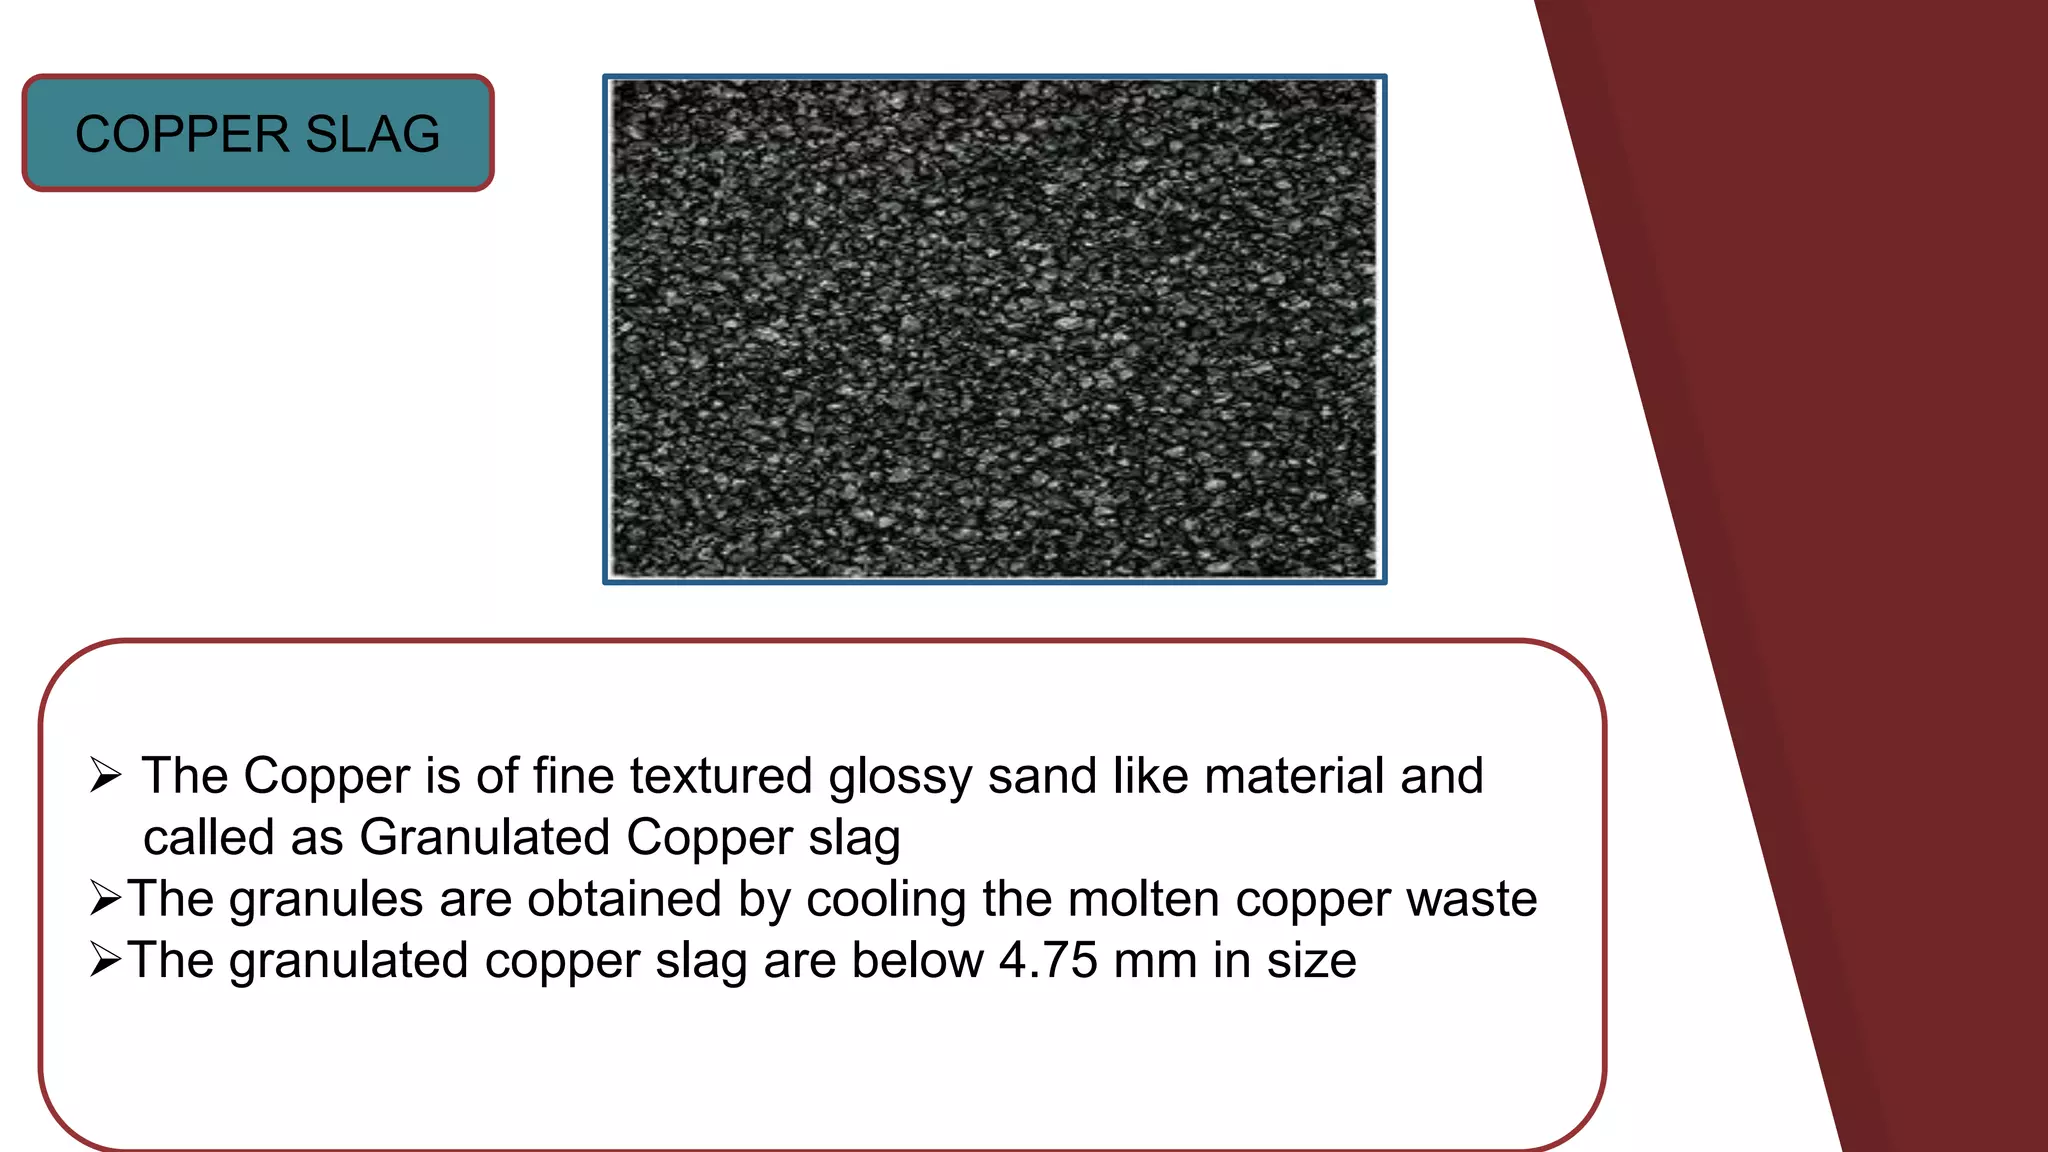
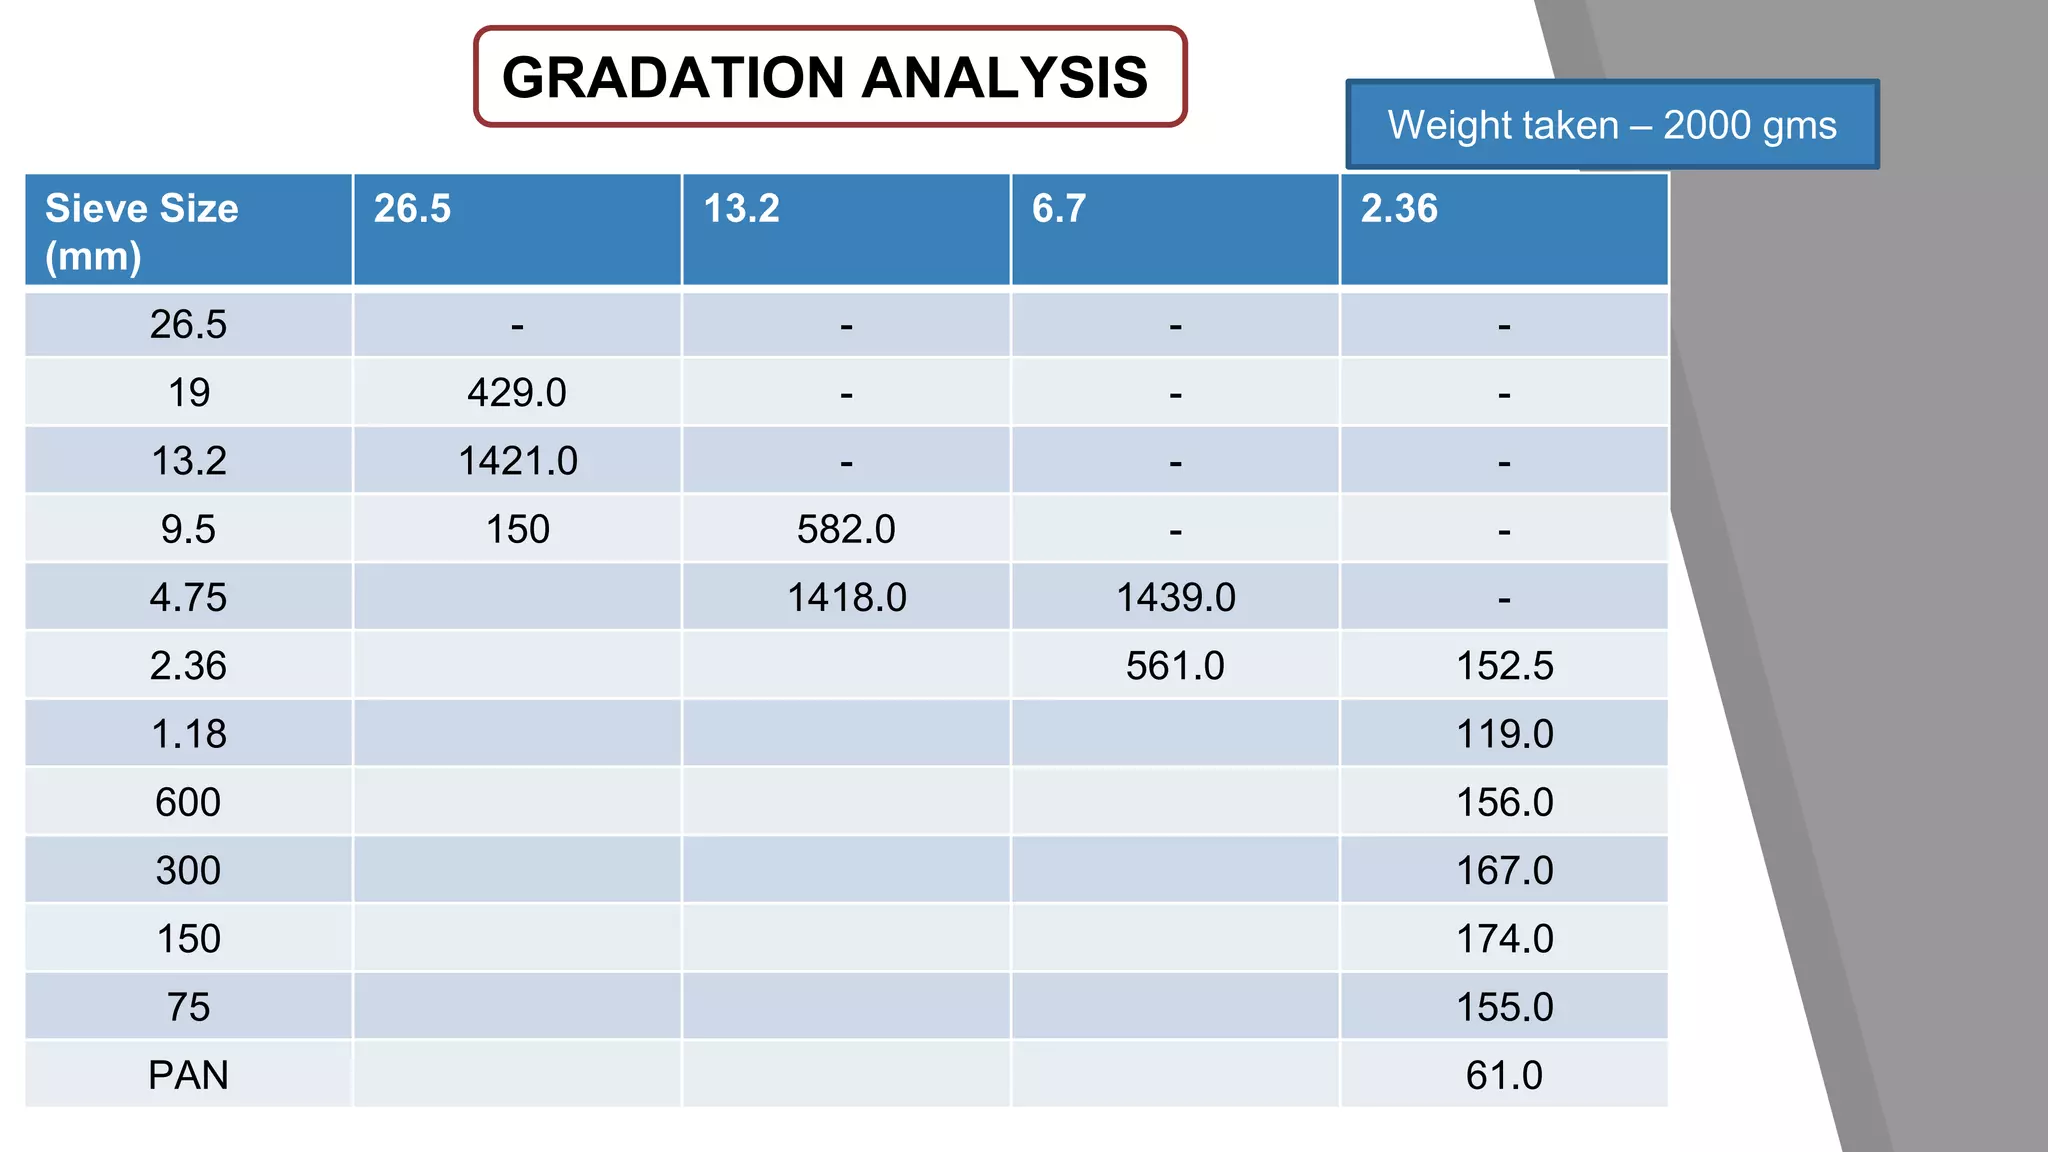
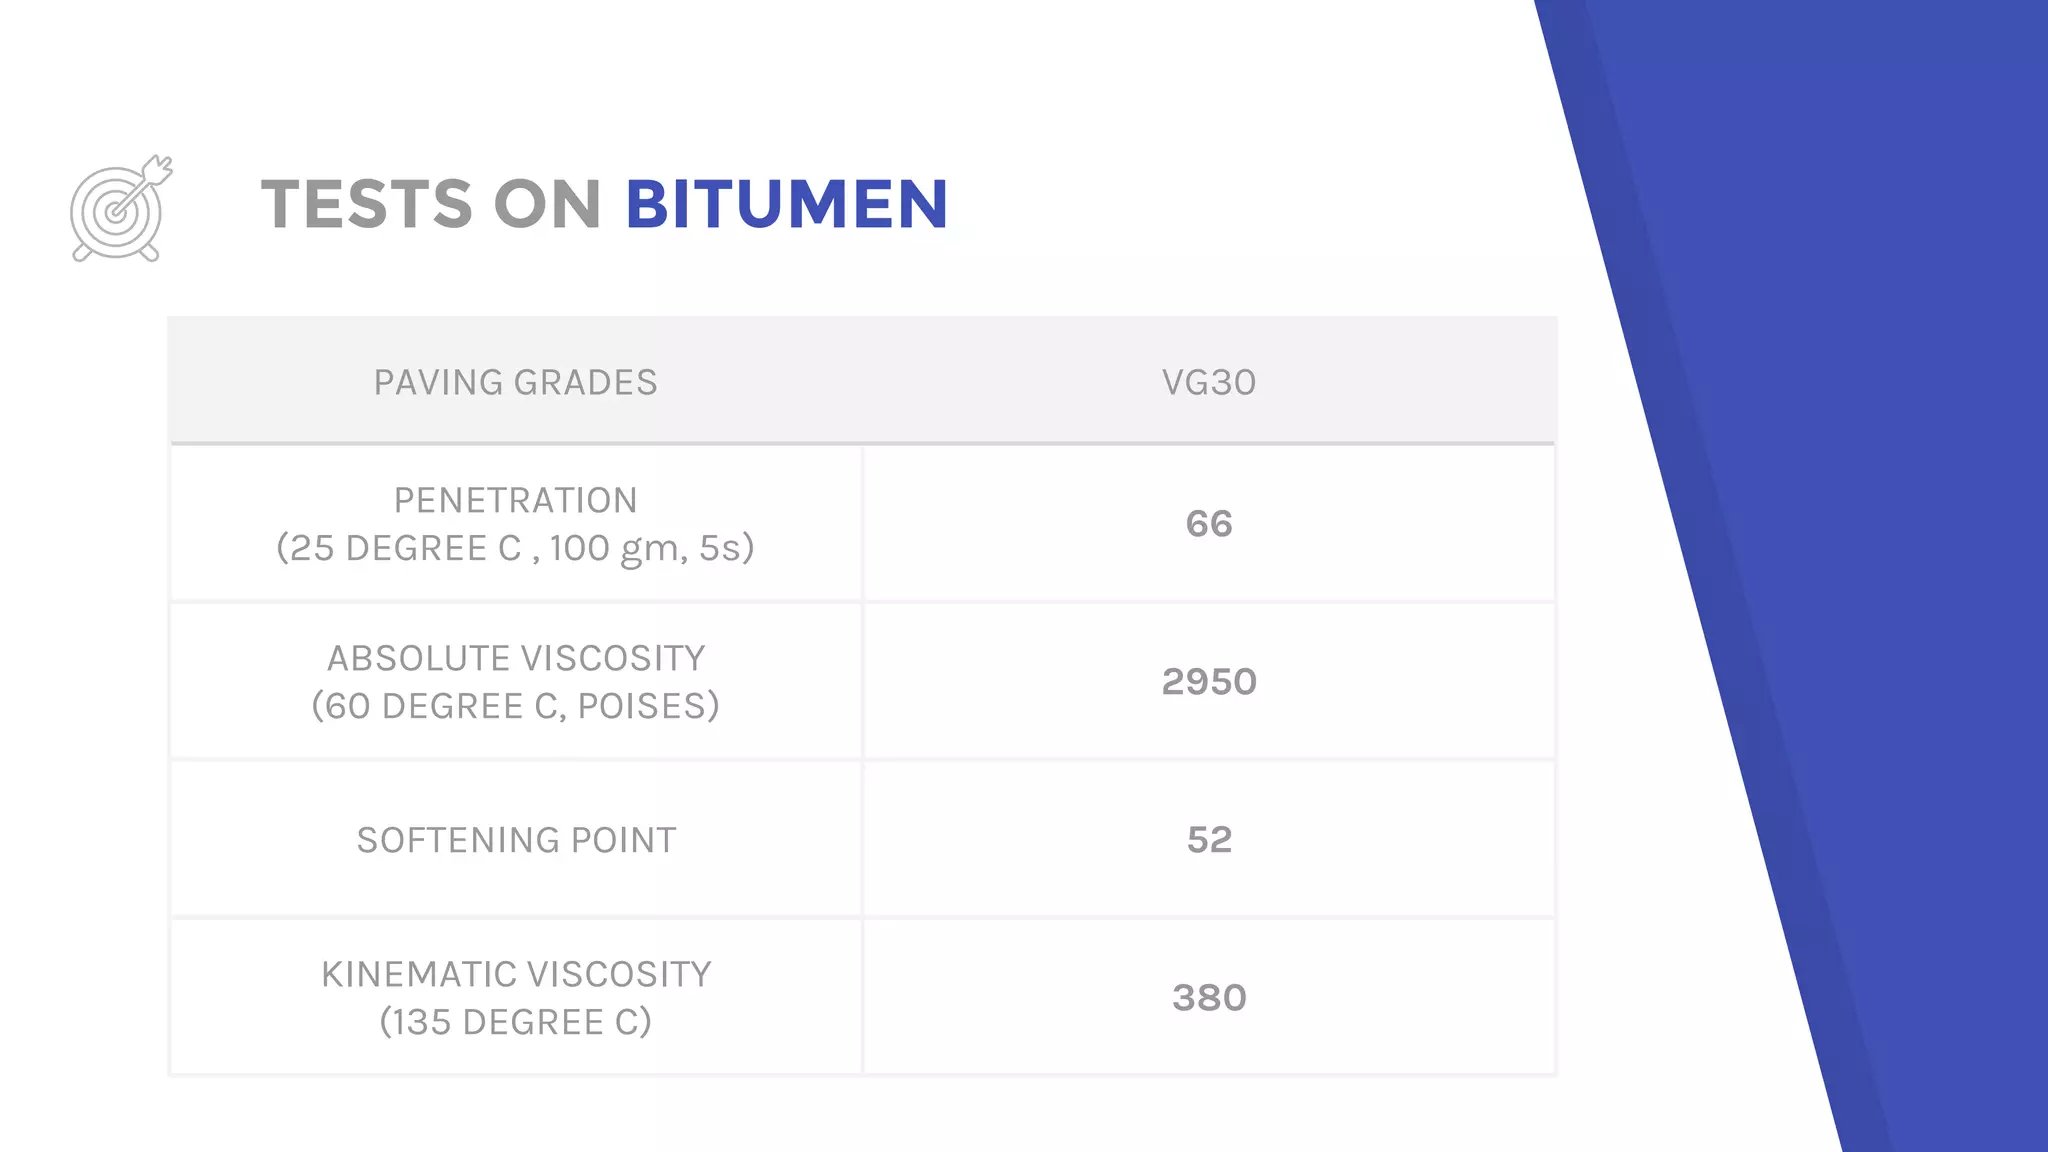
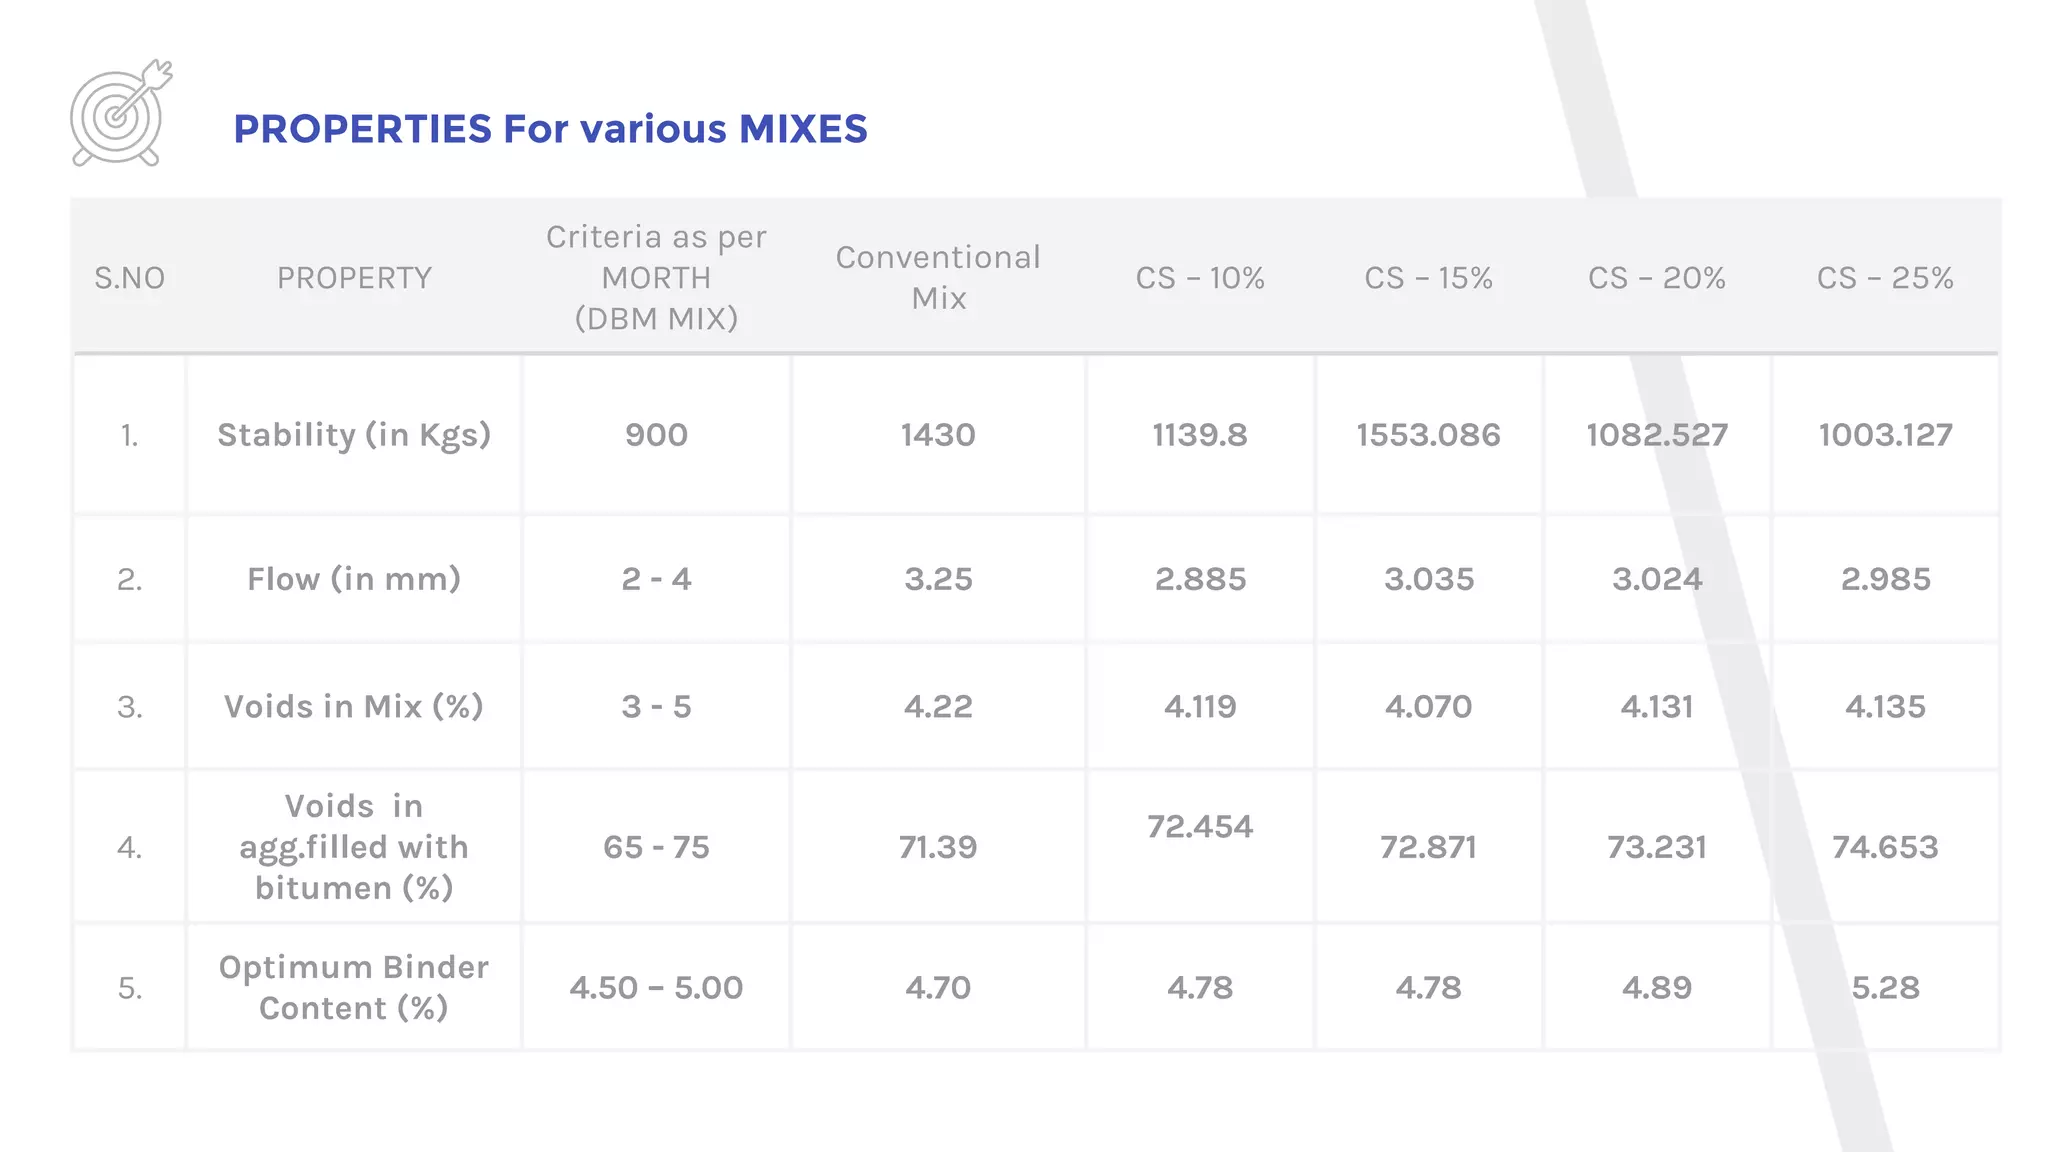
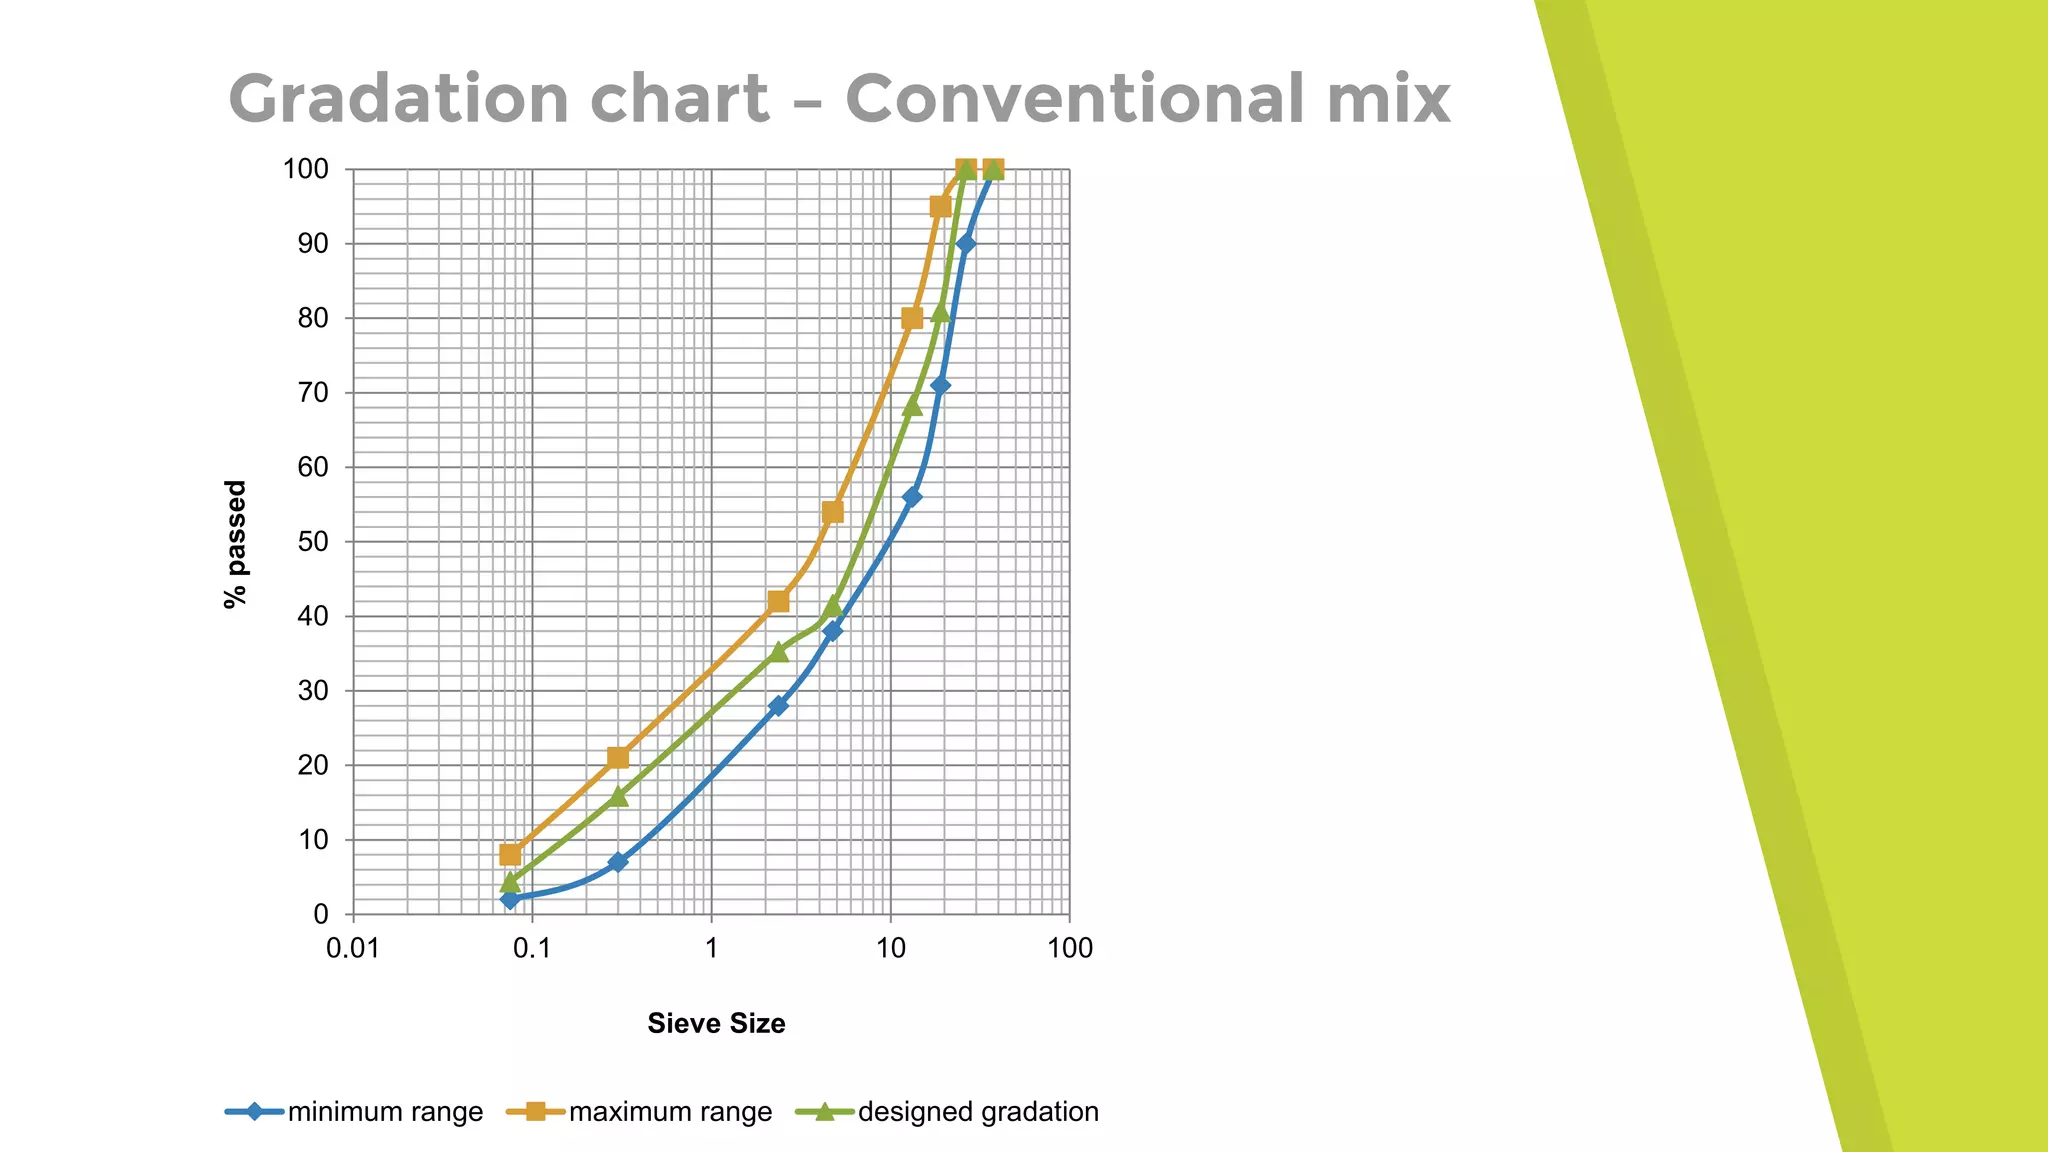
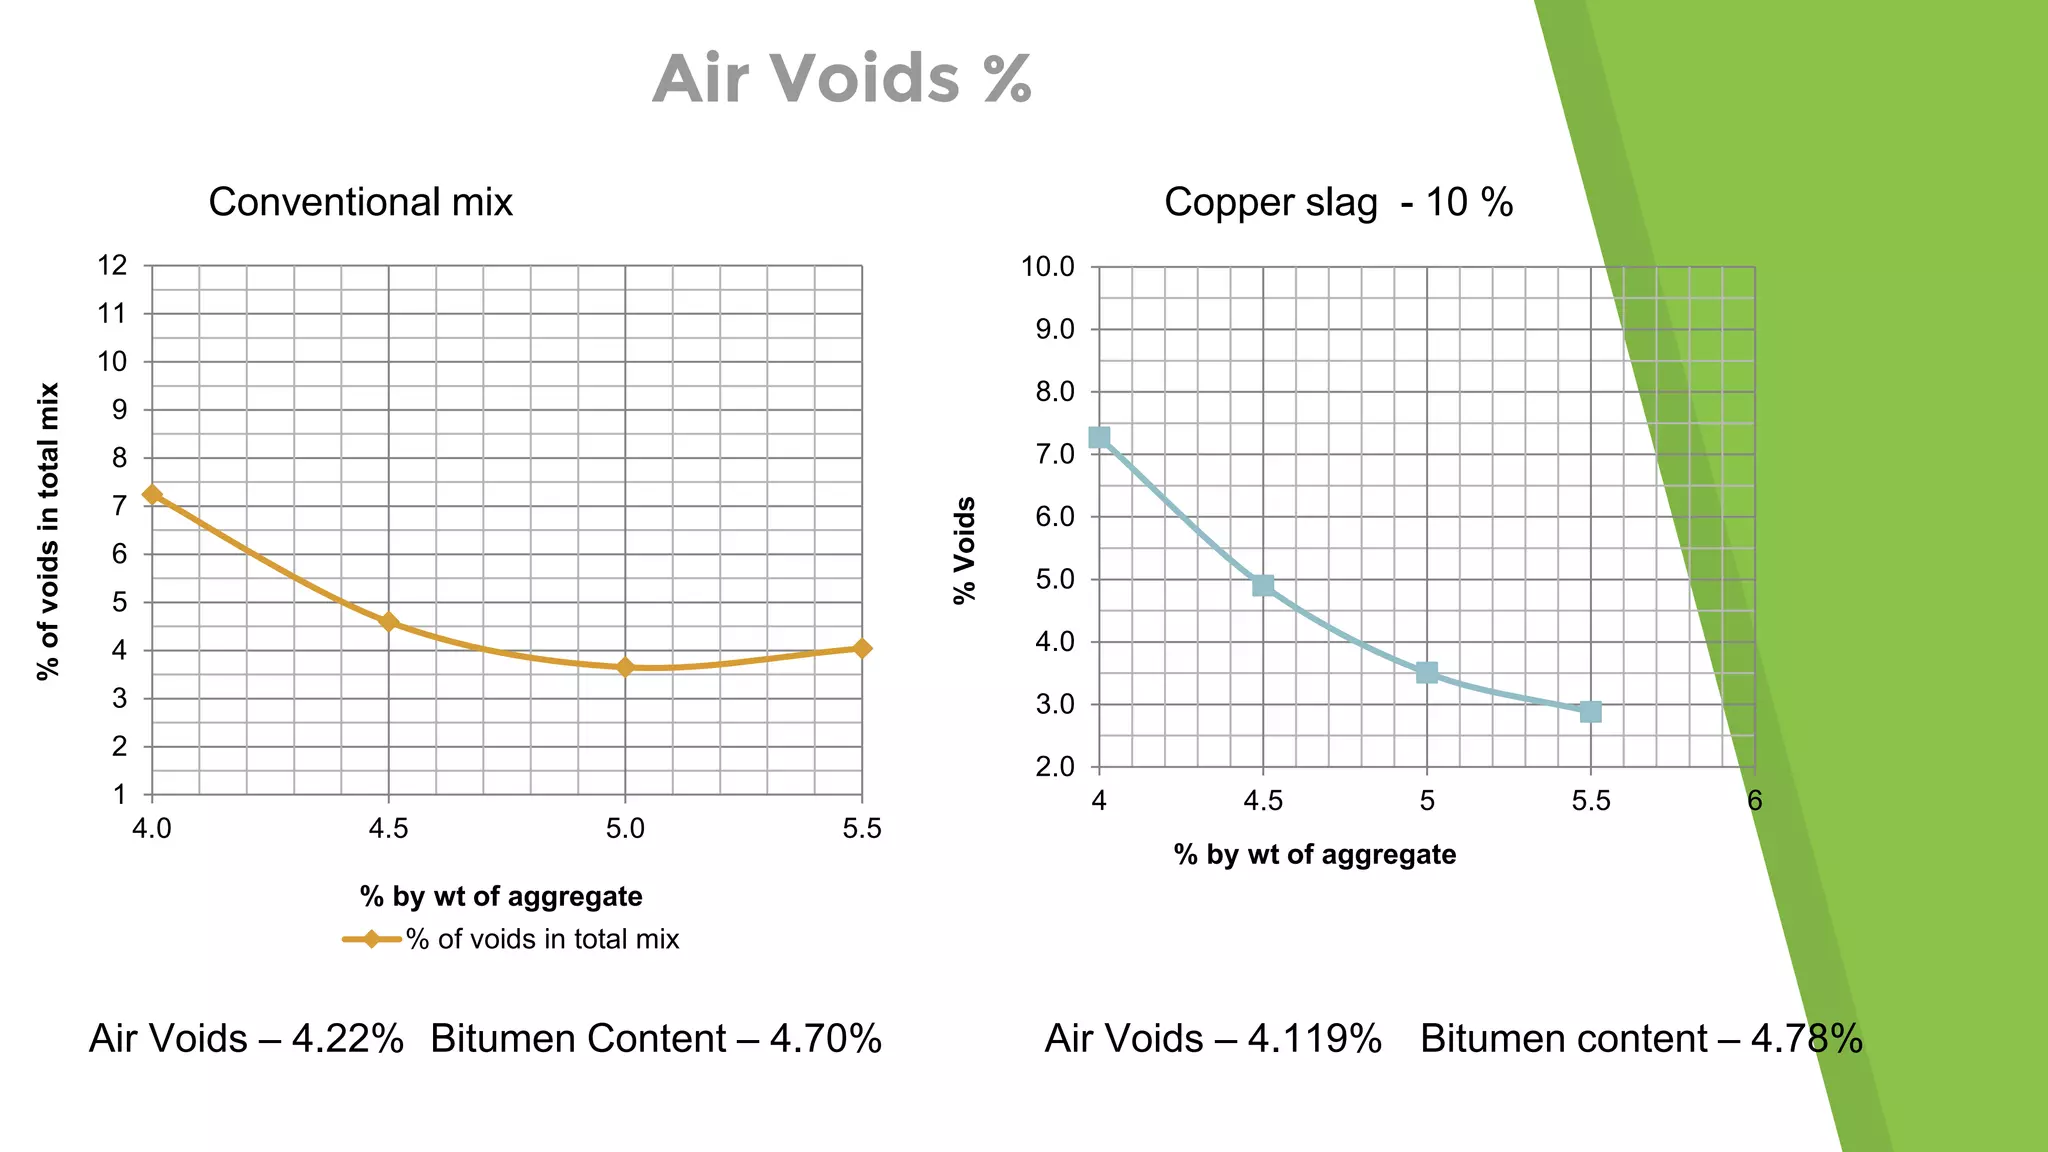
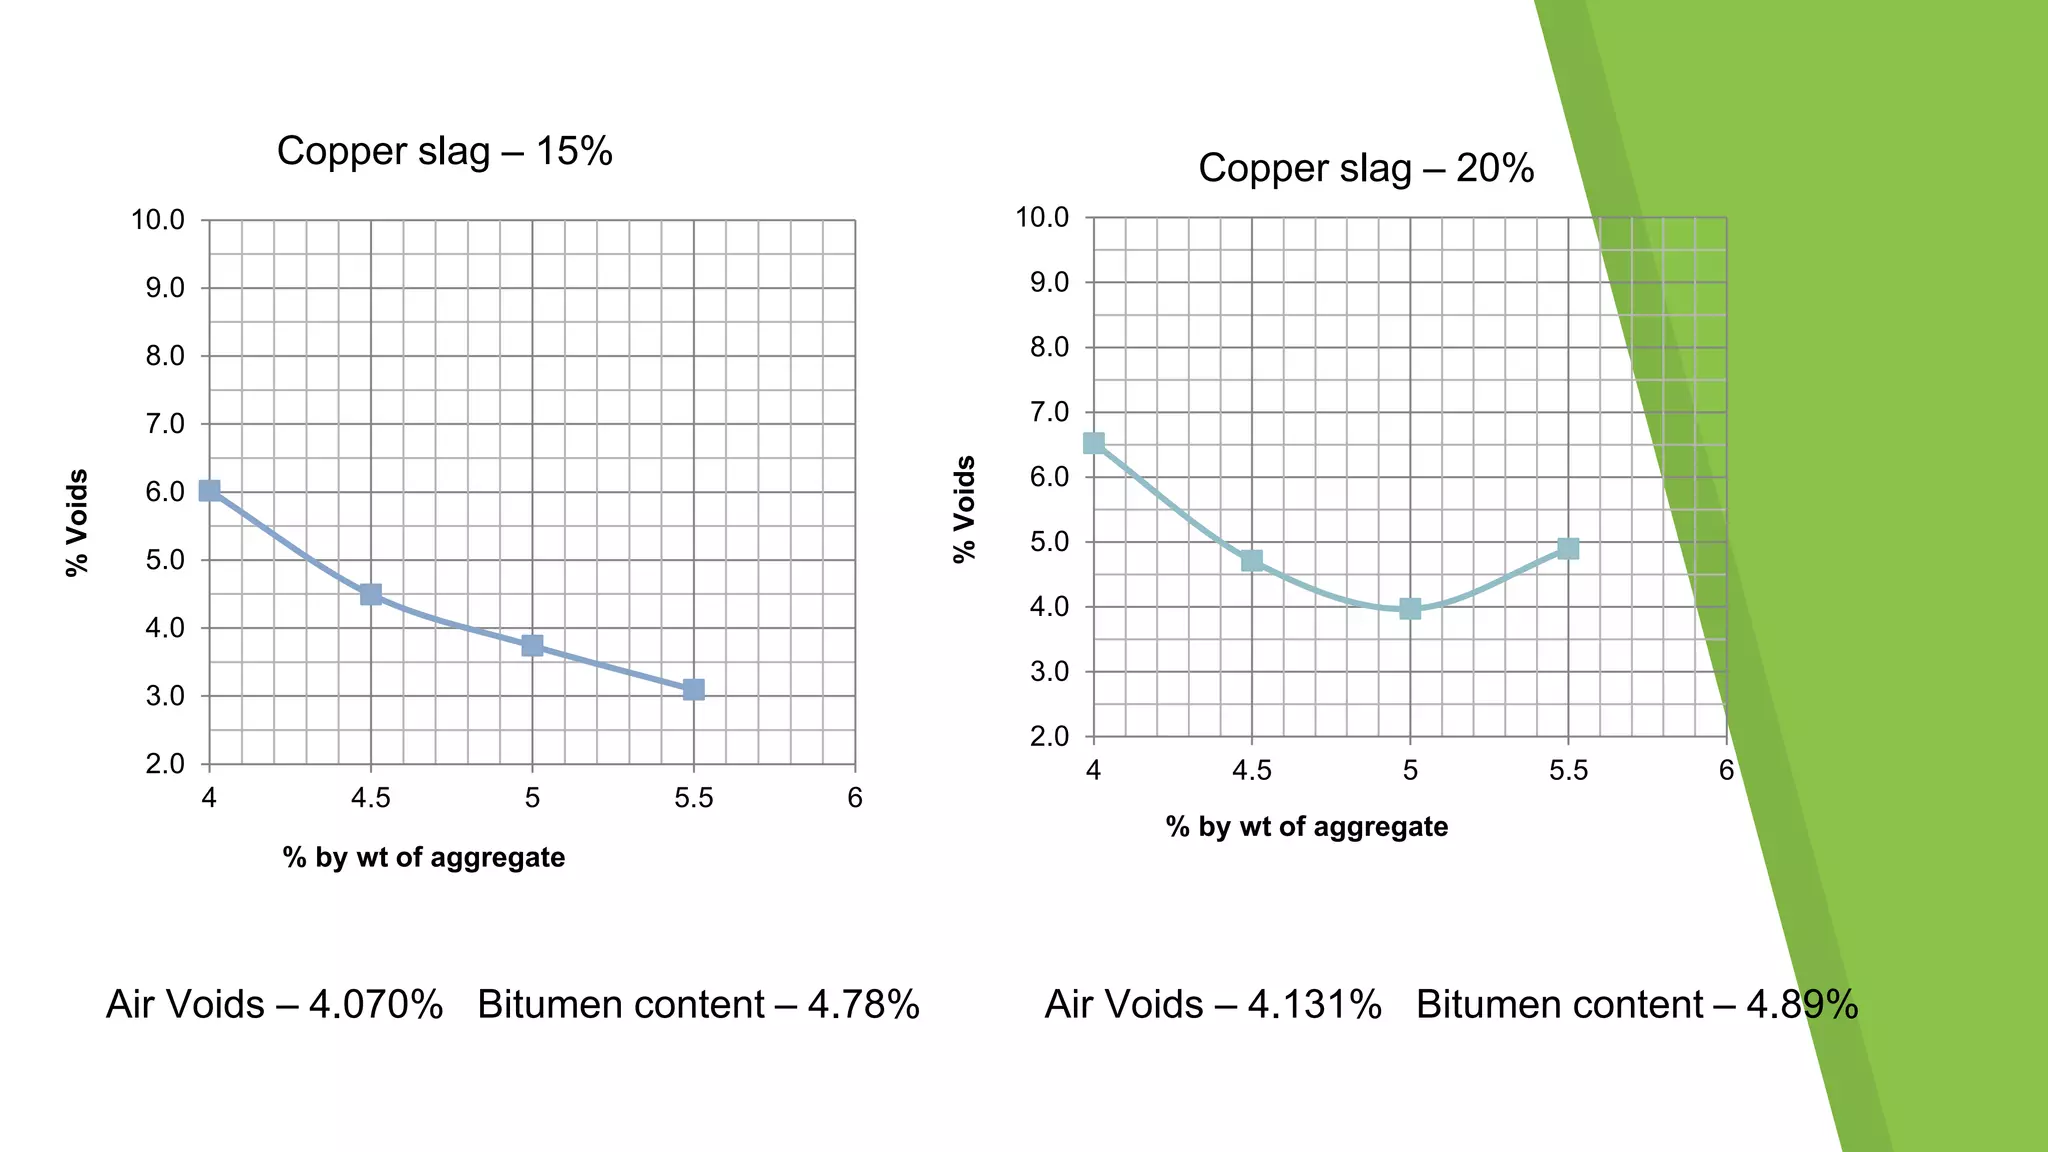
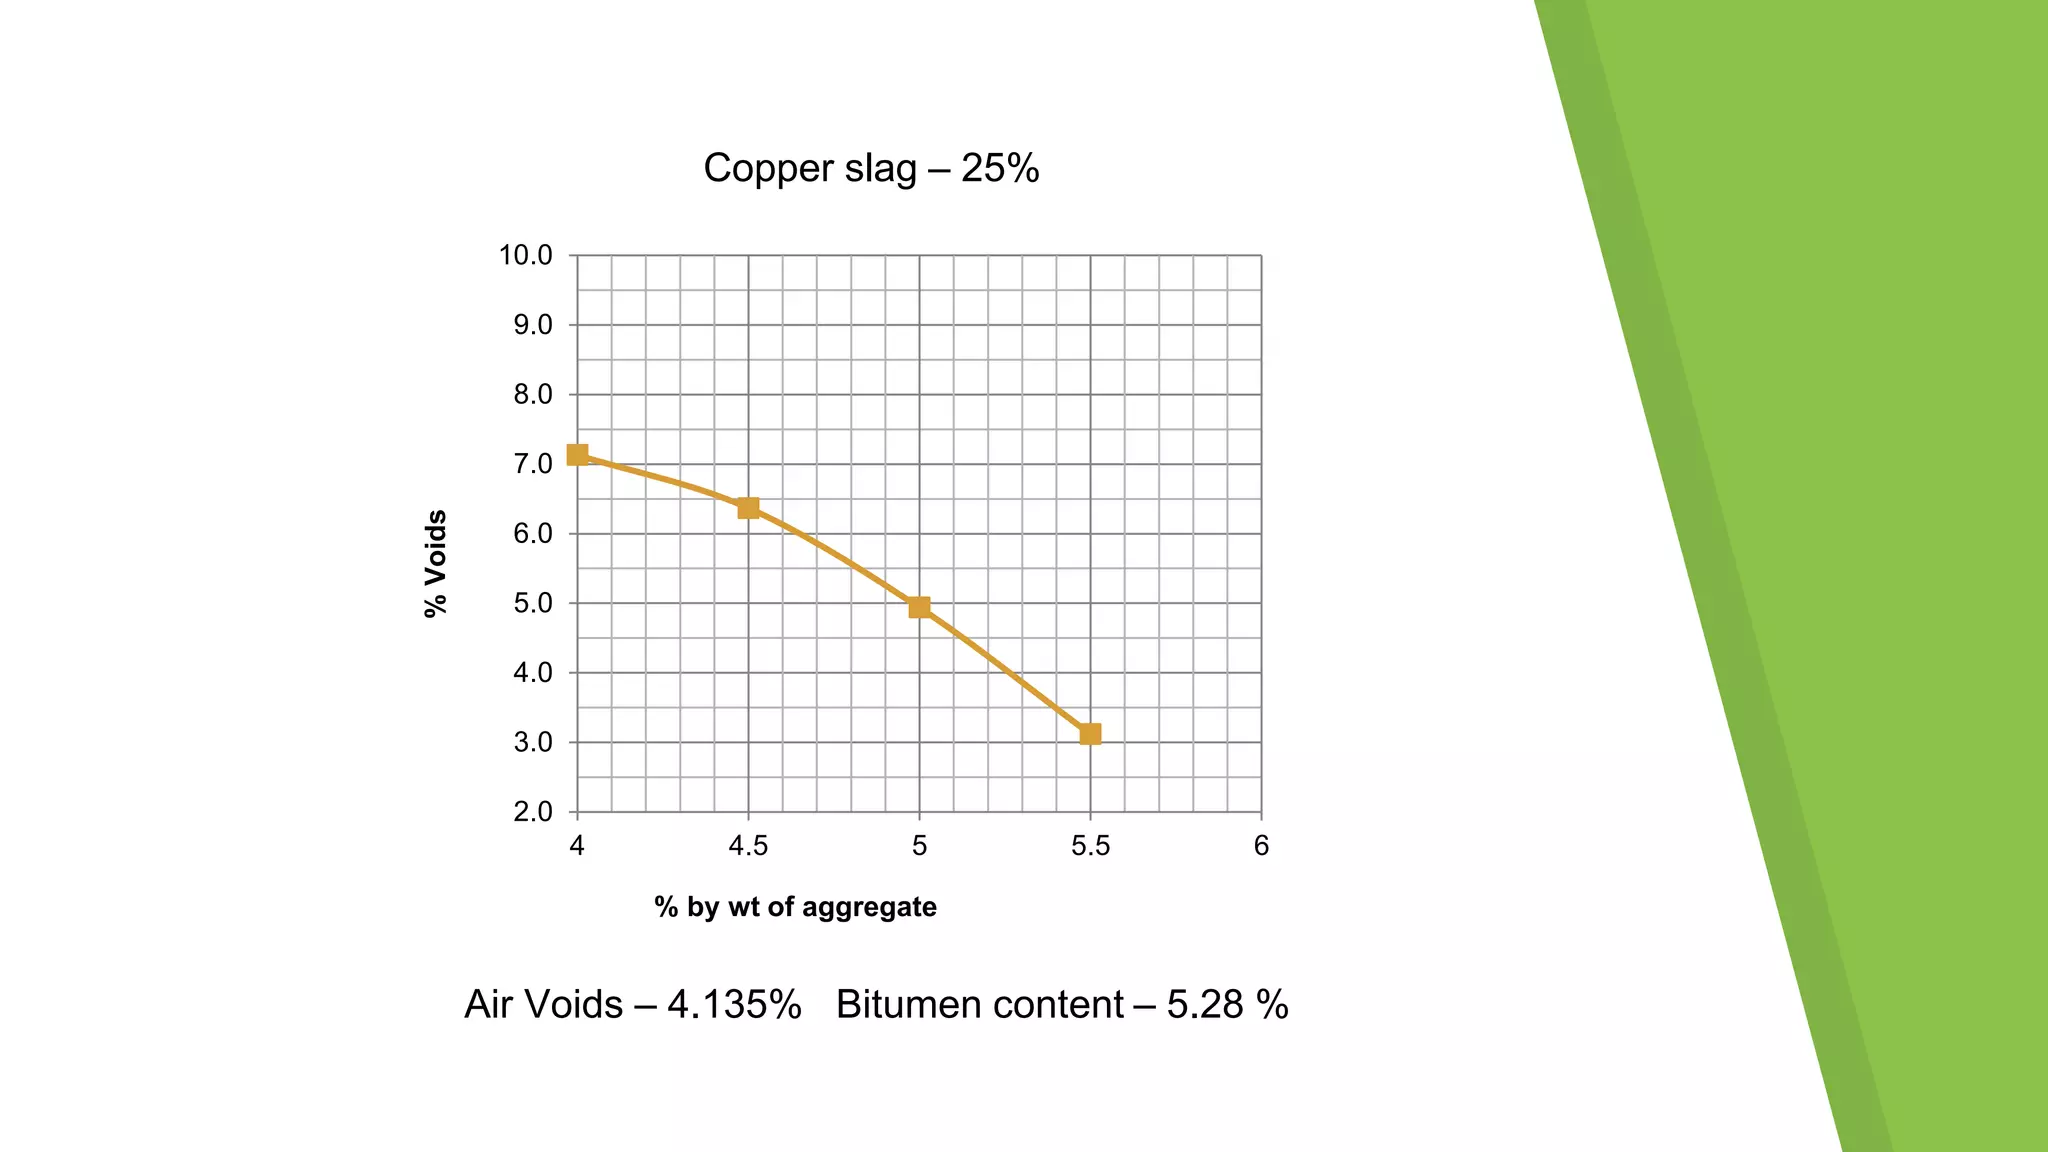
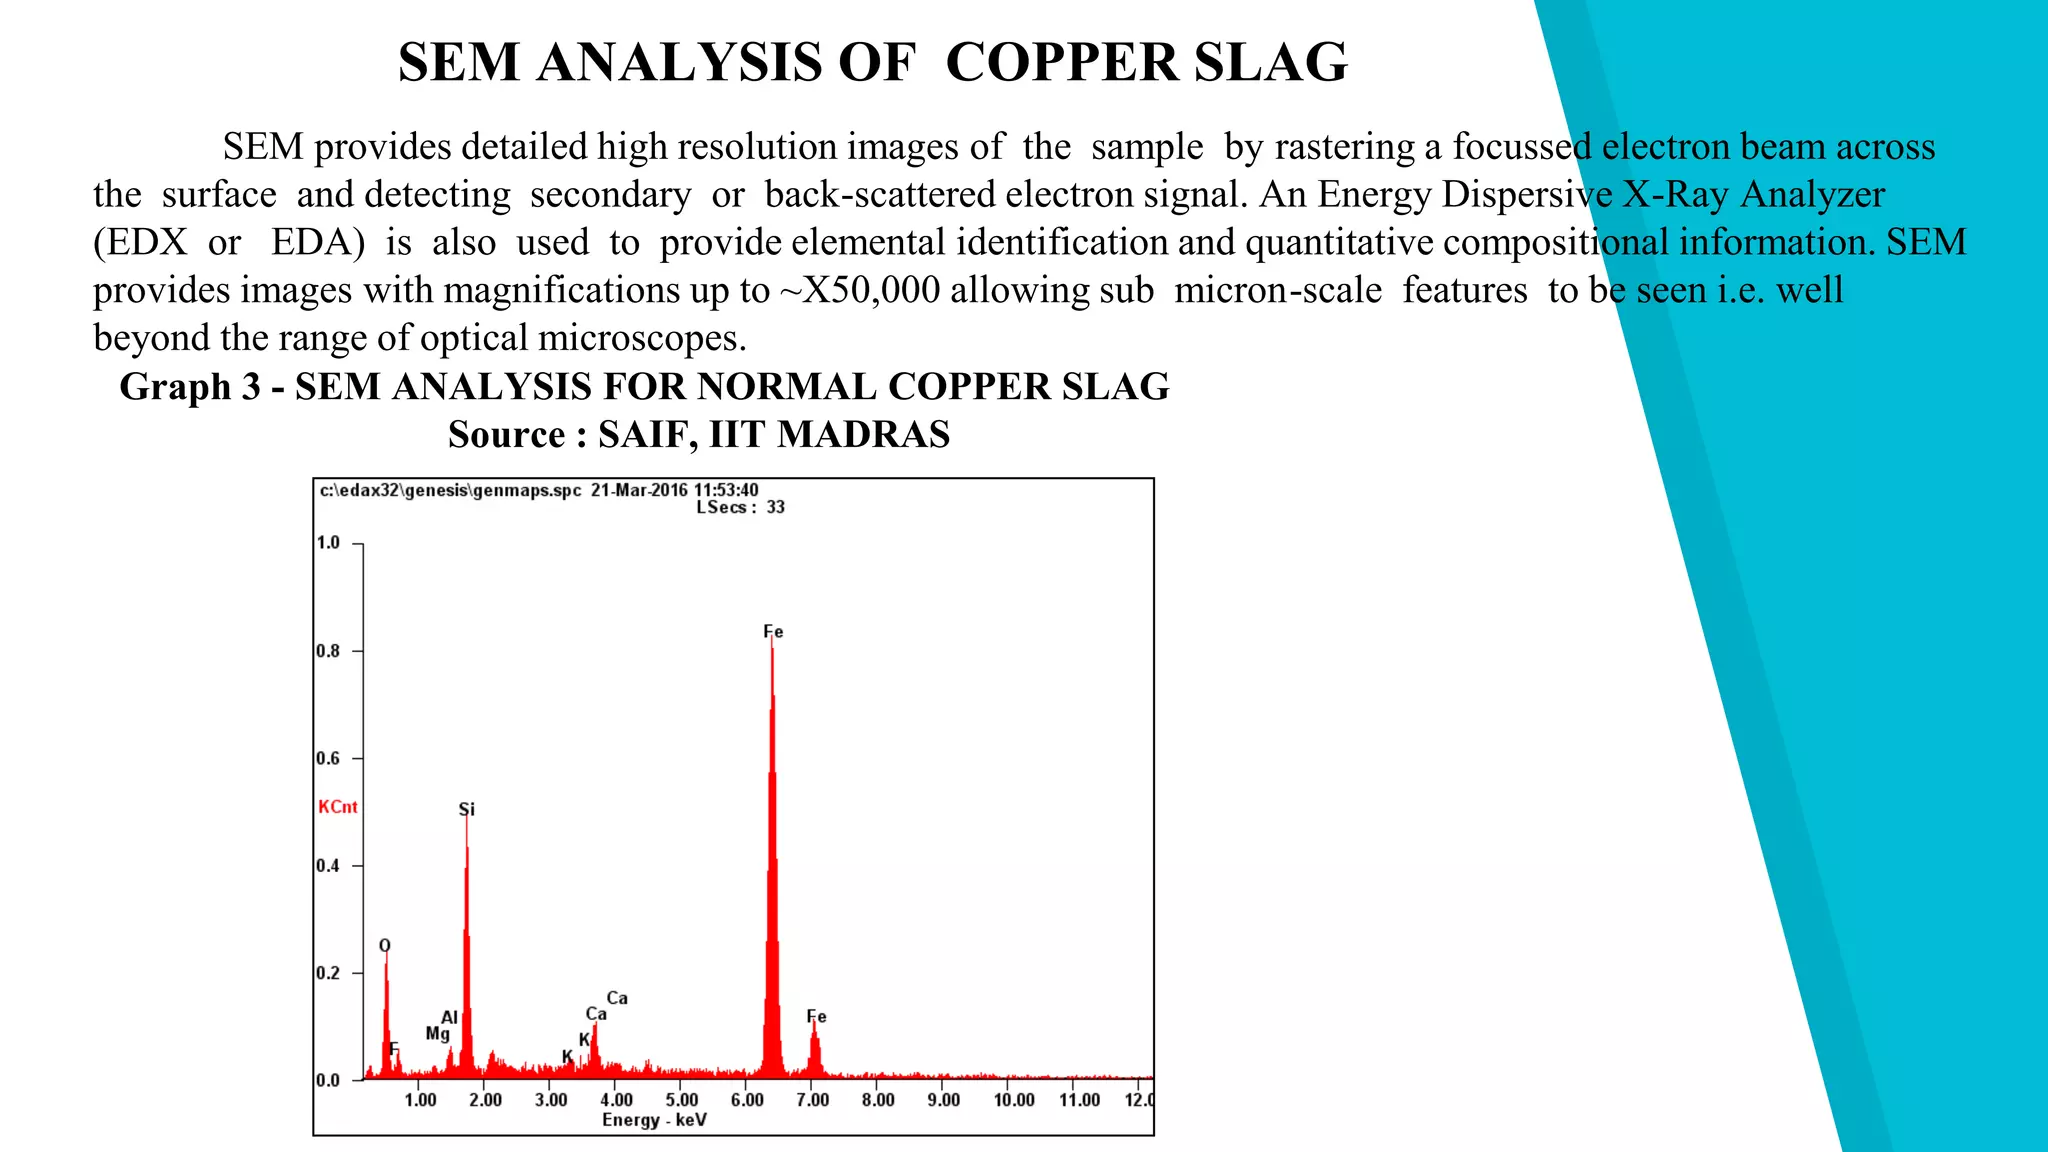
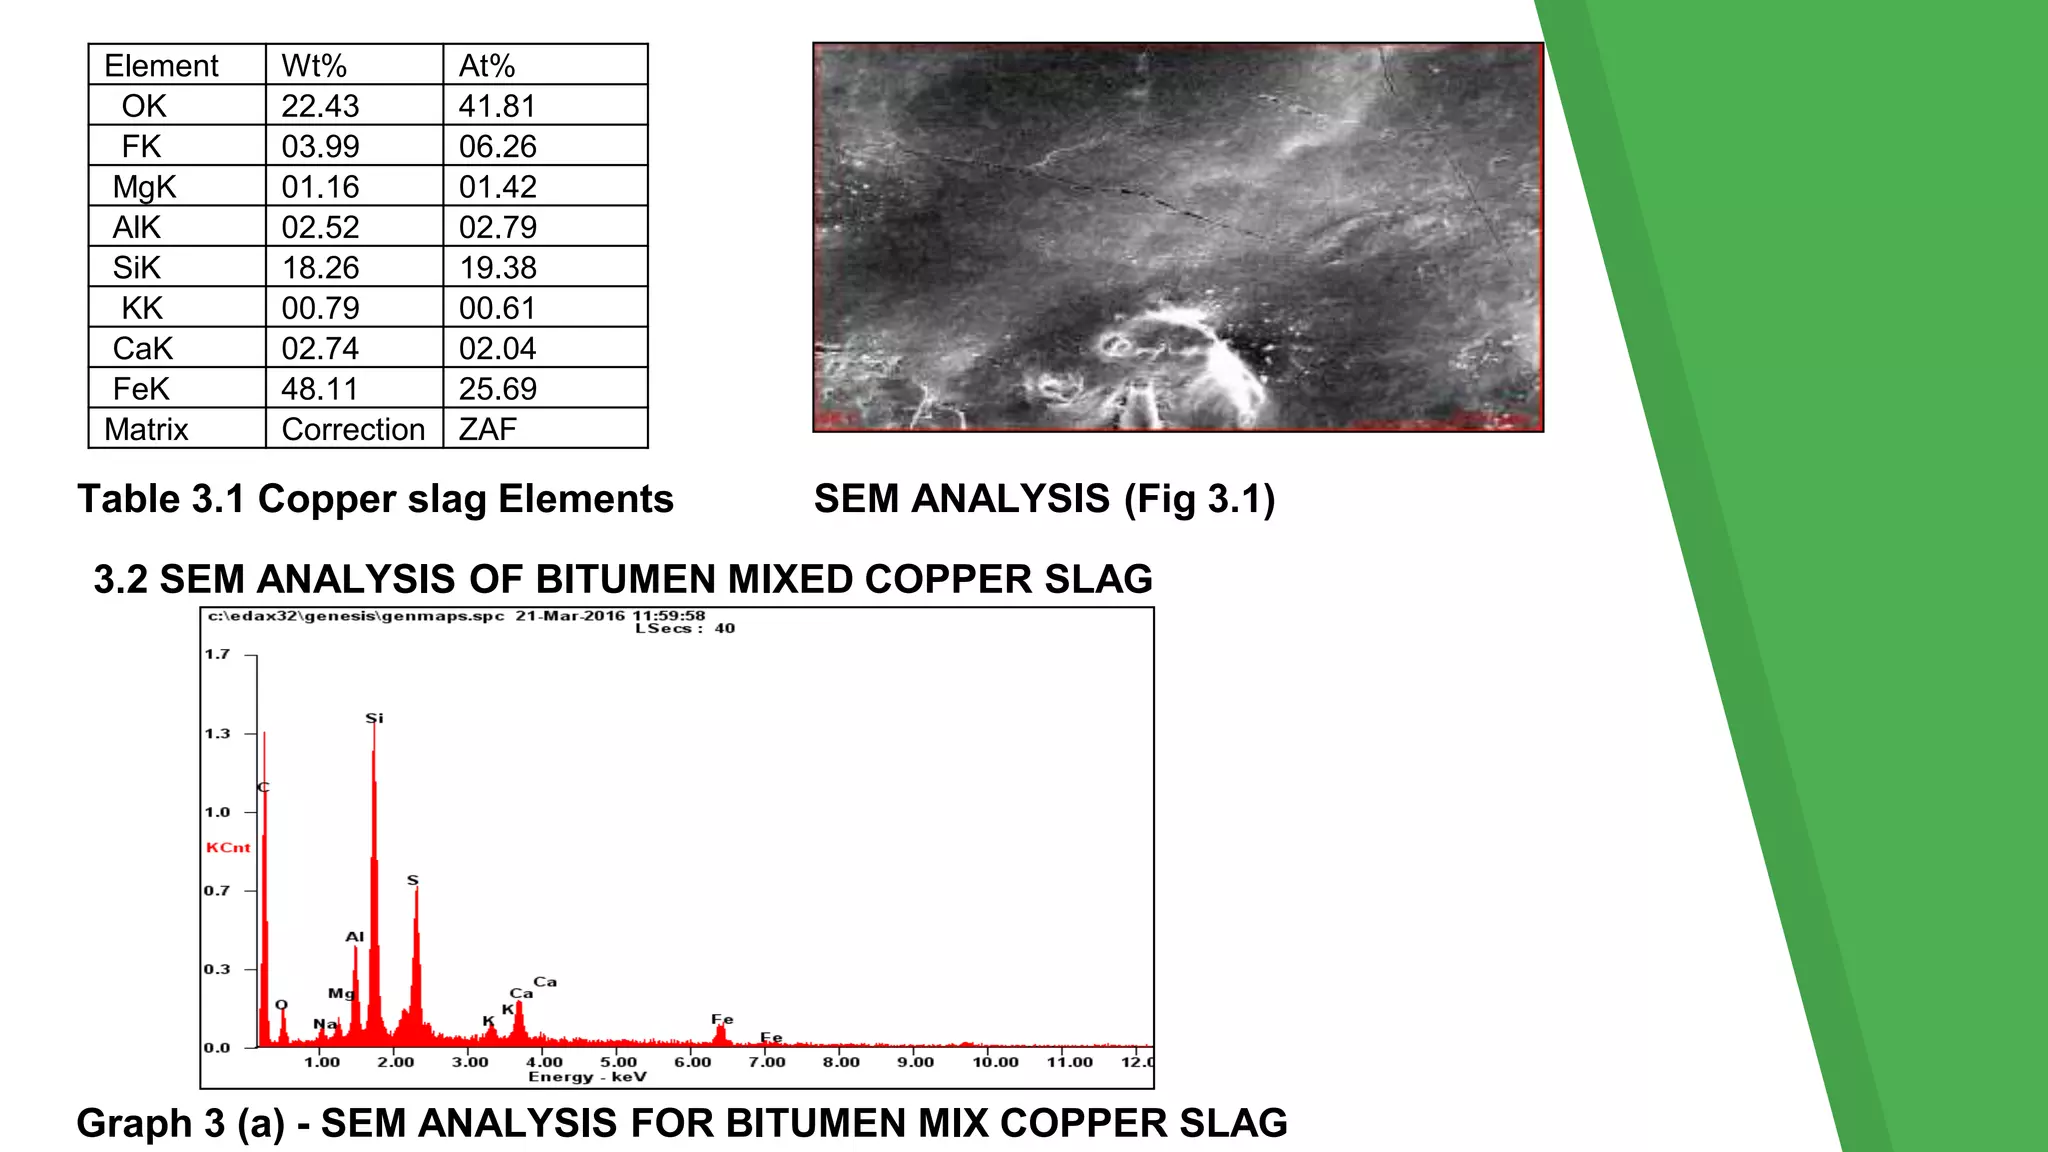
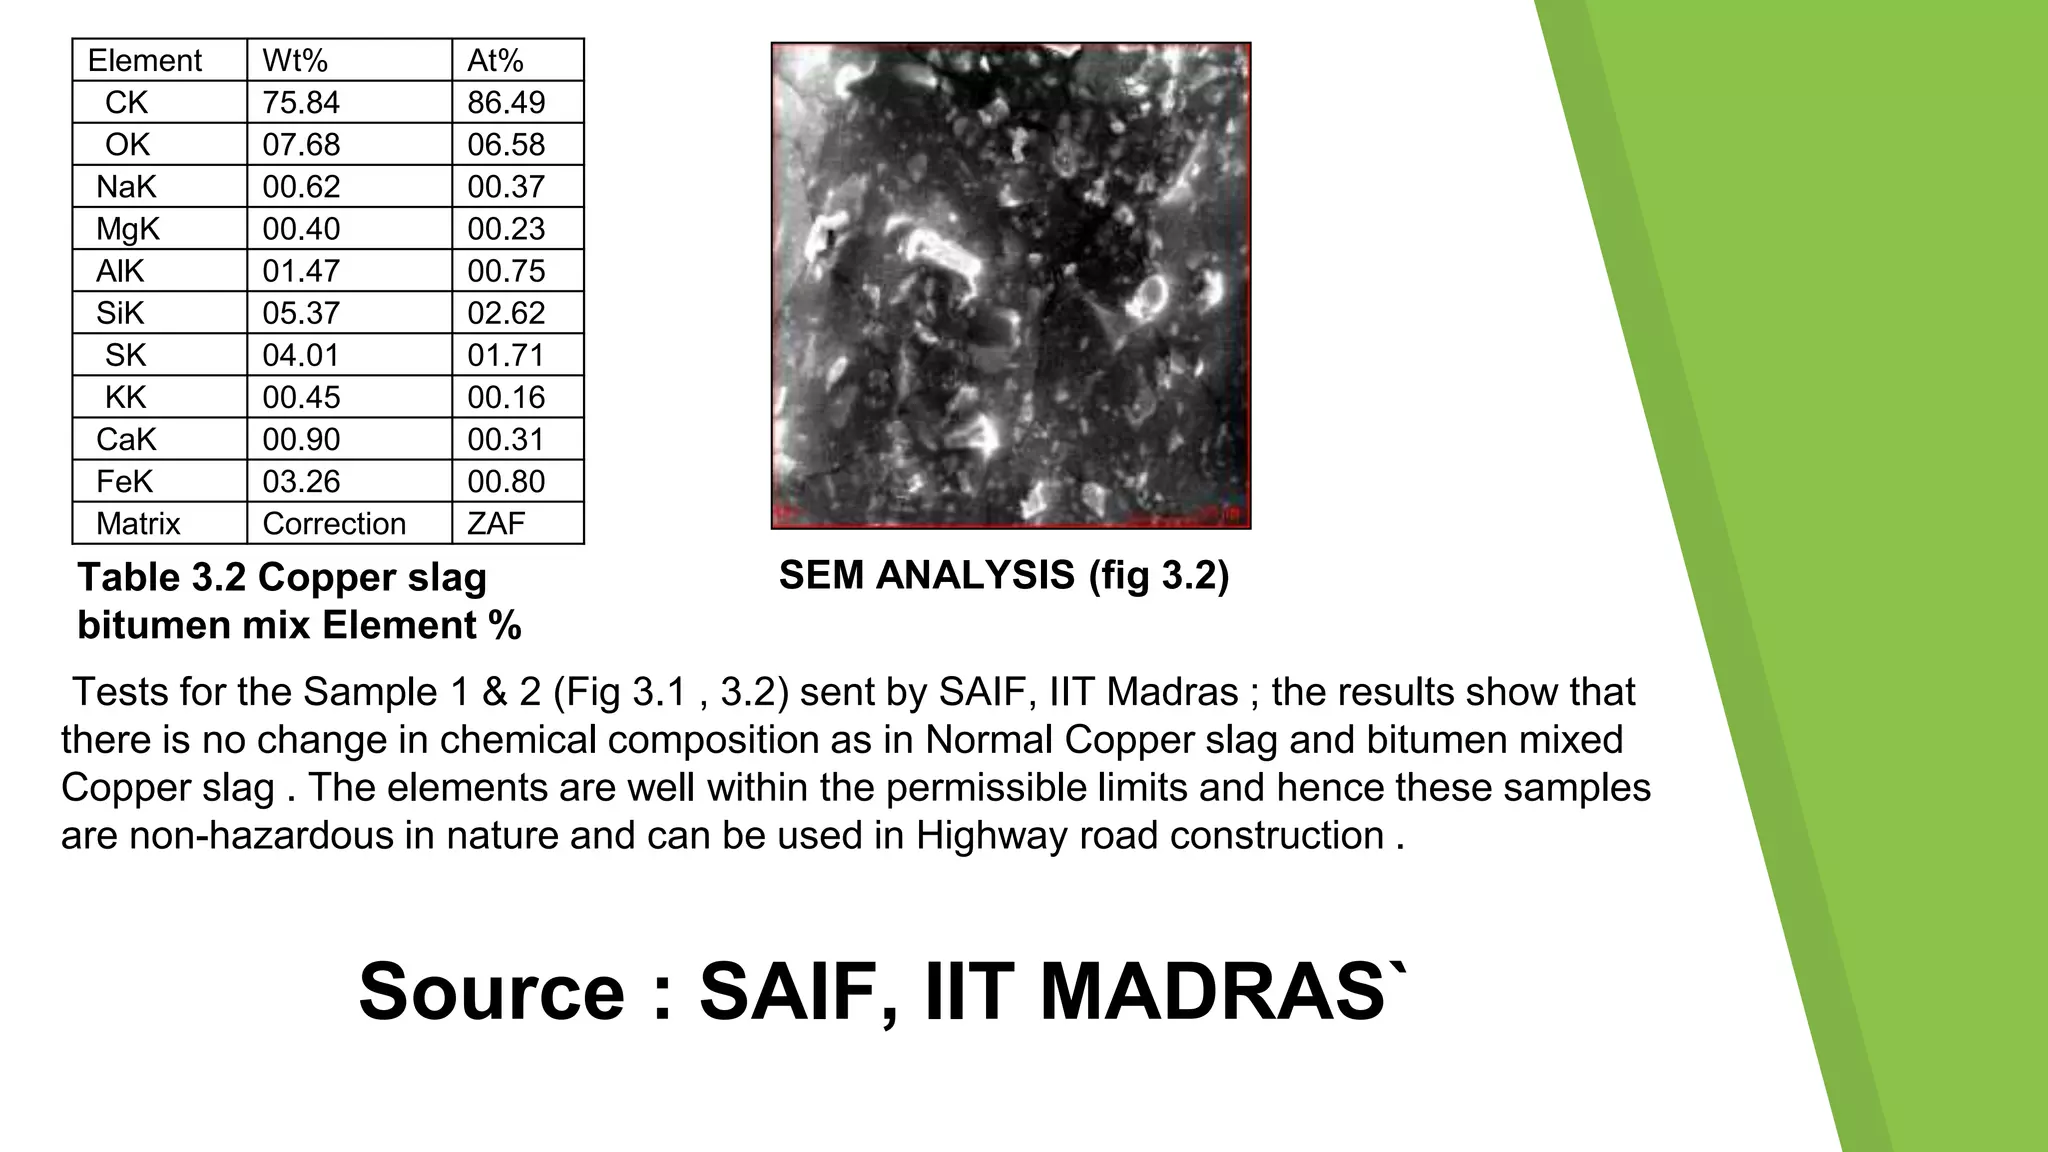
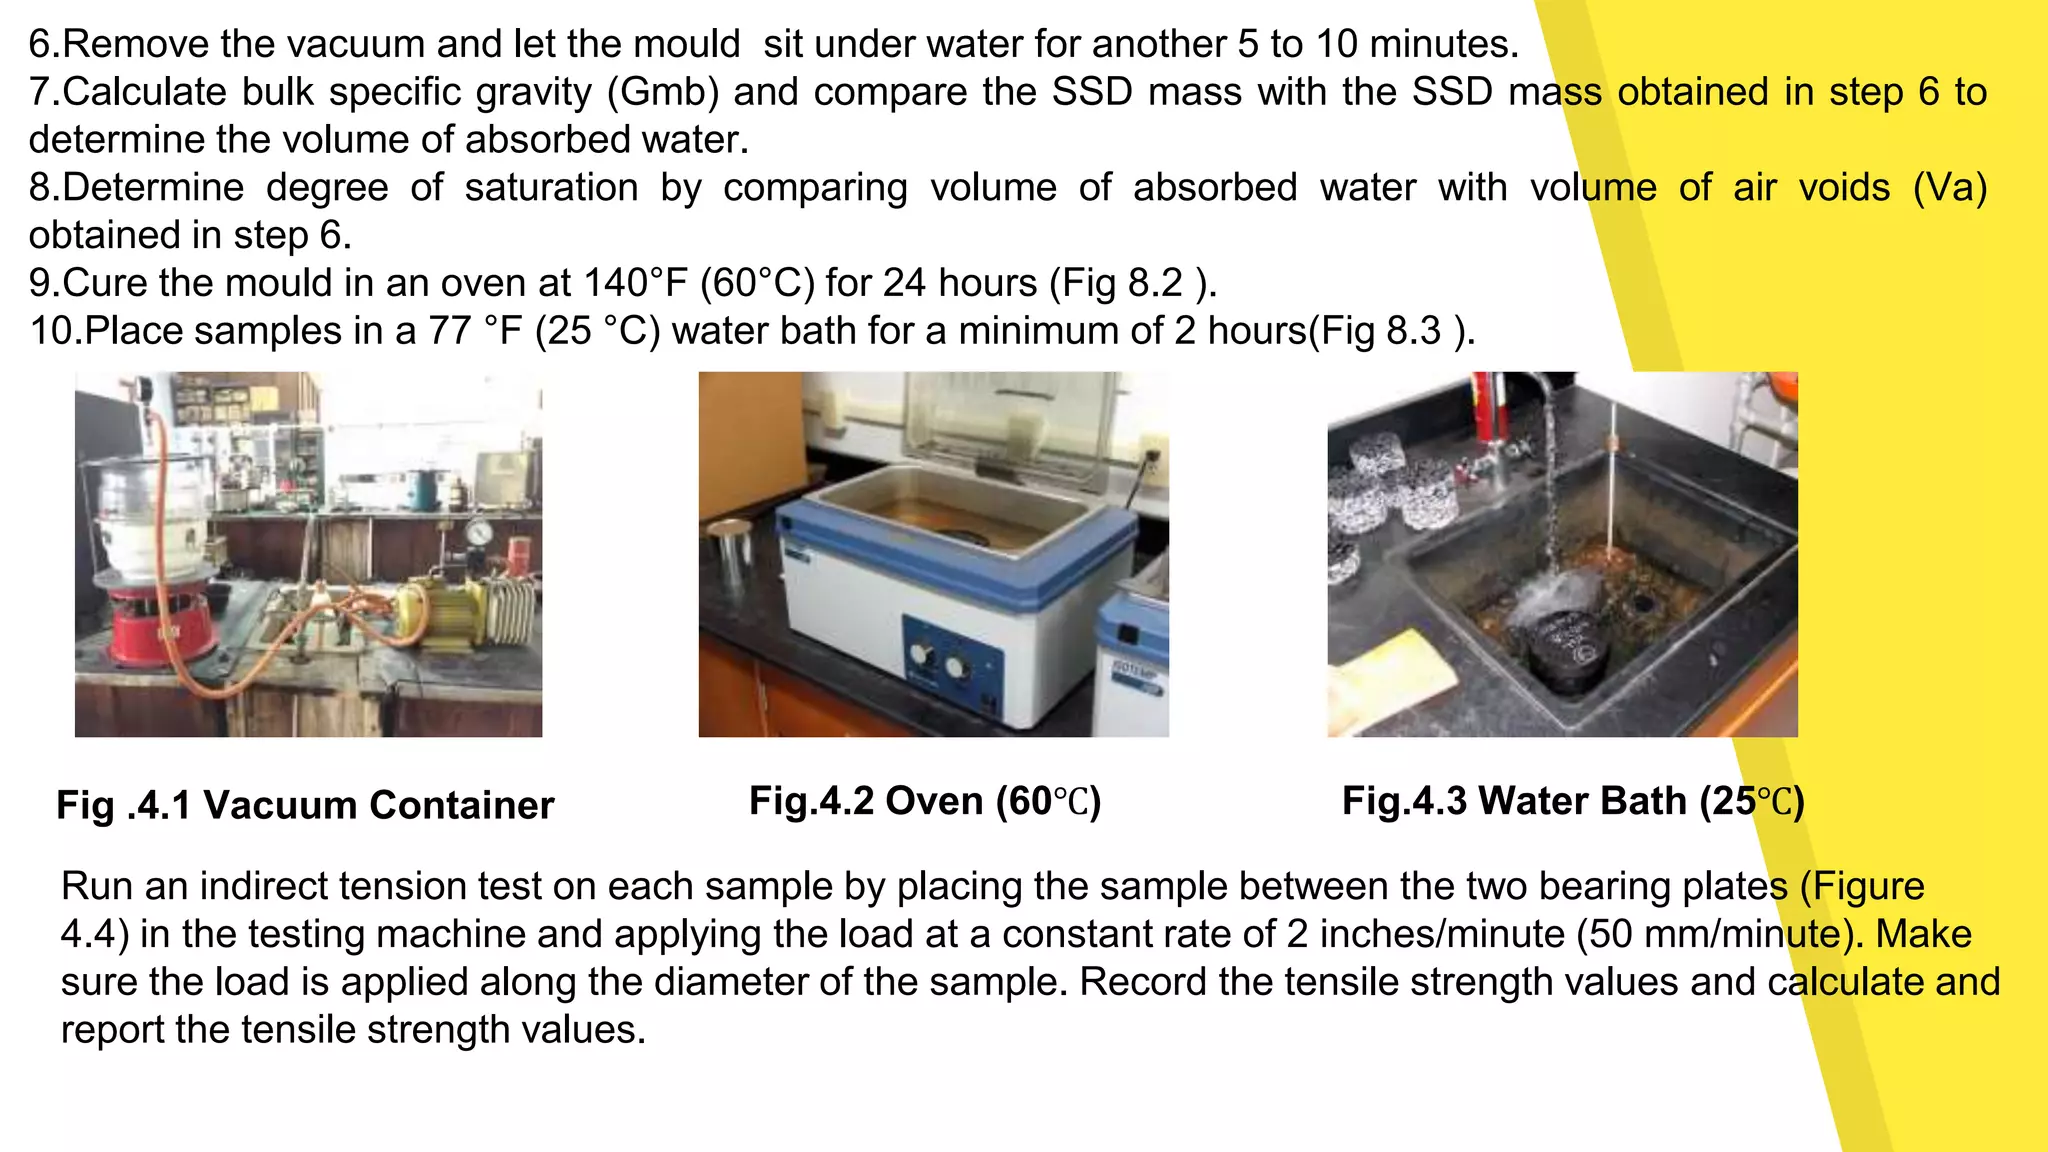
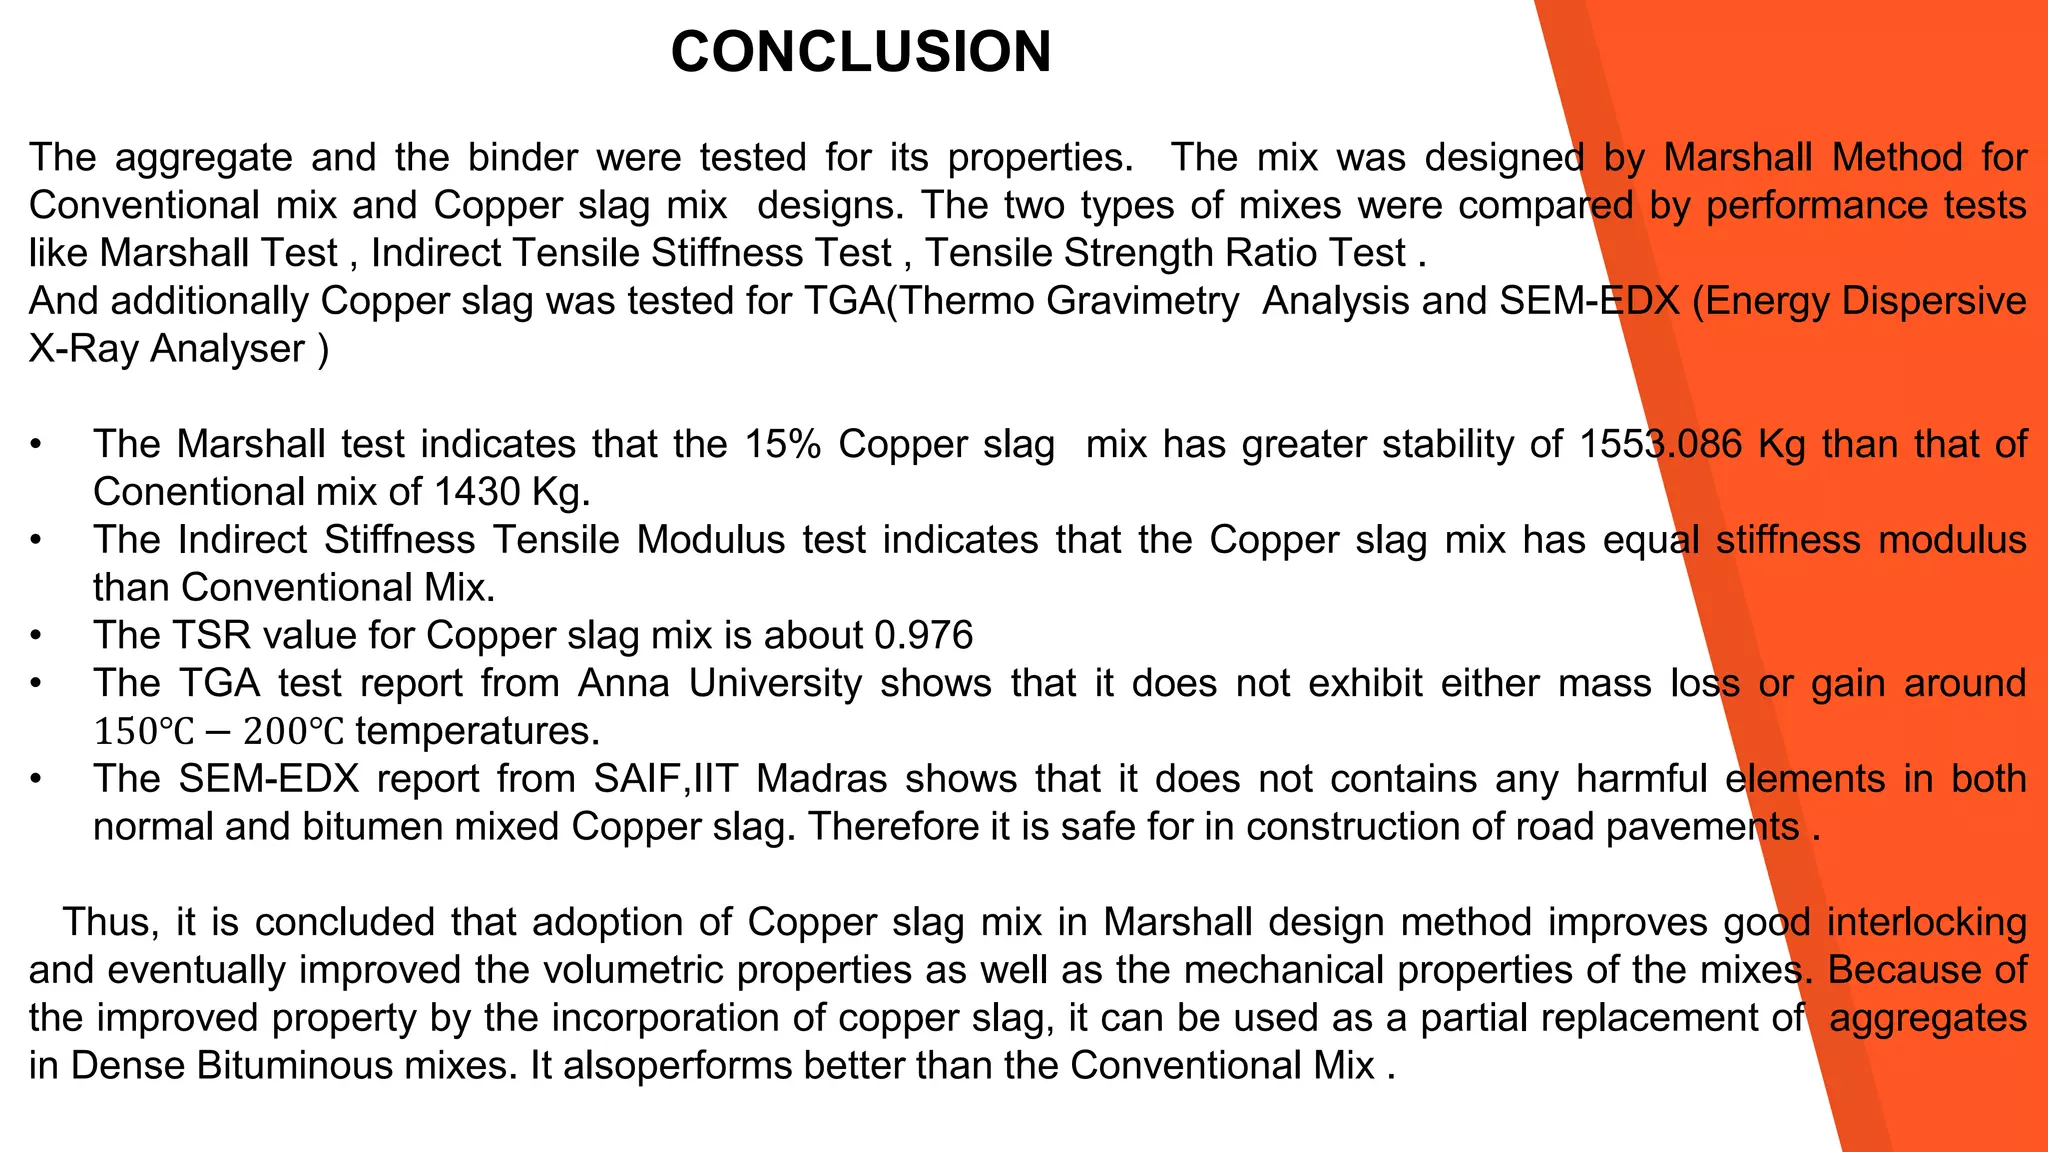
UTILIZATION OF COPPER SLAG IN
BITUMINOUS MIX
S.SANTHANU (3421450053)
B.KALAIARASAN (3421550031)
P.DHARMASEELAN (3421350010)
Project Guides
Mr. M.GANESH KUMAR (HRS)
Assistant Engineer , Bitumen Lab
Mrs.B.JAYASHREE
Assistant Professor , AVIT , Chennai
In India , there is a great demand of aggregates , mainly from civil engineering for road
construction and also for concrete construction.
Instead of using aggregates in roads & concrete construction,some of the waste
industrial by-products can be used widely.
These studies are mainly for safe and economic disposal of waste products for the better
and cost-effective .
Many of the highway agencies , private organizations and individuals are in the process
of completing a wide variety of studies and research projects concerning the feasibility ,
environment suitability , availability of waste products and performance of using waste
products in road construction
INTRODUCTION
OBJECTIVES
 To explore the use of copper slag as a
partial substitute in bituminous mix
 To test the properties of aggregate, bitumen & copper
slag
 To test the Tensile strength of bituminous material
TGA Analysis & SEM-EDX Anaysis of Copper slag
FORMATION OF OBJECTIVE
REVIEW OF LITERATURE
COLLECTION OF
MATERIALS
TESTING OF PROPERTIES
MIX DESIGN
TESTING OF SAMPLE
&
ANALYSIS OF RESULT
CONCLUSION
AGGREGATE
COPPER SLAG
BITUMEN
SOFTENING POINT
PENETRATION
VISCOSITY
SPECIFIC GRAVITY
IMPACT TEST
SIEVE ANALYSIS
FLAKINESS INDEX
ELONGATION INDEX
METHODOLOGY
COPPER SLAG
 The Copper is of fine textured glossy sand like material and
called as Granulated Copper slag
The granules are obtained by cooling the molten copper waste
The granulated copper slag are below 4.75 mm in size
60,000MT
Copper slag are produced per month in Sterlite
Industries India Ltd . Whoa! That’s a big number
NEW IDEAo Copper slag can be used in various Bituminous mixes
o By using Copper slag of desired quantity in DBM II
there are good interlocking and eventually improves
mechanical and volumetric properties of Bituminous
mix
o Thereby it is economic and can be used for laying
roads
COARSE
AGGREGATE
Coarse aggregates are particles greater than 4.75mm, but
generally range between 9.5mm to 37.5mm in diameter.
Coarse aggregates are three dimensional irregular bodies
LITERATURE
REVIEW
Let’s get to
know more
about CS
USE OF COPPER SLAG AS CONSTRUCTION MATERIAL
IN BITUMINOUS PAVEMENT
▸NKS PUNDHIR, C KAMARAJ AND PK NANDA–COPPER SLAG CS WAS USED AS FINE
AGGREGATE UP TO 20% IN THE DESIGN OF BITUMINOUS MIXES LIKE BITUMINOUS
MACDAM , DENSE BITUMINOUS MACDAM, BITUMINOUS CONCRETE .
▸ADDITION OF CS AS FINE AGGREGATE IN VARIOUS BITUMINOUS MIXES
PROVIDES GOOD INTERLOCKING AND EVENTUALLY IMPROVES VOLUMETRIC AND
MECHANICAL PROPERTIES OF BITUMINOUS MIX .
▸ADDITION OF COPPER SLAG AS VARIOUS BITUMINOUS MIXES
IMPROVES GOOD INTERLOCKING IN VOLUMETRIC PROPERTIES AND MECHANICAL
PROPERTIES OF THE MIXES .
▸BECAUSE OF THE IMPROVED PROPERTY BY THE INCORPORATION OF COPPER SLAG ,IT CAN
BE USED AS FINE AGGREGATE IN BITUMINOUS MIXES AS THE SUBSTITUTE WHICH IS
NORMALLY USED IN THE CONVENTIONAL BITUMINOUS MIXES.
▸FURTHER TEST TO BEDONE DIFFERENTLY FROM THIS PAPER.
Copper Slag as a stabilizing additive in
Bituminous Mix
Bindu C.S & Dr. K.S.Beena investigates the benefits of stabilizing the Copper Slag
in Bituminous mix. Conventional (without CS) and the modified mixtures were
subjected to performance tests including Marshall Stability, tensile strength
and compressive strength tests.
The Copper Slag coating is effective in improving the physical properties of aggregate
Marshall Properties shows that the stability increases.
The study showed that the percentage increase in compressive strength value in
the modified mix
Results indicated that flexible pavement with high-performance and durability can
be obtained with 10%- 20%.
WORK DONE
MATERIALS COLLECTED
1. Copper slag
2. Aggregate
3. Bitumen
COARSE AGGREGATE PROPERTIES
BITUMEN PROPERTIES
MIX DESIGN
TESTING OF MiX DESIGNS
Sieve Size
(mm)
26.5 13.2 6.7 2.36
26.5 - - - -
19 429.0 - - -
13.2 1421.0 - - -
9.5 150 582.0 - -
4.75 1418.0 1439.0 -
2.36 561.0 152.5
1.18 119.0
600 156.0
300 167.0
150 174.0
75 155.0
PAN 61.0
GRADATION ANALYSIS
Weight taken – 2000 gms
WEIGHT
(gm)
26.5 19 13.2 6.7 2.36
W1 696 696 696 696 696
W2 1448.0 1430.0 1416.0 1405.0 1376.0
W3 2071.5 2065.5 2052.0 2045.5 2012.0
W4 1595 1595 1595 1595 1595
SPECIFIC GRAVITY
Weight - gm
Sieve Sizes - mm
SIEVE SIZE (mm) SPECIFIC GRAVITY
26.5 2.729
19 2.785
13.2 2.737
6.7 2.748
2.36 2.585
SPECIFIC GRAVITY CALCULATION
SPECIFIC GRAVITY FORMULA – G = (W2 – W1) / (W4 – W1) ( W3 – W2)
WEIGHT
(gm)
26.5 19 13.2 6.7 2.36
UNCOMP
ACTED
3880.0 3991.0 3767.0 4111.0 4519.0
COMPAC
TED
4449.5 4299.5 4138.5 4402.0 5060.0
UNIT WEIGHT
Weight – grams
Sieve Size – mm
SIEVE SIZE (mm) UNIT WEIGHT (KN/m3)
26.5 1.336
19 1.330
13.2 1.268
6.7 1.365
2.36 1.536
UNIT WEIGHT CALCULATION
UNIT WEIGHT FORMULA = weight / Volume
SIEVE SIZE (mm) RETAINED (IN GRAMS)
4.75 -
2.36 413
1.18 335
600 768
300 367
150 77.5
75 24.5
Pan 15
GRADATION – COPPER SLAG
WEIGHT (grams) COPPER SLAG
W1 696.0
W2 1529.0
W3 2186.0
W4 1594.0
SPECIFIC GRAVITY – COPPER SLAG
SPECIFIC GRAVITY – 3.456
WEIGHT COPPER SLAG (grams)
UNCOMPACTED 5151.5
COMPACTED 5625
UNIT WEIGHT – COPPER SLAG
UNIT WEIGHT = 1.7289 KN/m3
TESTS ON BITUMEN
PAVING GRADES VG30
PENETRATION
(25 DEGREE C , 100 gm, 5s)
66
ABSOLUTE VISCOSITY
(60 DEGREE C, POISES)
2950
SOFTENING POINT 52
KINEMATIC VISCOSITY
(135 DEGREE C)
380
MIX DESIGN
ANALYSIS
OUR
PROCESS
IS EASY
PROPOTIONING
JOB MIX
TESTING & ANALYSIS
PROPOTIONING – Conventional mix
PROPOTIONING - CS 15%
MARSHAL STABILITY TEST – NORMAL MIX
S.NO WT. IN AIR
WT. IN
WATER
SSD WT. DENSITY STABILITY FLOW
1. 1239.5 720.8 1247.7 2.352 12.38 2.89
2. 1254.8 734.3 1257.2 2.400 15.73 3.44
3. 1247.0 725.4 1253.6 2.361 10.71 3.72
4. 1236.3 730.9 1239.7 2.433 13.99
2.89
5. 1245.7 732.6 1248.7 2.414 13.97 3.33
6. 1248.2 738.6 1248.8 2.446 17.64 4.91`
MARSHAL STABILITY TEST – DESIGNED MIX 10% COPPER SLAG
S.NO WT. IN AIR
WT. IN
WATER
SSD WT. DENSITY STABILITY FLOW
1. 1248.8 739.9 1258.9 2.406 8.06 3.41
2. 1248.0 743.1 1256.1 2.433 8.66 3.50
3. 1248.5 747.6 1254.0 2.465 11.87 4.11
4. 1244.0 737.5 1247.5 2.439 11.43
2.64
5. 1235.0 742.8 1237.3 2.497 10.93 2.70
6. 1243.4 742.0 1245.6 2.469 10.61 2.00
MARSHAL STABILITY TEST – DESIGNED MIX 15% COPPER SLAG
S.NO WT. IN AIR
WT. IN
WATER
SSD WT. DENSITY STABILITY FLOW
1. 1230.9 738.5 1237.1 2.469 12.89 2.82
2. 1243.0 750.8 1247.2 2.491 14.09 3.24
3. 1227.9 738.0 1232.4 2.492 12.71 2.94
4. 1222.1 732.2 1224.9 2.456 13.21
2.95
5. 1258.6 758.2 1260.9 2.493 14.37 2.99
6. 1252.2 756.9 1254.3 2.472 18.29 -
PROPERTIES For various MIXES
S.NO PROPERTY
Criteria as per
MORTH
(DBM MIX)
Conventional
Mix
CS – 10% CS – 15% CS – 20% CS – 25%
1. Stability (in Kgs) 900 1430 1139.8 1553.086 1082.527 1003.127
2. Flow (in mm) 2 - 4 3.25 2.885 3.035 3.024 2.985
3. Voids in Mix (%) 3 - 5 4.22 4.119 4.070 4.131 4.135
4.
Voids in
agg.filled with
bitumen (%)
65 - 75 71.39
72.454
72.871 73.231 74.653
5.
Optimum Binder
Content (%)
4.50 – 5.00 4.70 4.78 4.78 4.89 5.28
Gradation chart – Conventional mix
0
10
20
30
40
50
60
70
80
90
100
0.01 0.1 1 10 100
%passed
Sieve Size
minimum range maximum range designed gradation
Chart of copper slag 10 %
0
10
20
30
40
50
60
70
80
90
100
0.01 0.1 1 10 100
%passed
Sieve Size
minimum range
Chart of copper slag 15 %
0
10
20
30
40
50
60
70
80
90
100
0.01 0.1 1 10 100
%passed
Sieve Size
minimum range
Chart of Copper slag 15 % Chart of Copper slag 20 %
0
10
20
30
40
50
60
70
80
90
100
0.01 0.1 1 10 100
%passed
Sieve Size
minimum range maximum range
0
10
20
30
40
50
60
70
80
90
100
0.01 0.1 1 10 100
%passed
Sieve Size
minimum range maximum range
Chart of copper slag 25%
0
10
20
30
40
50
60
70
80
90
100
0.01 0.1 1 10 100
%passed
Sieve Size
minimum range maximum range
designed gradation
Air Voids %
1
2
3
4
5
6
7
8
9
10
11
12
4.0 4.5 5.0 5.5
%ofvoidsintotalmix
% by wt of aggregate
% of voids in total mix
Air Voids – 4.22%
Conventional mix
2.0
3.0
4.0
5.0
6.0
7.0
8.0
9.0
10.0
4 4.5 5 5.5 6
%Voids
% by wt of aggregate
Air Voids – 4.119%Bitumen Content – 4.70% Bitumen content – 4.78%
Copper slag - 10 %
2.0
3.0
4.0
5.0
6.0
7.0
8.0
9.0
10.0
4 4.5 5 5.5 6
%Voids
% by wt of aggregate
Copper slag – 15%
Air Voids – 4.070% Bitumen content – 4.78%
2.0
3.0
4.0
5.0
6.0
7.0
8.0
9.0
10.0
4 4.5 5 5.5 6
%Voids
% by wt of aggregate
Copper slag – 20%
Air Voids – 4.131% Bitumen content – 4.89%
2.0
3.0
4.0
5.0
6.0
7.0
8.0
9.0
10.0
4 4.5 5 5.5 6
%Voids
% by wt of aggregate
Copper slag – 25%
Air Voids – 4.135% Bitumen content – 5.28 %
DETERMINING OPTIMUM MIX OF COPPER SLAG
From the above Mix Designs it is Clear that 15% of Copper slag
shows good Stability (1553.086 Kg) compared to other copper slag mix and
conventional mix(1430Kg).
The Binder content keeps on increasing for 20% & 25% mixes and relatively
the Stability value decreases. Optimum Binder content for 15% is 4.78% and
the air voids is about 4.070% .Therefore we have taken 15% of Copper slag
as optimum for this study
1.TGA ANALYSIS OF COPPER SLAG
Thermogravimetric analysis (TGA) is a method of thermal analysis in which
changes in physical and chemical properties of materials are measured as a
function of increasing temperature (with constant heating rate), or as a
function of time (with constant temperature and/or constant mass loss). TGA
is commonly used to determine selected characteristics of materials that
exhibit either mass loss or gain due to decomposition, oxidation, or loss of
volatiles. TGA (Fig 1.1 , 1.2) can provide information about chemical
phenomena (eg : oxidation or reduction) .
1.1TGA ANALYSER
1.2 TGA FURNACE
SOURCE : ANNA UNIVERSITY
Fig 1.34- Weight Loss with respect to Temperature
2.INDIRECT TENSILE STIFFNESS MODULUS TEST
The tensile properties of bituminous mixtures are of interest to pavement engineers because of the problems
associated with cracking. Although SMA is not nearly as strong in tension as it is in compression, SMA tensile
strength is important in pavement applications. The indirect tensile strength test (IDT) is used to determine the
tensile properties of the bituminous mixture which can further be related to the cracking properties of the
pavement. Low temperature cracking, fatigue and rutting are the three major distress mechanisms. A higher
tensile strength corresponds to a stronger cracking resistance. At the same time, mixtures that are able to
tolerate higher strain prior to failure are more likely to resist cracking than those unable to tolerate high strains.
The experimental setup is shown in figure 2.
Characteristics Conventional mix Copper slag mix
Phase
1
Phase 2 Phase 1 Phase
2
Vertical Force (KN) 0.98 1.37 1.19 1.13
Horizontal Stress
(KPa)
95.7 134.0 119.5 113.3
Table 2.(a) Indirect Tensile Stiffness Modulus Test`
Rise-Time(ms) 126 123 129 126
Horizontal
Deformation(Microns)
5.0 5.2 5.1 5.1
Load Area Factor 0.603 0.610 0.605 0.610
Stiffness
Modulus(MPa)
1896 2496 2340 2222
Sl.
No.
Bitumen content Theoritical
Specific gravity
Bulk
Specific
Gravity
% Voids
(Va)
VMA Stability
(Kg)
Flow
(mm)
1 4.70%
(Conventional Mix) 2.542 2.435 4.22 14.75 1430 3.25
2
3
4 4.78%
(Copper Slag Mix) 2.597 2.492 4.070 15.020 1553.086 3.035
5
6
2.1. MARSHALL STABILITY TEST
Table 2.1.1 Marshall Stability Test (Comparison )
The Marshall test indicates that the Cooper slag added mix
design has greater stability of 1553.086 Kg than that of
Conventional Mix design of 1430 Kg.
SEM ANALYSIS OF COPPER SLAG
SEM provides detailed high resolution images of the sample by rastering a focussed electron beam across
the surface and detecting secondary or back-scattered electron signal. An Energy Dispersive X-Ray Analyzer
(EDX or EDA) is also used to provide elemental identification and quantitative compositional information. SEM
provides images with magnifications up to ~X50,000 allowing sub micron-scale features to be seen i.e. well
beyond the range of optical microscopes.
Graph 3 - SEM ANALYSIS FOR NORMAL COPPER SLAG
Source : SAIF, IIT MADRAS
Element Wt% At%
OK 22.43 41.81
FK 03.99 06.26
MgK 01.16 01.42
AlK 02.52 02.79
SiK 18.26 19.38
KK 00.79 00.61
CaK 02.74 02.04
FeK 48.11 25.69
Matrix Correction ZAF
Table 3.1 Copper slag Elements SEM ANALYSIS (Fig 3.1)
3.2 SEM ANALYSIS OF BITUMEN MIXED COPPER SLAG
Graph 3 (a) - SEM ANALYSIS FOR BITUMEN MIX COPPER SLAG
Element Wt% At%
CK 75.84 86.49
OK 07.68 06.58
NaK 00.62 00.37
MgK 00.40 00.23
AlK 01.47 00.75
SiK 05.37 02.62
SK 04.01 01.71
KK 00.45 00.16
CaK 00.90 00.31
FeK 03.26 00.80
Matrix Correction ZAF
SEM ANALYSIS (fig 3.2)Table 3.2 Copper slag
bitumen mix Element %
Tests for the Sample 1 & 2 (Fig 3.1 , 3.2) sent by SAIF, IIT Madras ; the results show that
there is no change in chemical composition as in Normal Copper slag and bitumen mixed
Copper slag . The elements are well within the permissible limits and hence these samples
are non-hazardous in nature and can be used in Highway road construction .
Source : SAIF, IIT MADRAS`
4 - Computation of Moisture Sensitivity
For Moisture sensitivity test as per AASHTO T 283, samples were tested for dry and wet strength conditions at
OBC. The wet set was first placed in water bath maintained at 60ºC for 24 h and then placed in an
environmental chamber at 25ºC for 2 h. The load was applied at the rate of 50 mm/min by loading a Marshall
specimen with compressive load acting parallel to and along the vertical diametric loading plane (Fig. 6). The
moisture sensitivity is determined as a ratio of the average tensile strengths of the wet and dry tensile strength
of the specimens. The Indirect Tensile Strength (ITS) is calculated from the equation given below:
FORMULA :
St = 2 p/π d t
where, P = load (kg), d = dia of specimen (cm), t = thickness of specimen (cm).
PROCEDURE :
1.Prepare 6 OBC Copper slag samples. Samples are usually 6 inches (150 mm) in diameter and 4 inches (100
mm) thick. After mixing has occurred, allow the mould to cool to room temperature for 2 hours.
2.Determine the theoretical maximum specific gravity (Gmm), bulk specific gravity (Gmb), height, volume and
air void content (Va) of each sample.
3.Divide the six moulds into two subsets of three. The average air void content (Va) for each subset should be
similar. One subset will be “unconditioned” (tested in a dry state) and the other will be “conditioned” (tested in a
saturated state)
4.Store Unconditioned moulds at room temperature until testing.
5.The moulds to be Conditioned are saturated with water to between 55 and 80 percent. Place each mould in a
vacuum container(Fig 8.1) supported above the container bottom by a spacer and fill the container with water
until the mould is covered by 1 inch (25 mm) of water. Apply a vacuum of 10 – 26 inches Hg partial pressure (13
– 67 kPa absolute pressure) for 5 to 10 minutes.
6.Remove the vacuum and let the mould sit under water for another 5 to 10 minutes.
7.Calculate bulk specific gravity (Gmb) and compare the SSD mass with the SSD mass obtained in step 6 to
determine the volume of absorbed water.
8.Determine degree of saturation by comparing volume of absorbed water with volume of air voids (Va)
obtained in step 6.
9.Cure the mould in an oven at 140°F (60°C) for 24 hours (Fig 8.2 ).
10.Place samples in a 77 °F (25 °C) water bath for a minimum of 2 hours(Fig 8.3 ).
Fig.4.2 Oven (60℃)Fig .4.1 Vacuum Container Fig.4.3 Water Bath (25℃)
Run an indirect tension test on each sample by placing the sample between the two bearing plates (Figure
4.4) in the testing machine and applying the load at a constant rate of 2 inches/minute (50 mm/minute). Make
sure the load is applied along the diameter of the sample. Record the tensile strength values and calculate and
report the tensile strength values.
Mould placed
between the two
bearing plates
before testing
Specific Gravity of aggregate 2.798
Specific Gravity of Bitumen
1.03
8
Mould No
Binder
Content by
Wt. of mix,
%
wt in air,
gm
wt in
water,
gm
SSD, gm
Bulk
Volume, cc
Bulk
Density,
gm/cc
Dimension
Gmm %Va
t, mm dia, mm
1
4.56
1249.1 748.5 1254.3 505.8 2.470 64.20 102.10 2.597 4.91
2
1267.2 761.3 1269.6 508.3 2.493 63.20 102.10 2.597 4.01
3
1244.2 747.3 1246.2 498.9 2.494 63.20 102.10 2.597 3.98
4
1224.8 742.5 1227.2 484.7 2.527 62.10 102.10 2.597 2.71
5
1256.8 760.0 1259.3 499.3 2.517 63.30 102.10 2.597 3.08
Table .4.1 Parameters measured for TSR Test
Calculation of TSR
Where:
TSR = tensile strength ratio
S1 = average tensile strength of unconditioned samples
S2 = average tensile strength of conditioned samples
Conditioned Dry
Mould
no
Va, cc
SSD, gm after
partial
Vaccum Vaw, cc Sr, %
Ultimate Load,
N
Tensil
Strength, Kpa,
S1
Ultimate Load,
N
Tensil
Strength, Kpa,
S2
1 24.9 934 90.7583
2 20.4 1283.00 15.80 77.5 986 97.3272
3 19.8 1257.00 12.80 64.5 1070 105.619
4 13.1 1236 124.166
5 15.4 985 97.0749
Conditioned Sample Average Tensile Strength, S1 = 101.47
Dry Sample Average Tensile Strength, S1 = 104
TSR = 0.976
Table .4.2 Calculation for TSR value
Obtained TSR value - 0.976
TSR value ranges from 0.80 - 1.00 i.e (not less than 0.7 and not more than 1.00 )
CONCLUSION
The aggregate and the binder were tested for its properties. The mix was designed by Marshall Method for
Conventional mix and Copper slag mix designs. The two types of mixes were compared by performance tests
like Marshall Test , Indirect Tensile Stiffness Test , Tensile Strength Ratio Test .
And additionally Copper slag was tested for TGA(Thermo Gravimetry Analysis and SEM-EDX (Energy Dispersive
X-Ray Analyser )
• The Marshall test indicates that the 15% Copper slag mix has greater stability of 1553.086 Kg than that of
Conentional mix of 1430 Kg.
• The Indirect Stiffness Tensile Modulus test indicates that the Copper slag mix has equal stiffness modulus
than Conventional Mix.
• The TSR value for Copper slag mix is about 0.976
• The TGA test report from Anna University shows that it does not exhibit either mass loss or gain around
150℃ − 200℃ temperatures.
• The SEM-EDX report from SAIF,IIT Madras shows that it does not contains any harmful elements in both
normal and bitumen mixed Copper slag. Therefore it is safe for in construction of road pavements .
Thus, it is concluded that adoption of Copper slag mix in Marshall design method improves good interlocking
and eventually improved the volumetric properties as well as the mechanical properties of the mixes. Because of
the improved property by the incorporation of copper slag, it can be used as a partial replacement of aggregates
in Dense Bituminous mixes. It alsoperforms better than the Conventional Mix .
REFERENCES
• Emery J J, Slag utilization in pavement construction, extending aggregate resources, ASTM STP 774,
1982, 95.
• Miller R H & Collins R J, Waste materials as potential replacements for highway aggregates, Report 166
(NCHRP, TRB, Washington, D C) 1976.
• Mag A & Boyle J J, Assessment of Ra226 and toxic element distribution at Tennessee Valley Authority
posphate slag stockpiles, muscle shoals, A L, Report of Investigations/1990
RI 9288 (United States Department of the Interior, Bureau of Mines, Washington, D C) 1990.
• Queneau P B, May L D & Cregar D E, Application of slag technology to recycling of solid wastes, Incineration
Conference, Knoxville, TN, May 1991.
• Bose S, Harit MC, Saluja P K, Kamaraj C, Singh M & Batra V S, New methodology for design of bituminous
macadam mixes, National Seminar on Transportation in 21st Century
(Department of Civil Engineering, TIET, Patiala) 23-24 Feb 2001.
• Bose S, Harit M C, Kamaraj C & Singh M, Development of mix design procedures for bituminous macadam
mixes for roads and highways, Highway Research Bulletin, Indian Roads Congress, Vol.65, Dec 2001,
Special Research Presentation at Annual Session of IRC, Kochi, Jan 2002.
• Bureau of Indian Standards, IS: 2386 (Part I-V), Methods of test for aggregates for concrete, 1963.
• Bureau of Indian Standards, IS: 6241, Methods of test for determination of stripping value of road aggregates,
1971.
• Manual for construction and supervision of bituminous works (Ministry Of Road Transport and Highways, Govt
of India, N Delhi) 2001, 62-65.
• Chakraborthy P & Dass A, Principles of transportation engineering (Prentice Hall of India Pvt. Ltd, New Delhi)
2003.
TO
 AVIT – Civil Department
 HRS(HIGHWAY RESEARCH STATION)
 IIT-MADRAS
 STERLITE INDUSTRIES INDIA LTD
 ANNA UNIVERSITY,Chennai

Utilization of Copper slag in Bituminous mix

  • 1.
    UTILIZATION OF COPPERSLAG IN BITUMINOUS MIX S.SANTHANU (3421450053) B.KALAIARASAN (3421550031) P.DHARMASEELAN (3421350010)
  • 2.
    Project Guides Mr. M.GANESHKUMAR (HRS) Assistant Engineer , Bitumen Lab Mrs.B.JAYASHREE Assistant Professor , AVIT , Chennai
  • 3.
    In India ,there is a great demand of aggregates , mainly from civil engineering for road construction and also for concrete construction. Instead of using aggregates in roads & concrete construction,some of the waste industrial by-products can be used widely. These studies are mainly for safe and economic disposal of waste products for the better and cost-effective . Many of the highway agencies , private organizations and individuals are in the process of completing a wide variety of studies and research projects concerning the feasibility , environment suitability , availability of waste products and performance of using waste products in road construction INTRODUCTION
  • 4.
    OBJECTIVES  To explorethe use of copper slag as a partial substitute in bituminous mix  To test the properties of aggregate, bitumen & copper slag  To test the Tensile strength of bituminous material TGA Analysis & SEM-EDX Anaysis of Copper slag
  • 5.
    FORMATION OF OBJECTIVE REVIEWOF LITERATURE COLLECTION OF MATERIALS TESTING OF PROPERTIES MIX DESIGN TESTING OF SAMPLE & ANALYSIS OF RESULT CONCLUSION AGGREGATE COPPER SLAG BITUMEN SOFTENING POINT PENETRATION VISCOSITY SPECIFIC GRAVITY IMPACT TEST SIEVE ANALYSIS FLAKINESS INDEX ELONGATION INDEX METHODOLOGY
  • 6.
    COPPER SLAG  TheCopper is of fine textured glossy sand like material and called as Granulated Copper slag The granules are obtained by cooling the molten copper waste The granulated copper slag are below 4.75 mm in size
  • 7.
    60,000MT Copper slag areproduced per month in Sterlite Industries India Ltd . Whoa! That’s a big number
  • 8.
    NEW IDEAo Copperslag can be used in various Bituminous mixes o By using Copper slag of desired quantity in DBM II there are good interlocking and eventually improves mechanical and volumetric properties of Bituminous mix o Thereby it is economic and can be used for laying roads
  • 9.
    COARSE AGGREGATE Coarse aggregates areparticles greater than 4.75mm, but generally range between 9.5mm to 37.5mm in diameter. Coarse aggregates are three dimensional irregular bodies
  • 10.
  • 11.
    USE OF COPPERSLAG AS CONSTRUCTION MATERIAL IN BITUMINOUS PAVEMENT ▸NKS PUNDHIR, C KAMARAJ AND PK NANDA–COPPER SLAG CS WAS USED AS FINE AGGREGATE UP TO 20% IN THE DESIGN OF BITUMINOUS MIXES LIKE BITUMINOUS MACDAM , DENSE BITUMINOUS MACDAM, BITUMINOUS CONCRETE . ▸ADDITION OF CS AS FINE AGGREGATE IN VARIOUS BITUMINOUS MIXES PROVIDES GOOD INTERLOCKING AND EVENTUALLY IMPROVES VOLUMETRIC AND MECHANICAL PROPERTIES OF BITUMINOUS MIX . ▸ADDITION OF COPPER SLAG AS VARIOUS BITUMINOUS MIXES IMPROVES GOOD INTERLOCKING IN VOLUMETRIC PROPERTIES AND MECHANICAL PROPERTIES OF THE MIXES . ▸BECAUSE OF THE IMPROVED PROPERTY BY THE INCORPORATION OF COPPER SLAG ,IT CAN BE USED AS FINE AGGREGATE IN BITUMINOUS MIXES AS THE SUBSTITUTE WHICH IS NORMALLY USED IN THE CONVENTIONAL BITUMINOUS MIXES. ▸FURTHER TEST TO BEDONE DIFFERENTLY FROM THIS PAPER.
  • 12.
    Copper Slag asa stabilizing additive in Bituminous Mix Bindu C.S & Dr. K.S.Beena investigates the benefits of stabilizing the Copper Slag in Bituminous mix. Conventional (without CS) and the modified mixtures were subjected to performance tests including Marshall Stability, tensile strength and compressive strength tests. The Copper Slag coating is effective in improving the physical properties of aggregate Marshall Properties shows that the stability increases. The study showed that the percentage increase in compressive strength value in the modified mix Results indicated that flexible pavement with high-performance and durability can be obtained with 10%- 20%.
  • 13.
    WORK DONE MATERIALS COLLECTED 1.Copper slag 2. Aggregate 3. Bitumen COARSE AGGREGATE PROPERTIES BITUMEN PROPERTIES MIX DESIGN TESTING OF MiX DESIGNS
  • 14.
    Sieve Size (mm) 26.5 13.26.7 2.36 26.5 - - - - 19 429.0 - - - 13.2 1421.0 - - - 9.5 150 582.0 - - 4.75 1418.0 1439.0 - 2.36 561.0 152.5 1.18 119.0 600 156.0 300 167.0 150 174.0 75 155.0 PAN 61.0 GRADATION ANALYSIS Weight taken – 2000 gms
  • 15.
    WEIGHT (gm) 26.5 19 13.26.7 2.36 W1 696 696 696 696 696 W2 1448.0 1430.0 1416.0 1405.0 1376.0 W3 2071.5 2065.5 2052.0 2045.5 2012.0 W4 1595 1595 1595 1595 1595 SPECIFIC GRAVITY Weight - gm Sieve Sizes - mm
  • 16.
    SIEVE SIZE (mm)SPECIFIC GRAVITY 26.5 2.729 19 2.785 13.2 2.737 6.7 2.748 2.36 2.585 SPECIFIC GRAVITY CALCULATION SPECIFIC GRAVITY FORMULA – G = (W2 – W1) / (W4 – W1) ( W3 – W2)
  • 17.
    WEIGHT (gm) 26.5 19 13.26.7 2.36 UNCOMP ACTED 3880.0 3991.0 3767.0 4111.0 4519.0 COMPAC TED 4449.5 4299.5 4138.5 4402.0 5060.0 UNIT WEIGHT Weight – grams Sieve Size – mm
  • 18.
    SIEVE SIZE (mm)UNIT WEIGHT (KN/m3) 26.5 1.336 19 1.330 13.2 1.268 6.7 1.365 2.36 1.536 UNIT WEIGHT CALCULATION UNIT WEIGHT FORMULA = weight / Volume
  • 19.
    SIEVE SIZE (mm)RETAINED (IN GRAMS) 4.75 - 2.36 413 1.18 335 600 768 300 367 150 77.5 75 24.5 Pan 15 GRADATION – COPPER SLAG
  • 20.
    WEIGHT (grams) COPPERSLAG W1 696.0 W2 1529.0 W3 2186.0 W4 1594.0 SPECIFIC GRAVITY – COPPER SLAG SPECIFIC GRAVITY – 3.456
  • 21.
    WEIGHT COPPER SLAG(grams) UNCOMPACTED 5151.5 COMPACTED 5625 UNIT WEIGHT – COPPER SLAG UNIT WEIGHT = 1.7289 KN/m3
  • 22.
    TESTS ON BITUMEN PAVINGGRADES VG30 PENETRATION (25 DEGREE C , 100 gm, 5s) 66 ABSOLUTE VISCOSITY (60 DEGREE C, POISES) 2950 SOFTENING POINT 52 KINEMATIC VISCOSITY (135 DEGREE C) 380
  • 24.
  • 25.
  • 26.
  • 27.
  • 28.
    MARSHAL STABILITY TEST– NORMAL MIX S.NO WT. IN AIR WT. IN WATER SSD WT. DENSITY STABILITY FLOW 1. 1239.5 720.8 1247.7 2.352 12.38 2.89 2. 1254.8 734.3 1257.2 2.400 15.73 3.44 3. 1247.0 725.4 1253.6 2.361 10.71 3.72 4. 1236.3 730.9 1239.7 2.433 13.99 2.89 5. 1245.7 732.6 1248.7 2.414 13.97 3.33 6. 1248.2 738.6 1248.8 2.446 17.64 4.91`
  • 29.
    MARSHAL STABILITY TEST– DESIGNED MIX 10% COPPER SLAG S.NO WT. IN AIR WT. IN WATER SSD WT. DENSITY STABILITY FLOW 1. 1248.8 739.9 1258.9 2.406 8.06 3.41 2. 1248.0 743.1 1256.1 2.433 8.66 3.50 3. 1248.5 747.6 1254.0 2.465 11.87 4.11 4. 1244.0 737.5 1247.5 2.439 11.43 2.64 5. 1235.0 742.8 1237.3 2.497 10.93 2.70 6. 1243.4 742.0 1245.6 2.469 10.61 2.00
  • 30.
    MARSHAL STABILITY TEST– DESIGNED MIX 15% COPPER SLAG S.NO WT. IN AIR WT. IN WATER SSD WT. DENSITY STABILITY FLOW 1. 1230.9 738.5 1237.1 2.469 12.89 2.82 2. 1243.0 750.8 1247.2 2.491 14.09 3.24 3. 1227.9 738.0 1232.4 2.492 12.71 2.94 4. 1222.1 732.2 1224.9 2.456 13.21 2.95 5. 1258.6 758.2 1260.9 2.493 14.37 2.99 6. 1252.2 756.9 1254.3 2.472 18.29 -
  • 31.
    PROPERTIES For variousMIXES S.NO PROPERTY Criteria as per MORTH (DBM MIX) Conventional Mix CS – 10% CS – 15% CS – 20% CS – 25% 1. Stability (in Kgs) 900 1430 1139.8 1553.086 1082.527 1003.127 2. Flow (in mm) 2 - 4 3.25 2.885 3.035 3.024 2.985 3. Voids in Mix (%) 3 - 5 4.22 4.119 4.070 4.131 4.135 4. Voids in agg.filled with bitumen (%) 65 - 75 71.39 72.454 72.871 73.231 74.653 5. Optimum Binder Content (%) 4.50 – 5.00 4.70 4.78 4.78 4.89 5.28
  • 32.
    Gradation chart –Conventional mix 0 10 20 30 40 50 60 70 80 90 100 0.01 0.1 1 10 100 %passed Sieve Size minimum range maximum range designed gradation
  • 33.
    Chart of copperslag 10 % 0 10 20 30 40 50 60 70 80 90 100 0.01 0.1 1 10 100 %passed Sieve Size minimum range Chart of copper slag 15 % 0 10 20 30 40 50 60 70 80 90 100 0.01 0.1 1 10 100 %passed Sieve Size minimum range
  • 34.
    Chart of Copperslag 15 % Chart of Copper slag 20 % 0 10 20 30 40 50 60 70 80 90 100 0.01 0.1 1 10 100 %passed Sieve Size minimum range maximum range 0 10 20 30 40 50 60 70 80 90 100 0.01 0.1 1 10 100 %passed Sieve Size minimum range maximum range
  • 35.
    Chart of copperslag 25% 0 10 20 30 40 50 60 70 80 90 100 0.01 0.1 1 10 100 %passed Sieve Size minimum range maximum range designed gradation
  • 36.
    Air Voids % 1 2 3 4 5 6 7 8 9 10 11 12 4.04.5 5.0 5.5 %ofvoidsintotalmix % by wt of aggregate % of voids in total mix Air Voids – 4.22% Conventional mix 2.0 3.0 4.0 5.0 6.0 7.0 8.0 9.0 10.0 4 4.5 5 5.5 6 %Voids % by wt of aggregate Air Voids – 4.119%Bitumen Content – 4.70% Bitumen content – 4.78% Copper slag - 10 %
  • 37.
    2.0 3.0 4.0 5.0 6.0 7.0 8.0 9.0 10.0 4 4.5 55.5 6 %Voids % by wt of aggregate Copper slag – 15% Air Voids – 4.070% Bitumen content – 4.78% 2.0 3.0 4.0 5.0 6.0 7.0 8.0 9.0 10.0 4 4.5 5 5.5 6 %Voids % by wt of aggregate Copper slag – 20% Air Voids – 4.131% Bitumen content – 4.89%
  • 38.
    2.0 3.0 4.0 5.0 6.0 7.0 8.0 9.0 10.0 4 4.5 55.5 6 %Voids % by wt of aggregate Copper slag – 25% Air Voids – 4.135% Bitumen content – 5.28 %
  • 39.
    DETERMINING OPTIMUM MIXOF COPPER SLAG From the above Mix Designs it is Clear that 15% of Copper slag shows good Stability (1553.086 Kg) compared to other copper slag mix and conventional mix(1430Kg). The Binder content keeps on increasing for 20% & 25% mixes and relatively the Stability value decreases. Optimum Binder content for 15% is 4.78% and the air voids is about 4.070% .Therefore we have taken 15% of Copper slag as optimum for this study 1.TGA ANALYSIS OF COPPER SLAG Thermogravimetric analysis (TGA) is a method of thermal analysis in which changes in physical and chemical properties of materials are measured as a function of increasing temperature (with constant heating rate), or as a function of time (with constant temperature and/or constant mass loss). TGA is commonly used to determine selected characteristics of materials that exhibit either mass loss or gain due to decomposition, oxidation, or loss of volatiles. TGA (Fig 1.1 , 1.2) can provide information about chemical phenomena (eg : oxidation or reduction) . 1.1TGA ANALYSER 1.2 TGA FURNACE
  • 40.
    SOURCE : ANNAUNIVERSITY
  • 41.
    Fig 1.34- WeightLoss with respect to Temperature
  • 42.
    2.INDIRECT TENSILE STIFFNESSMODULUS TEST The tensile properties of bituminous mixtures are of interest to pavement engineers because of the problems associated with cracking. Although SMA is not nearly as strong in tension as it is in compression, SMA tensile strength is important in pavement applications. The indirect tensile strength test (IDT) is used to determine the tensile properties of the bituminous mixture which can further be related to the cracking properties of the pavement. Low temperature cracking, fatigue and rutting are the three major distress mechanisms. A higher tensile strength corresponds to a stronger cracking resistance. At the same time, mixtures that are able to tolerate higher strain prior to failure are more likely to resist cracking than those unable to tolerate high strains. The experimental setup is shown in figure 2. Characteristics Conventional mix Copper slag mix Phase 1 Phase 2 Phase 1 Phase 2 Vertical Force (KN) 0.98 1.37 1.19 1.13 Horizontal Stress (KPa) 95.7 134.0 119.5 113.3 Table 2.(a) Indirect Tensile Stiffness Modulus Test` Rise-Time(ms) 126 123 129 126 Horizontal Deformation(Microns) 5.0 5.2 5.1 5.1 Load Area Factor 0.603 0.610 0.605 0.610 Stiffness Modulus(MPa) 1896 2496 2340 2222
  • 43.
    Sl. No. Bitumen content Theoritical Specificgravity Bulk Specific Gravity % Voids (Va) VMA Stability (Kg) Flow (mm) 1 4.70% (Conventional Mix) 2.542 2.435 4.22 14.75 1430 3.25 2 3 4 4.78% (Copper Slag Mix) 2.597 2.492 4.070 15.020 1553.086 3.035 5 6 2.1. MARSHALL STABILITY TEST Table 2.1.1 Marshall Stability Test (Comparison ) The Marshall test indicates that the Cooper slag added mix design has greater stability of 1553.086 Kg than that of Conventional Mix design of 1430 Kg.
  • 44.
    SEM ANALYSIS OFCOPPER SLAG SEM provides detailed high resolution images of the sample by rastering a focussed electron beam across the surface and detecting secondary or back-scattered electron signal. An Energy Dispersive X-Ray Analyzer (EDX or EDA) is also used to provide elemental identification and quantitative compositional information. SEM provides images with magnifications up to ~X50,000 allowing sub micron-scale features to be seen i.e. well beyond the range of optical microscopes. Graph 3 - SEM ANALYSIS FOR NORMAL COPPER SLAG Source : SAIF, IIT MADRAS
  • 45.
    Element Wt% At% OK22.43 41.81 FK 03.99 06.26 MgK 01.16 01.42 AlK 02.52 02.79 SiK 18.26 19.38 KK 00.79 00.61 CaK 02.74 02.04 FeK 48.11 25.69 Matrix Correction ZAF Table 3.1 Copper slag Elements SEM ANALYSIS (Fig 3.1) 3.2 SEM ANALYSIS OF BITUMEN MIXED COPPER SLAG Graph 3 (a) - SEM ANALYSIS FOR BITUMEN MIX COPPER SLAG
  • 46.
    Element Wt% At% CK75.84 86.49 OK 07.68 06.58 NaK 00.62 00.37 MgK 00.40 00.23 AlK 01.47 00.75 SiK 05.37 02.62 SK 04.01 01.71 KK 00.45 00.16 CaK 00.90 00.31 FeK 03.26 00.80 Matrix Correction ZAF SEM ANALYSIS (fig 3.2)Table 3.2 Copper slag bitumen mix Element % Tests for the Sample 1 & 2 (Fig 3.1 , 3.2) sent by SAIF, IIT Madras ; the results show that there is no change in chemical composition as in Normal Copper slag and bitumen mixed Copper slag . The elements are well within the permissible limits and hence these samples are non-hazardous in nature and can be used in Highway road construction . Source : SAIF, IIT MADRAS`
  • 47.
    4 - Computationof Moisture Sensitivity For Moisture sensitivity test as per AASHTO T 283, samples were tested for dry and wet strength conditions at OBC. The wet set was first placed in water bath maintained at 60ºC for 24 h and then placed in an environmental chamber at 25ºC for 2 h. The load was applied at the rate of 50 mm/min by loading a Marshall specimen with compressive load acting parallel to and along the vertical diametric loading plane (Fig. 6). The moisture sensitivity is determined as a ratio of the average tensile strengths of the wet and dry tensile strength of the specimens. The Indirect Tensile Strength (ITS) is calculated from the equation given below: FORMULA : St = 2 p/π d t where, P = load (kg), d = dia of specimen (cm), t = thickness of specimen (cm). PROCEDURE : 1.Prepare 6 OBC Copper slag samples. Samples are usually 6 inches (150 mm) in diameter and 4 inches (100 mm) thick. After mixing has occurred, allow the mould to cool to room temperature for 2 hours. 2.Determine the theoretical maximum specific gravity (Gmm), bulk specific gravity (Gmb), height, volume and air void content (Va) of each sample. 3.Divide the six moulds into two subsets of three. The average air void content (Va) for each subset should be similar. One subset will be “unconditioned” (tested in a dry state) and the other will be “conditioned” (tested in a saturated state) 4.Store Unconditioned moulds at room temperature until testing. 5.The moulds to be Conditioned are saturated with water to between 55 and 80 percent. Place each mould in a vacuum container(Fig 8.1) supported above the container bottom by a spacer and fill the container with water until the mould is covered by 1 inch (25 mm) of water. Apply a vacuum of 10 – 26 inches Hg partial pressure (13 – 67 kPa absolute pressure) for 5 to 10 minutes.
  • 48.
    6.Remove the vacuumand let the mould sit under water for another 5 to 10 minutes. 7.Calculate bulk specific gravity (Gmb) and compare the SSD mass with the SSD mass obtained in step 6 to determine the volume of absorbed water. 8.Determine degree of saturation by comparing volume of absorbed water with volume of air voids (Va) obtained in step 6. 9.Cure the mould in an oven at 140°F (60°C) for 24 hours (Fig 8.2 ). 10.Place samples in a 77 °F (25 °C) water bath for a minimum of 2 hours(Fig 8.3 ). Fig.4.2 Oven (60℃)Fig .4.1 Vacuum Container Fig.4.3 Water Bath (25℃) Run an indirect tension test on each sample by placing the sample between the two bearing plates (Figure 4.4) in the testing machine and applying the load at a constant rate of 2 inches/minute (50 mm/minute). Make sure the load is applied along the diameter of the sample. Record the tensile strength values and calculate and report the tensile strength values.
  • 49.
    Mould placed between thetwo bearing plates before testing Specific Gravity of aggregate 2.798 Specific Gravity of Bitumen 1.03 8 Mould No Binder Content by Wt. of mix, % wt in air, gm wt in water, gm SSD, gm Bulk Volume, cc Bulk Density, gm/cc Dimension Gmm %Va t, mm dia, mm 1 4.56 1249.1 748.5 1254.3 505.8 2.470 64.20 102.10 2.597 4.91 2 1267.2 761.3 1269.6 508.3 2.493 63.20 102.10 2.597 4.01 3 1244.2 747.3 1246.2 498.9 2.494 63.20 102.10 2.597 3.98 4 1224.8 742.5 1227.2 484.7 2.527 62.10 102.10 2.597 2.71 5 1256.8 760.0 1259.3 499.3 2.517 63.30 102.10 2.597 3.08 Table .4.1 Parameters measured for TSR Test Calculation of TSR Where: TSR = tensile strength ratio S1 = average tensile strength of unconditioned samples S2 = average tensile strength of conditioned samples
  • 50.
    Conditioned Dry Mould no Va, cc SSD,gm after partial Vaccum Vaw, cc Sr, % Ultimate Load, N Tensil Strength, Kpa, S1 Ultimate Load, N Tensil Strength, Kpa, S2 1 24.9 934 90.7583 2 20.4 1283.00 15.80 77.5 986 97.3272 3 19.8 1257.00 12.80 64.5 1070 105.619 4 13.1 1236 124.166 5 15.4 985 97.0749 Conditioned Sample Average Tensile Strength, S1 = 101.47 Dry Sample Average Tensile Strength, S1 = 104 TSR = 0.976 Table .4.2 Calculation for TSR value Obtained TSR value - 0.976 TSR value ranges from 0.80 - 1.00 i.e (not less than 0.7 and not more than 1.00 )
  • 51.
    CONCLUSION The aggregate andthe binder were tested for its properties. The mix was designed by Marshall Method for Conventional mix and Copper slag mix designs. The two types of mixes were compared by performance tests like Marshall Test , Indirect Tensile Stiffness Test , Tensile Strength Ratio Test . And additionally Copper slag was tested for TGA(Thermo Gravimetry Analysis and SEM-EDX (Energy Dispersive X-Ray Analyser ) • The Marshall test indicates that the 15% Copper slag mix has greater stability of 1553.086 Kg than that of Conentional mix of 1430 Kg. • The Indirect Stiffness Tensile Modulus test indicates that the Copper slag mix has equal stiffness modulus than Conventional Mix. • The TSR value for Copper slag mix is about 0.976 • The TGA test report from Anna University shows that it does not exhibit either mass loss or gain around 150℃ − 200℃ temperatures. • The SEM-EDX report from SAIF,IIT Madras shows that it does not contains any harmful elements in both normal and bitumen mixed Copper slag. Therefore it is safe for in construction of road pavements . Thus, it is concluded that adoption of Copper slag mix in Marshall design method improves good interlocking and eventually improved the volumetric properties as well as the mechanical properties of the mixes. Because of the improved property by the incorporation of copper slag, it can be used as a partial replacement of aggregates in Dense Bituminous mixes. It alsoperforms better than the Conventional Mix .
  • 52.
    REFERENCES • Emery JJ, Slag utilization in pavement construction, extending aggregate resources, ASTM STP 774, 1982, 95. • Miller R H & Collins R J, Waste materials as potential replacements for highway aggregates, Report 166 (NCHRP, TRB, Washington, D C) 1976. • Mag A & Boyle J J, Assessment of Ra226 and toxic element distribution at Tennessee Valley Authority posphate slag stockpiles, muscle shoals, A L, Report of Investigations/1990 RI 9288 (United States Department of the Interior, Bureau of Mines, Washington, D C) 1990. • Queneau P B, May L D & Cregar D E, Application of slag technology to recycling of solid wastes, Incineration Conference, Knoxville, TN, May 1991. • Bose S, Harit MC, Saluja P K, Kamaraj C, Singh M & Batra V S, New methodology for design of bituminous macadam mixes, National Seminar on Transportation in 21st Century (Department of Civil Engineering, TIET, Patiala) 23-24 Feb 2001. • Bose S, Harit M C, Kamaraj C & Singh M, Development of mix design procedures for bituminous macadam mixes for roads and highways, Highway Research Bulletin, Indian Roads Congress, Vol.65, Dec 2001, Special Research Presentation at Annual Session of IRC, Kochi, Jan 2002. • Bureau of Indian Standards, IS: 2386 (Part I-V), Methods of test for aggregates for concrete, 1963. • Bureau of Indian Standards, IS: 6241, Methods of test for determination of stripping value of road aggregates, 1971. • Manual for construction and supervision of bituminous works (Ministry Of Road Transport and Highways, Govt of India, N Delhi) 2001, 62-65. • Chakraborthy P & Dass A, Principles of transportation engineering (Prentice Hall of India Pvt. Ltd, New Delhi) 2003.
  • 53.
    TO  AVIT –Civil Department  HRS(HIGHWAY RESEARCH STATION)  IIT-MADRAS  STERLITE INDUSTRIES INDIA LTD  ANNA UNIVERSITY,Chennai