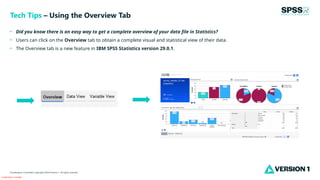
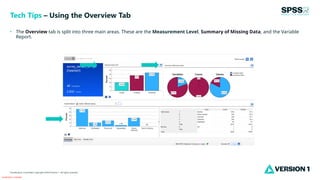
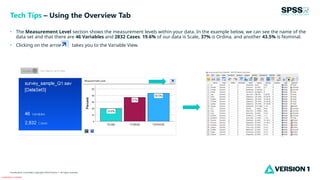
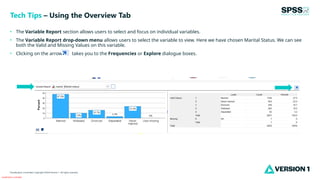
Classification: Controlled
Classification: Controlled. Copyright ©2024 Version 1. All rights reserved.
Using the
Overview Tab
Tech Tips – IBM SPSS Statistics
Classification: Controlled
Classification: Controlled. Copyright ©2024 Version 1. All rights reserved.
• Did you know there is an easy way to get a complete overview of your data file in Statistics?
• Users can click on the Overview tab to obtain a complete visual and statistical view of their data.
• The Overview tab is a new feature in IBM SPSS Statistics version 29.0.1.
Tech Tips – Using the Overview Tab
Classification: Controlled
Classification: Controlled. Copyright ©2024 Version 1. All rights reserved.
• The Overview tab is split into three main areas. These are the Measurement Level, Summary of Missing Data, and the Variable
Report.
Tech Tips – Using the Overview Tab
Classification: Controlled
Classification: Controlled. Copyright ©2024 Version 1. All rights reserved.
• The Measurement Level section shows the measurement levels within your data. In the example below, we can see the name of the
data set and that there are 46 Variables and 2832 Cases. 19.6% of our data is Scale, 37% is Ordina, and another 43.5% is Nominal.
• Clicking on the arrow takes you to the Variable View.
Tech Tips – Using the Overview Tab
Classification: Controlled
Classification: Controlled. Copyright ©2024 Version 1. All rights reserved.
• The Variable Report section allows users to select and focus on individual variables.
• The Variable Report drop-down menu allows users to select the variable to view. Here we have chosen Marital Status. We can see
both the Valid and Missing Values on this variable.
• Clicking on the arrow takes you to the Frequencies or Explore dialogue boxes.
Tech Tips – Using the Overview Tab
Classification: Controlled
Classification: Controlled. Copyright ©2024 Version 1. All rights reserved.
For more information
please visit spssanalyticspartner.com
Thank You

Using the Overview Tab in IBM SPSS Statistics.pptx

  • 1.
    Classification: Controlled Classification: Controlled.Copyright ©2024 Version 1. All rights reserved. Using the Overview Tab Tech Tips – IBM SPSS Statistics
  • 2.
    Classification: Controlled Classification: Controlled.Copyright ©2024 Version 1. All rights reserved. • Did you know there is an easy way to get a complete overview of your data file in Statistics? • Users can click on the Overview tab to obtain a complete visual and statistical view of their data. • The Overview tab is a new feature in IBM SPSS Statistics version 29.0.1. Tech Tips – Using the Overview Tab
  • 3.
    Classification: Controlled Classification: Controlled.Copyright ©2024 Version 1. All rights reserved. • The Overview tab is split into three main areas. These are the Measurement Level, Summary of Missing Data, and the Variable Report. Tech Tips – Using the Overview Tab
  • 4.
    Classification: Controlled Classification: Controlled.Copyright ©2024 Version 1. All rights reserved. • The Measurement Level section shows the measurement levels within your data. In the example below, we can see the name of the data set and that there are 46 Variables and 2832 Cases. 19.6% of our data is Scale, 37% is Ordina, and another 43.5% is Nominal. • Clicking on the arrow takes you to the Variable View. Tech Tips – Using the Overview Tab
  • 5.
    Classification: Controlled Classification: Controlled.Copyright ©2024 Version 1. All rights reserved. • The Variable Report section allows users to select and focus on individual variables. • The Variable Report drop-down menu allows users to select the variable to view. Here we have chosen Marital Status. We can see both the Valid and Missing Values on this variable. • Clicking on the arrow takes you to the Frequencies or Explore dialogue boxes. Tech Tips – Using the Overview Tab
  • 6.
    Classification: Controlled Classification: Controlled.Copyright ©2024 Version 1. All rights reserved. For more information please visit spssanalyticspartner.com Thank You