More Related Content

PDF
Anomaly detection Workshop slides 
PPTX
Outlier analysis and anomaly detection 
PDF
Data-Screening qqwewqewqeqeqwewqewqeqweqweqwewq.pdf 
PPTX
Navigating-the-Noise-A-Practical-Guide-to-Outliers-in-Data.pptx 
PDF
Introduction to unsupervised learning: outlier detection 
PPTX

PDF

PDF
Multiple Linear Regression Models in Outlier Detection Similar to How to Detect Outliers in IBM SPSS Statistics.pptx

PPTX
Exploratory_Data_Analysis on data analysis using python.pptx 
PPTX
Variables , outlier and its detection and Missing values 
PPTX
Outlier-Detection-in-Higher-Dimensions in data mining 
PPT

PDF
Course-CO9301: Unsupervised Modelling for AIML Unit-II:Feature Engineering T... 
PPTX
40_P17CSC310_2020120905054844.pptxffffff 
PPTX
Outlier analysis,Chapter-12, Data Mining: Concepts and Techniques 
PDF
Dealing with outliers in Clinical Research 
PPT
data engineering topic on cluster analysis 
PDF

PPT
12Outlier.for software introductionalism 
PPT
Chapter 12. Outlier Detection.ppt 
PPTX
What is Outlier Analysis and How Can It Improve Analysis? 
PPTX
Data Mining: Outlier analysis 
PPT
Data cleaning-outlier-detection 
PDF

PPTX
Data Mining: Outlier analysis 
DOCX
Data Mining Anomaly DetectionLecture Notes for Chapt.docx 
PDF

PDF
SELECTED DATA PREPARATION METHODS More from Version 1 Analytics

PPTX
Aggregating Records in IBM SPSS Statistics 
PPTX
Auto Data Preparation in IBM SPSS Modeler.pptx 
PPTX
How to Create Groups from Numeric Variables with Visual Binning.pptx 
PPTX
Running Means Procedure in IBM SPSS Statistics 
PPTX
ChiSquare Procedure in IBM SPSS Statistics Version 31.pptx 
PPTX
Customise Your Correlation Table in IBM SPSS Statistics.pptx 
PPTX
Visualising Data with Scatterplots in IBM SPSS Statistics.pptx 
PPTX
Curated Help for T-Tests in IBM SPSS Statistics 
PPTX
How to Import a CSV File into IBM SPSS Statistics.pptx 
PPTX
Split into Files in IBM SPSS Statitistics.pptx 
PPTX
Replace Missing Values. in IBM SPSS Statistics 
PPTX
How to Import an Excel File into IBM SPSS Statistics.pptx 
PPTX
Change Common Properties in IBM SPSS Statistics Version 31.pptx 
PPTX
Finding Your License Details in IBM SPSS Statistics Version 31.pptx 
PPTX
Homogeneity of Variance Test Options IBM SPSS Statistics Version 31.pptx 
PPTX
Coefficient of Variance in IBM SPSS Statistics Version 31.pptx 
PPTX
Clustered Bar Charts IBM SPSS Statistics.pptx 
PPTX
Row Panels for Bar Charts in IBM SPSS Statistics.pptx 
PDF
Add Background Images to Charts in IBM SPSS Statistics Version 31.pdf 
PPTX
Help for Correlations in IBM SPSS Statistics.pptx Recently uploaded

PPTX
Session 2 - Solving Unstructured & Complex Documents with UiPath IXP 
PDF
The State of the Gen AI economy - 2025 - The Meliora Company 
PDF
100 Insights After the 200th Issue of NewMind AI Journal 
PDF
Real-Time Data Insight Using Microsoft Forms for Business 
PPTX
UiPath Autonomous Agents | Building and Orchestrating Agents End-to-End 
PPTX
From Backup to Resilience: How MSPs Are Preparing for 2026 
PDF
TrustArc Webinar - Looking Ahead: The 2026 Privacy Landscape 
PDF
HCSP-Presales-Campus Network Planning and Design V2.0 
PPTX
Conversational Agents – Building Intelligent Assistants [Virtual Hands-on Wor... 
PDF
Security Forum Sessions from Houston 2025 Event 
PDF
Day 4 - Access, Deployments, and Monitoring - 2nd Sight Lab Cloud Security Class 
PDF
Data Virtualization in Action: Scaling APIs and Apps with FME 
PDF
WHITE PAPER_ Ransomware Payment Policy and Resilience Strategy_ A Framework f... 
PDF
Our Digital Tribe_ Cultivating Connection and Growth in Our Slack Community 🌿... 
PDF
WCAG Analyzer Tools and Techniques for User-Friendly Websites 
DOCX
iRobot Post‑Mortem and Alternative Paths - Discussion Document for Boards and... 
PDF
Day 5 - Red Team + Blue Team in the Cloud - 2nd Sight Lab Cloud Security Class 
PPTX
wob-report.pptxwob-report.pptxwob-report.pptx 
PPTX
MGw_MRS Benfits seu beficios de redes 4g 
PDF
Is It Possible to Have Wi-Fi Without an Internet Provider How to Detect Outliers in IBM SPSS Statistics.pptx
- 1.
- 2.
Classification: Controlled. Copyright©2025 Version 1. All rights reserved.
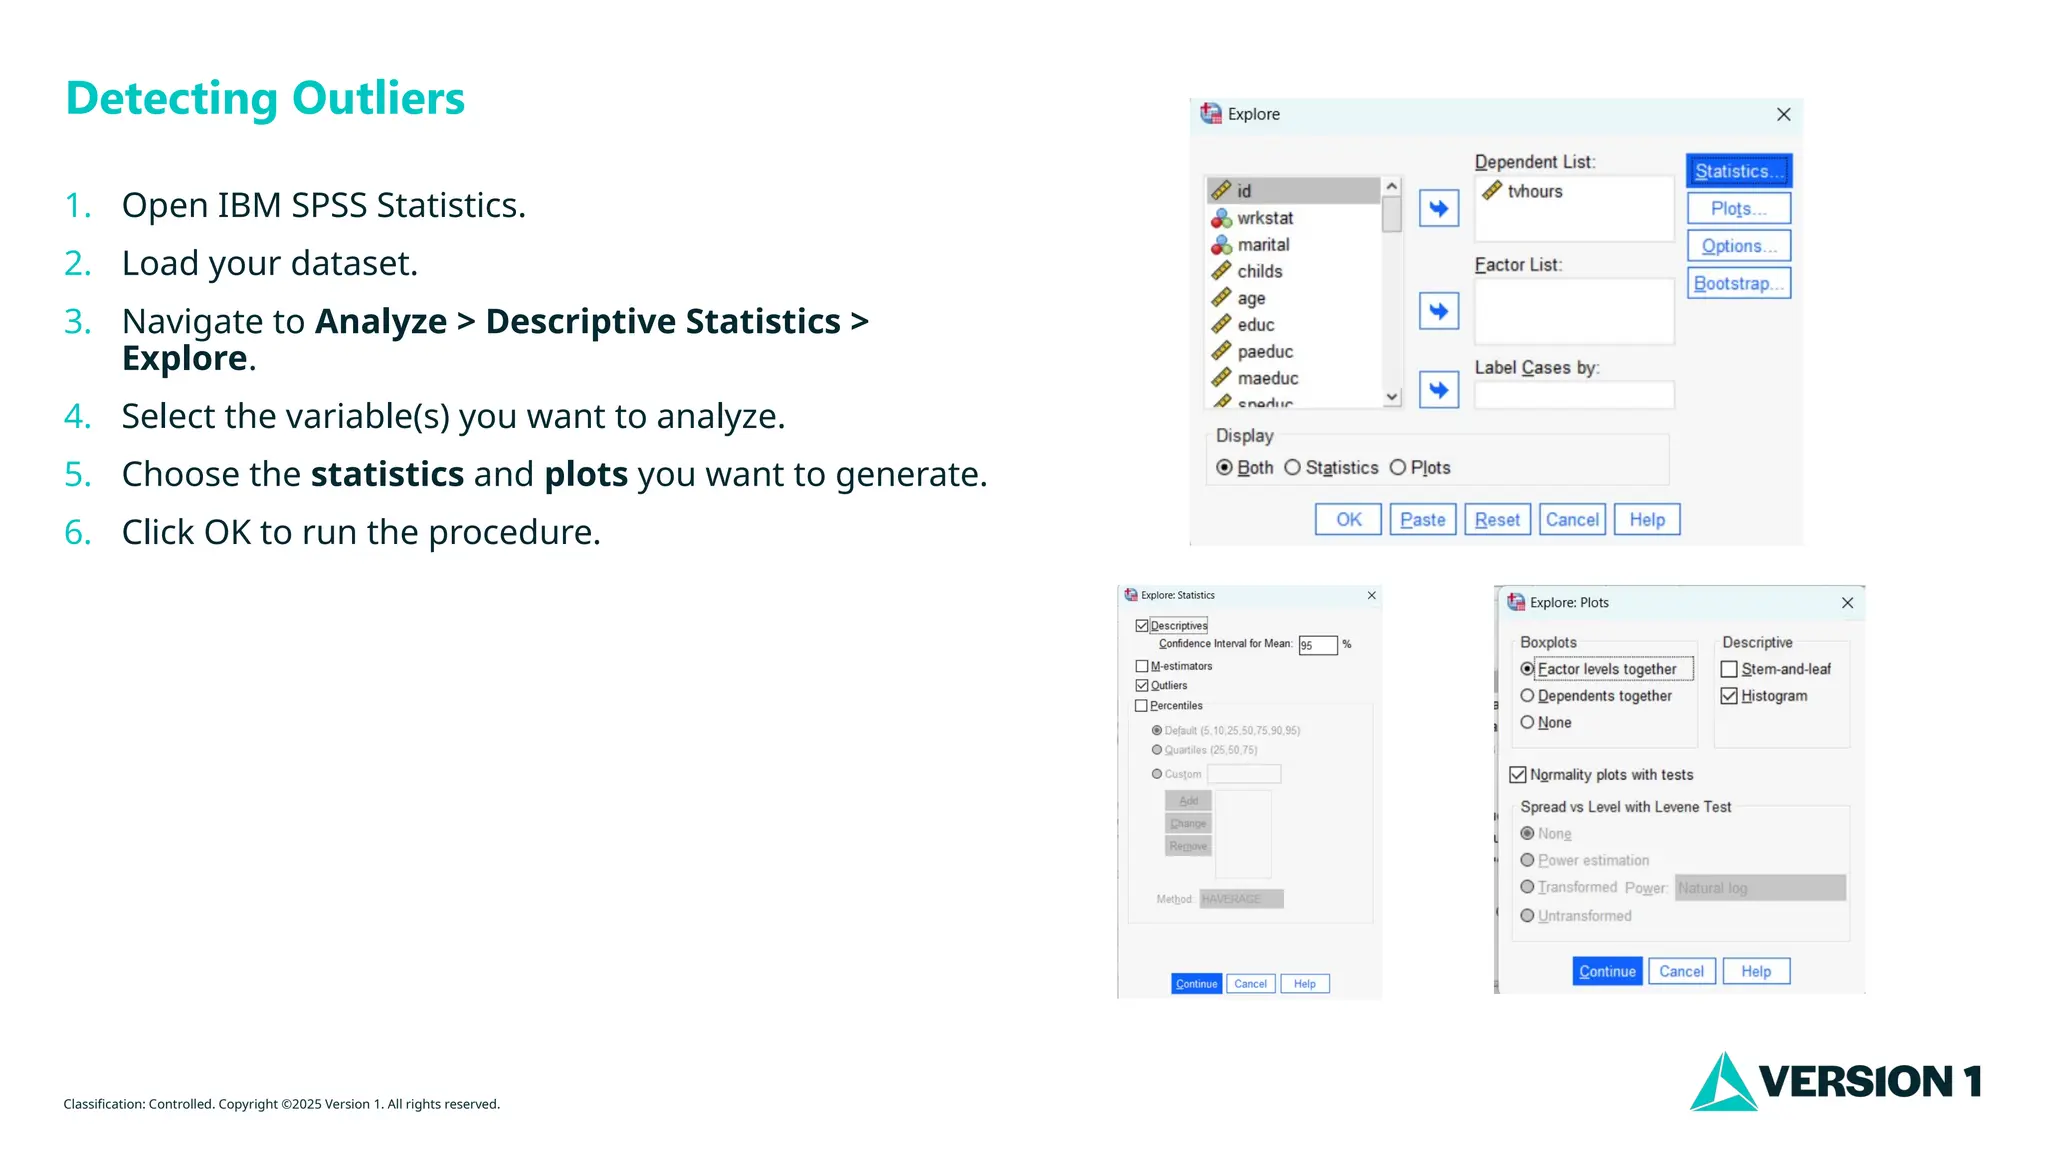
Detecting Outliers
1. Open IBM SPSS Statistics.
2. Load your dataset.
3. Navigate to Analyze > Descriptive Statistics >
Explore.
4. Select the variable(s) you want to analyze.
5. Choose the statistics and plots you want to generate.
6. Click OK to run the procedure.
- 3.
Classification: Controlled. Copyright©2025 Version 1. All rights reserved.
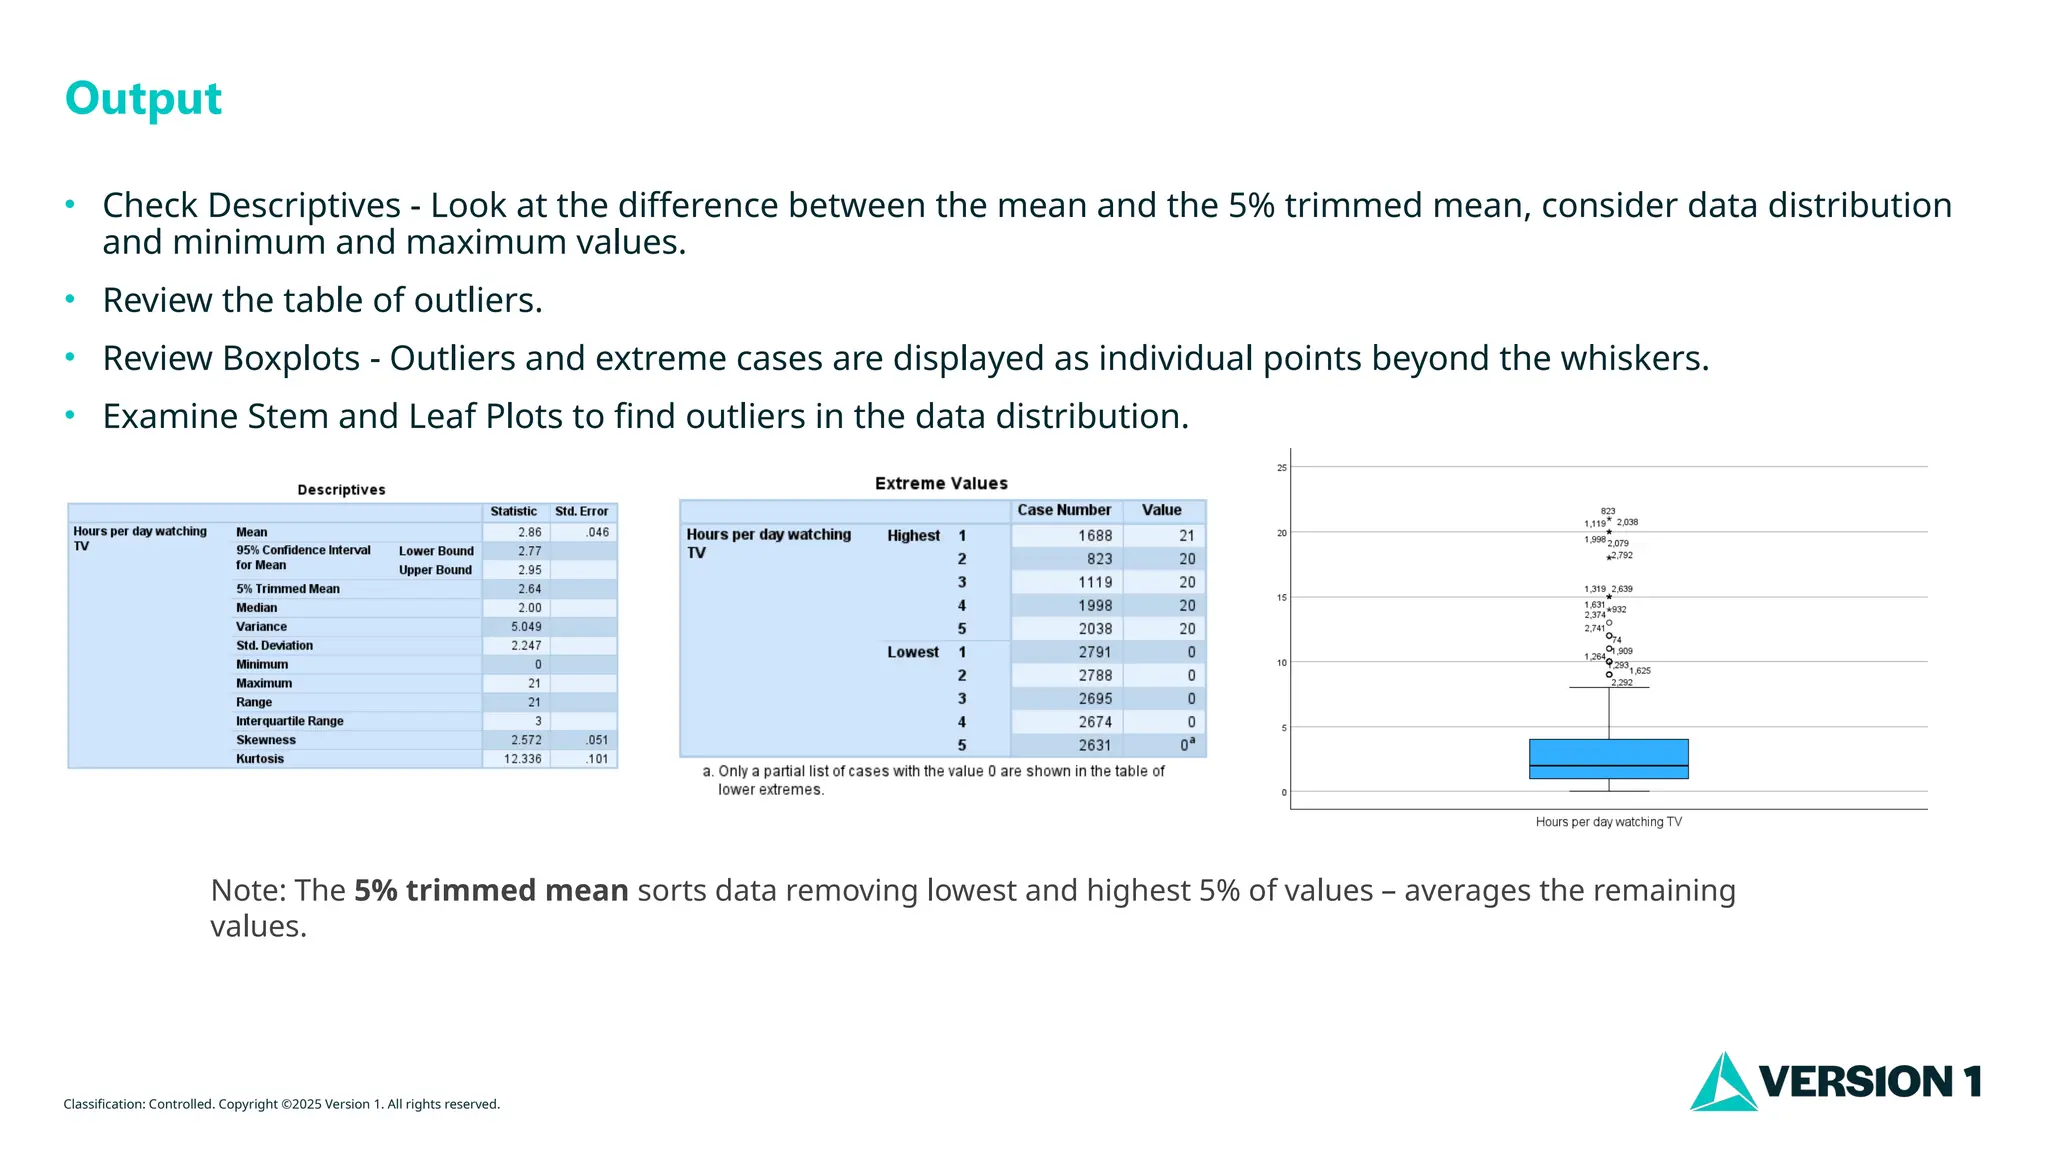
Output
• Check Descriptives - Look at the difference between the mean and the 5% trimmed mean, consider data distribution
and minimum and maximum values.
• Review the table of outliers.
• Review Boxplots - Outliers and extreme cases are displayed as individual points beyond the whiskers.
• Examine Stem and Leaf Plots to find outliers in the data distribution.
Note: The 5% trimmed mean sorts data removing lowest and highest 5% of values – averages the remaining
values.
- 4.
Classification: Controlled. Copyright©2025 Version 1. All rights reserved.
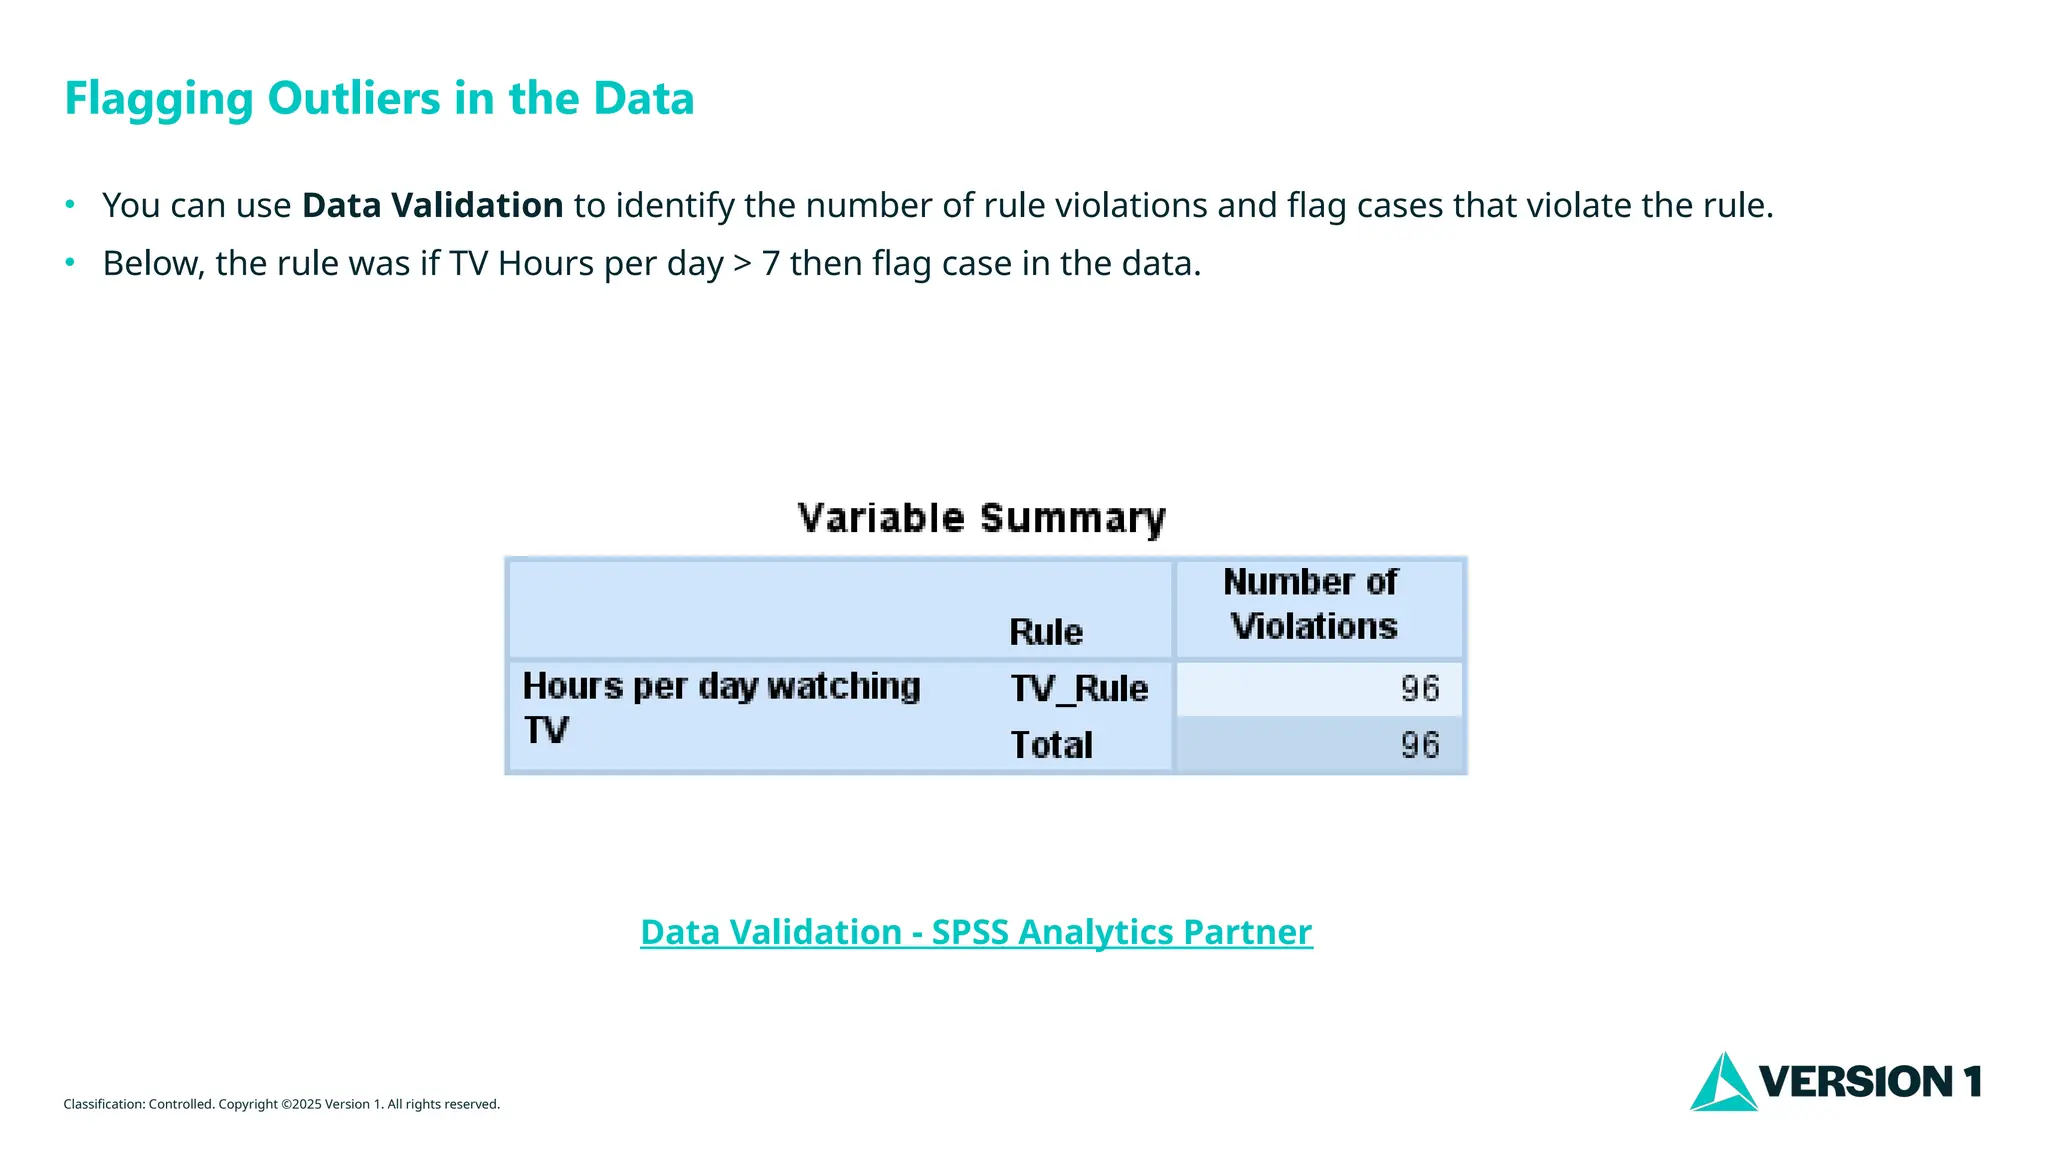
Flagging Outliers in the Data
• You can use Data Validation to identify the number of rule violations and flag cases that violate the rule.
• Below, the rule was if TV Hours per day > 7 then flag case in the data.
Data Validation - SPSS Analytics Partner
- 5.
Classification: Controlled. Copyright©2025 Version 1. All rights reserved.
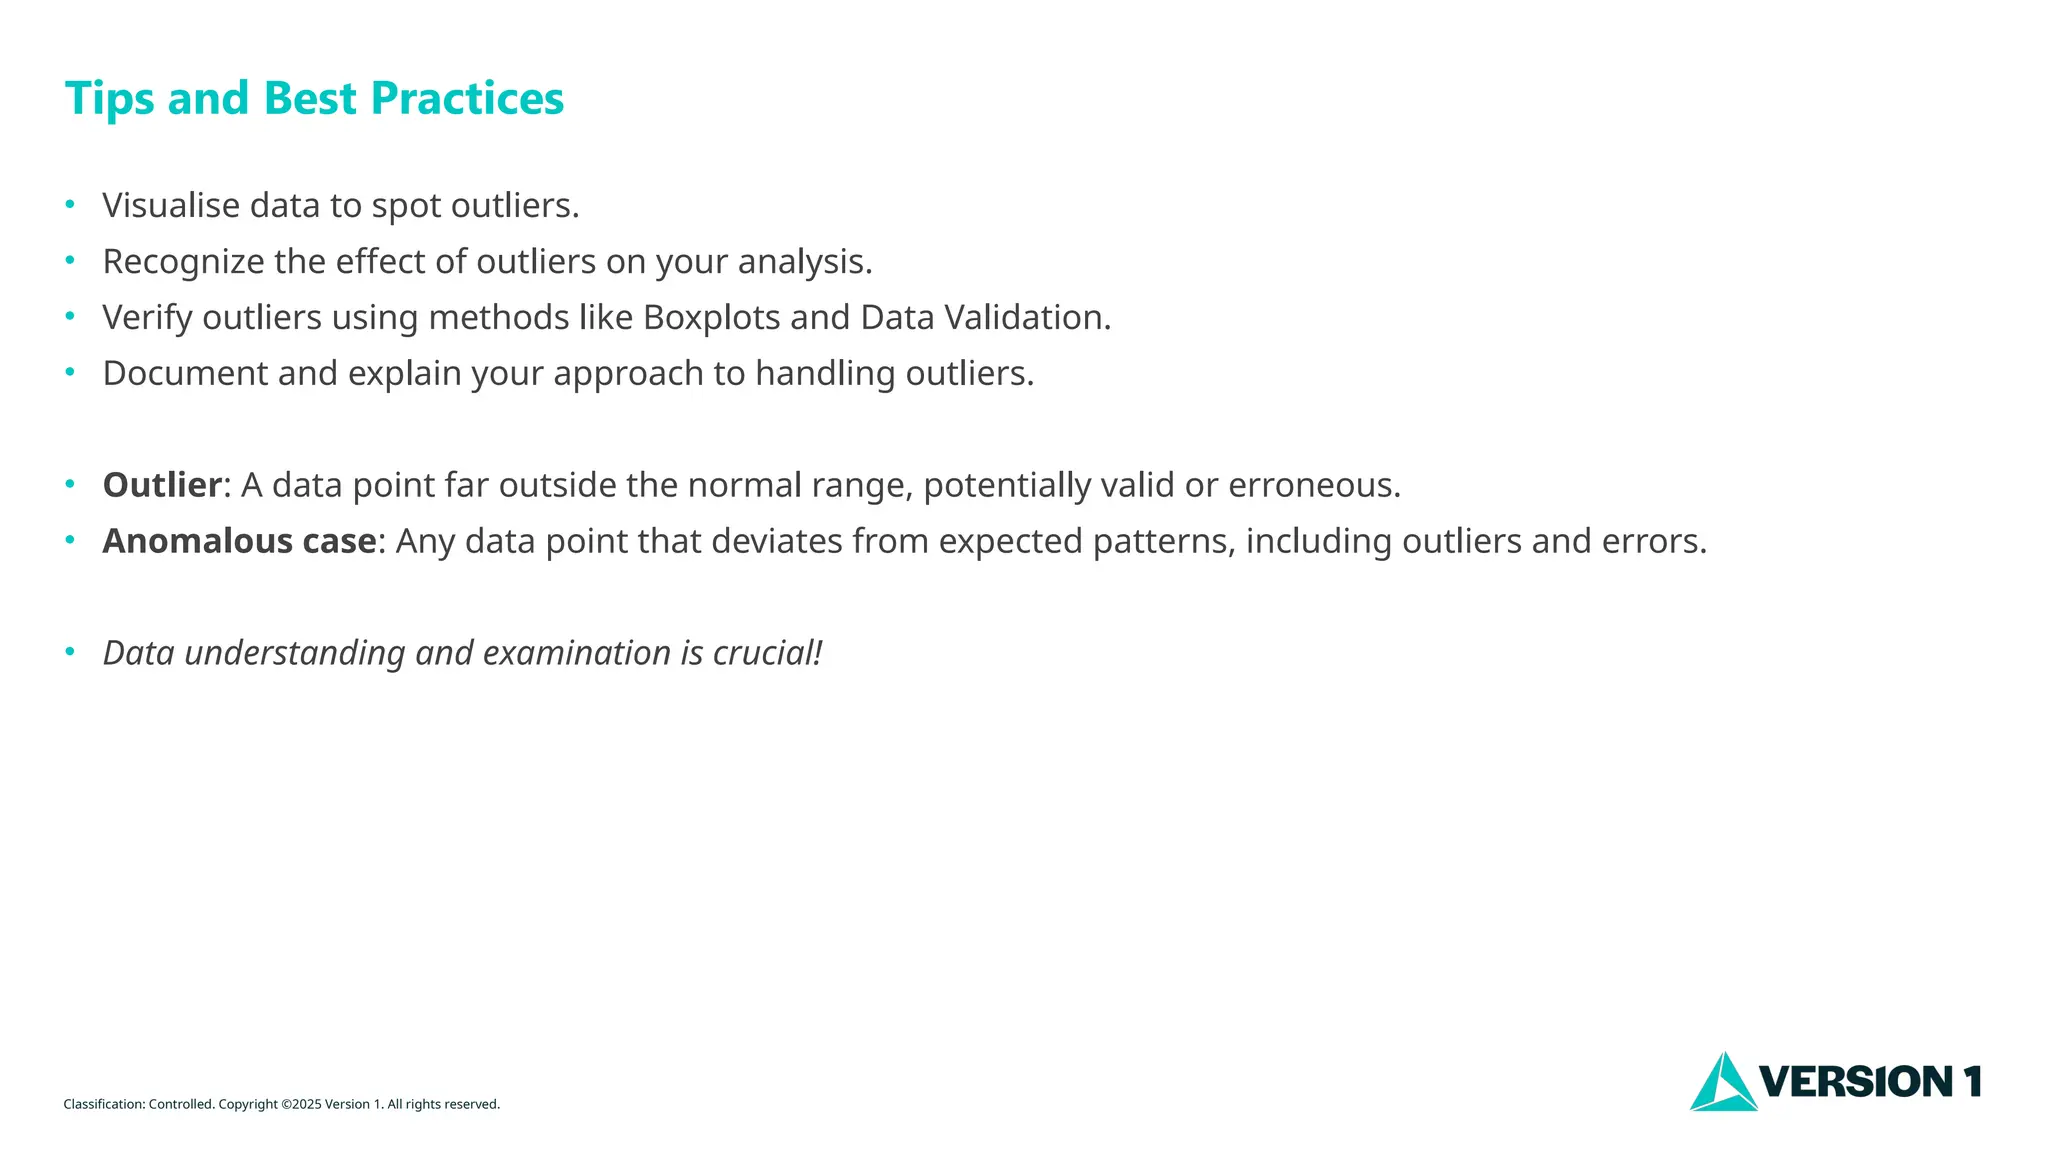
Tips and Best Practices
• Visualise data to spot outliers.
• Recognize the effect of outliers on your analysis.
• Verify outliers using methods like Boxplots and Data Validation.
• Document and explain your approach to handling outliers.
• Outlier: A data point far outside the normal range, potentially valid or erroneous.
• Anomalous case: Any data point that deviates from expected patterns, including outliers and errors.
• Data understanding and examination is crucial!
- 6.