More Related Content

PPTX

PDF
Exploring Variable Relationships with Scatter Diagram Analysis 
PDF
Ibm spss statistics 19 brief guide 
PDF

PPTX

PPT
Lobsters, Wine and Market Research 
PPTX
Quantitative Reasoning, Scatter Plots.pptx 
PPTX
Lean: Scatter Diagram Quality Tools Series Similar to Visualising Data with Scatterplots in IBM SPSS Statistics.pptx

PPTX

PPTX

PDF
How to plot a scatterplot 
PPTX
AV_BUS110_2B - Essentials of Modern Biz Stats 
PPTX

PDF
What's New in SPSS Statistics ? 
PPTX
scatter plots and visualization concept.pptx 
PDF

PDF

PPTX
2 Descriptive Statistics Psychology.pptx 
PPTX

PDF
Practical Business Statistics Sixth Edition Andrew Siegel 
PPTX

PPTX
More from Version 1 Analytics

PPTX
Curated Help for T-Tests in IBM SPSS Statistics 
PPTX
Replace Missing Values. in IBM SPSS Statistics 
PPTX
Aggregating Records in IBM SPSS Statistics 
PPTX
ChiSquare Procedure in IBM SPSS Statistics Version 31.pptx 
PPTX
Homogeneity of Variance Test Options IBM SPSS Statistics Version 31.pptx 
PPTX
Help for Correlations in IBM SPSS Statistics.pptx 
PPTX
Finding Your License Details in IBM SPSS Statistics Version 31.pptx 
PPTX
Customise Your Correlation Table in IBM SPSS Statistics.pptx 
PPTX
Coefficient of Variance in IBM SPSS Statistics Version 31.pptx 
PPTX
Change Common Properties in IBM SPSS Statistics Version 31.pptx 
PDF
Add Background Images to Charts in IBM SPSS Statistics Version 31.pdf 
PPTX
How to Create Groups from Numeric Variables with Visual Binning.pptx 
PPTX
How to Detect Outliers in IBM SPSS Statistics.pptx 
PPTX
Running Means Procedure in IBM SPSS Statistics 
PPTX
How to Import a CSV File into IBM SPSS Statistics.pptx 
PPTX
How to Import an Excel File into IBM SPSS Statistics.pptx 
PPTX
Auto Data Preparation in IBM SPSS Modeler.pptx 
PPTX
Clustered Bar Charts IBM SPSS Statistics.pptx 
PPTX
Row Panels for Bar Charts in IBM SPSS Statistics.pptx 
PPTX
Split into Files in IBM SPSS Statitistics.pptx Recently uploaded

PDF
Cloud-Based Underwriting Software for Insurance 
PPTX
SAP FICO Training Agenda for new learners 
PPTX
NSF Converter Software to Convert NSF to PST, EML, MSG 
PPTX
Python-Functions-A-Comprehensive-Overview.pptx 
PPTX
List on Python Programming Language.pptx 
PPTX
Road_Quality_Indicator using deeplearning algorithms and computer vision 
PDF
Kiến trúc hướng dịch vụ UET!!!!!!!!!!!!!!!!!!!!!!! 
PPTX
Custom chat gpt integration services.pptx 
PPTX
application security presentation 2 by harman 
PDF
DSD-INT 2025 Managing low flows in the International Meuse Basin with Nature-... 
PDF
Database Management Systems(DBMS):UNIT-I Introduction to Database(DBMS) BCA S... 
PDF
From Experiment to Enterprise: Scaling AI Coding Assistants Across Engineerin... 
PPTX
Modern P&C Insurance Software for Smarter, Faster Operations.pptx 
PDF
Jeremy Millul - An NYU Computer Science Graduate 
PPTX
SNG460-CNG489_Week6_3-7Nov25_Chp6-Part1.pptx 
PPTX
Code Assessment Tools .pptx 
PDF
Design and Analysis of Algorithms(DAA): Unit-II Asymptotic Notations and Basi... 
PPTX
SNG460-CNG489_Week8_17-21Nov25_Chp8-OdtuClass.pptx 
PDF
Constraints First - Why Our On-Prem Ticketing System Starts With Limits, Not ... 
PDF
How Modern Custom Software is Revolutionizing Mortgage Lending Processes -Ma... Visualising Data with Scatterplots in IBM SPSS Statistics.pptx
- 1.
- 2.
Classification: Controlled. Copyright©2025 Version 1. All rights reserved.
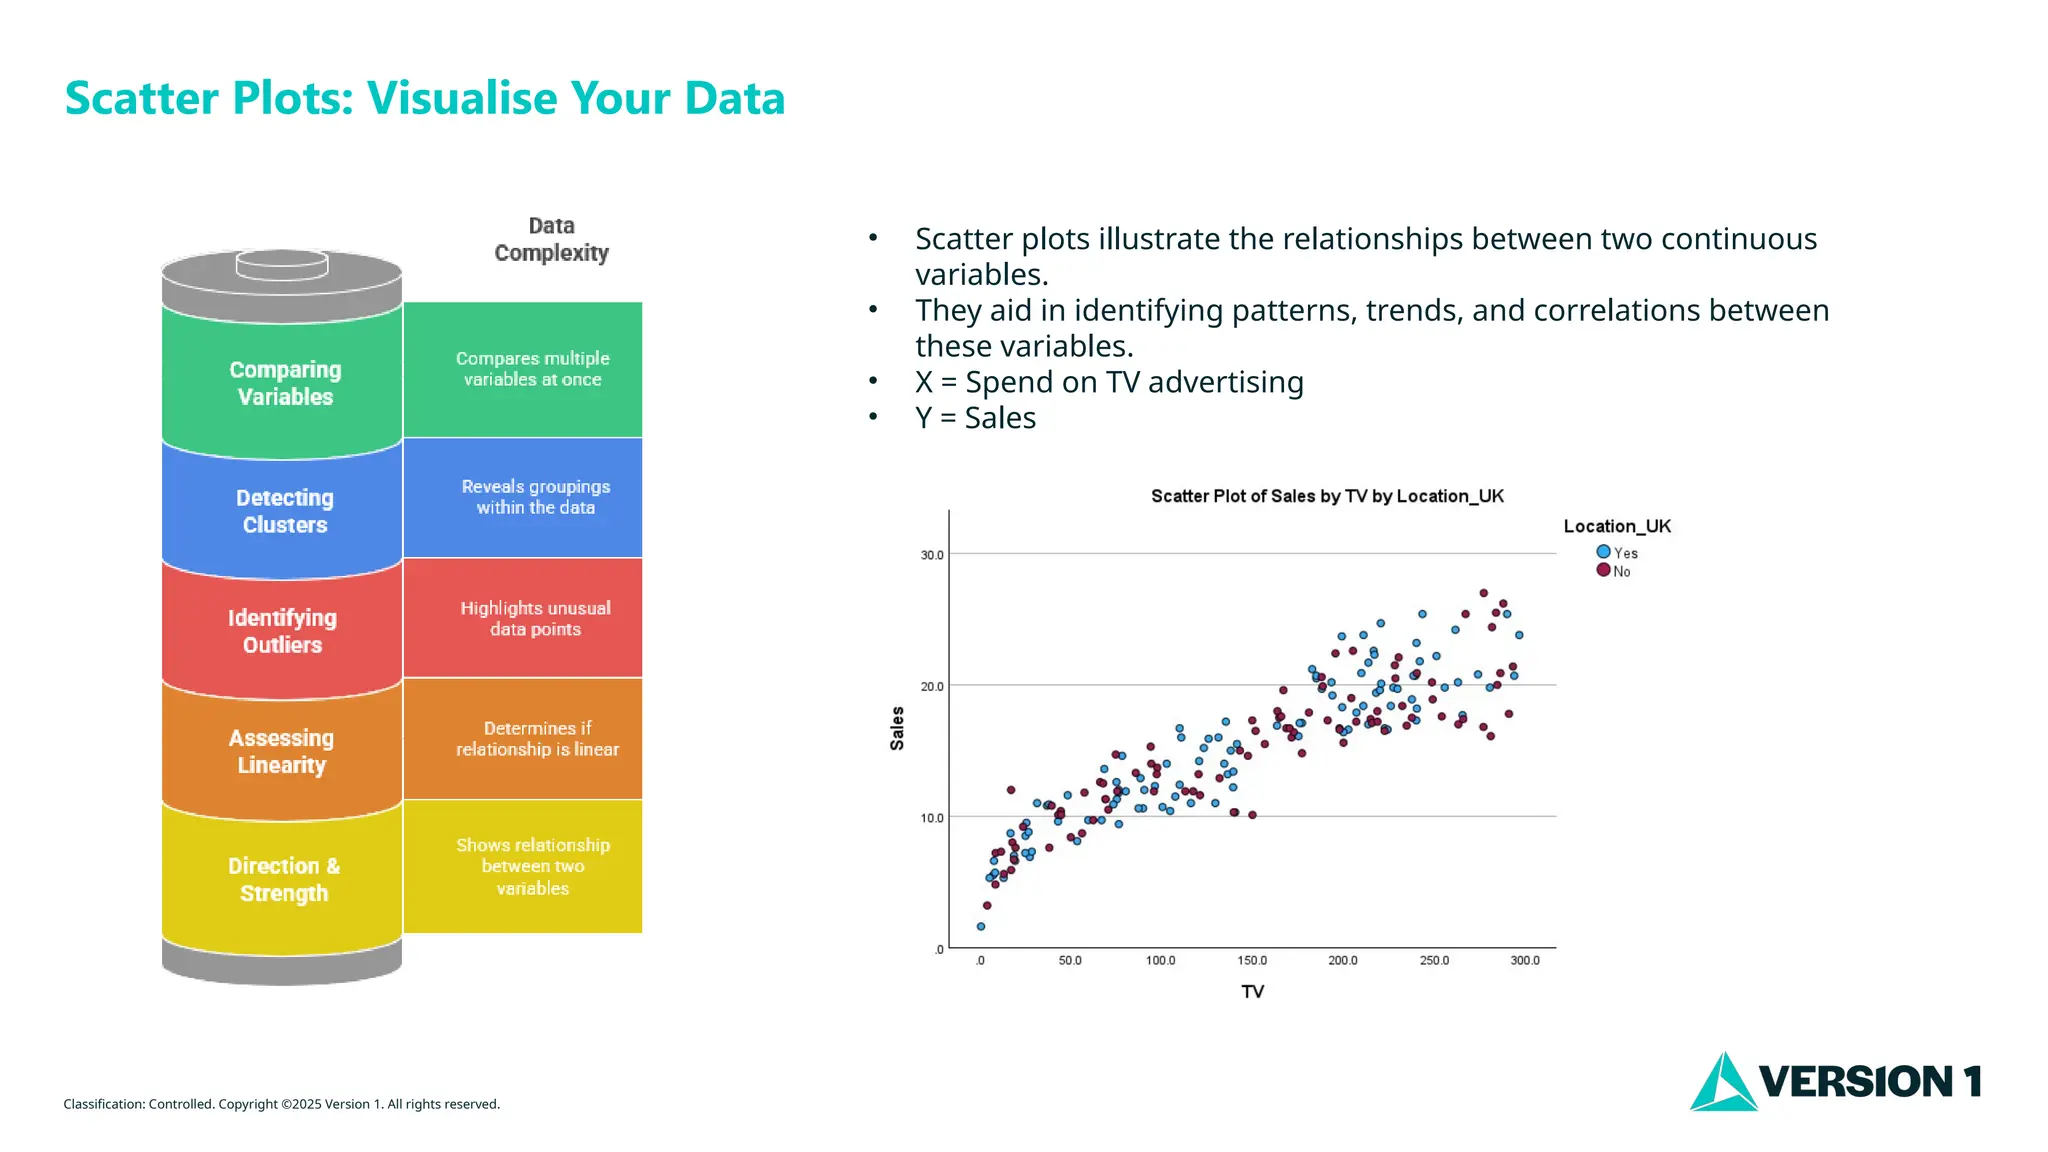
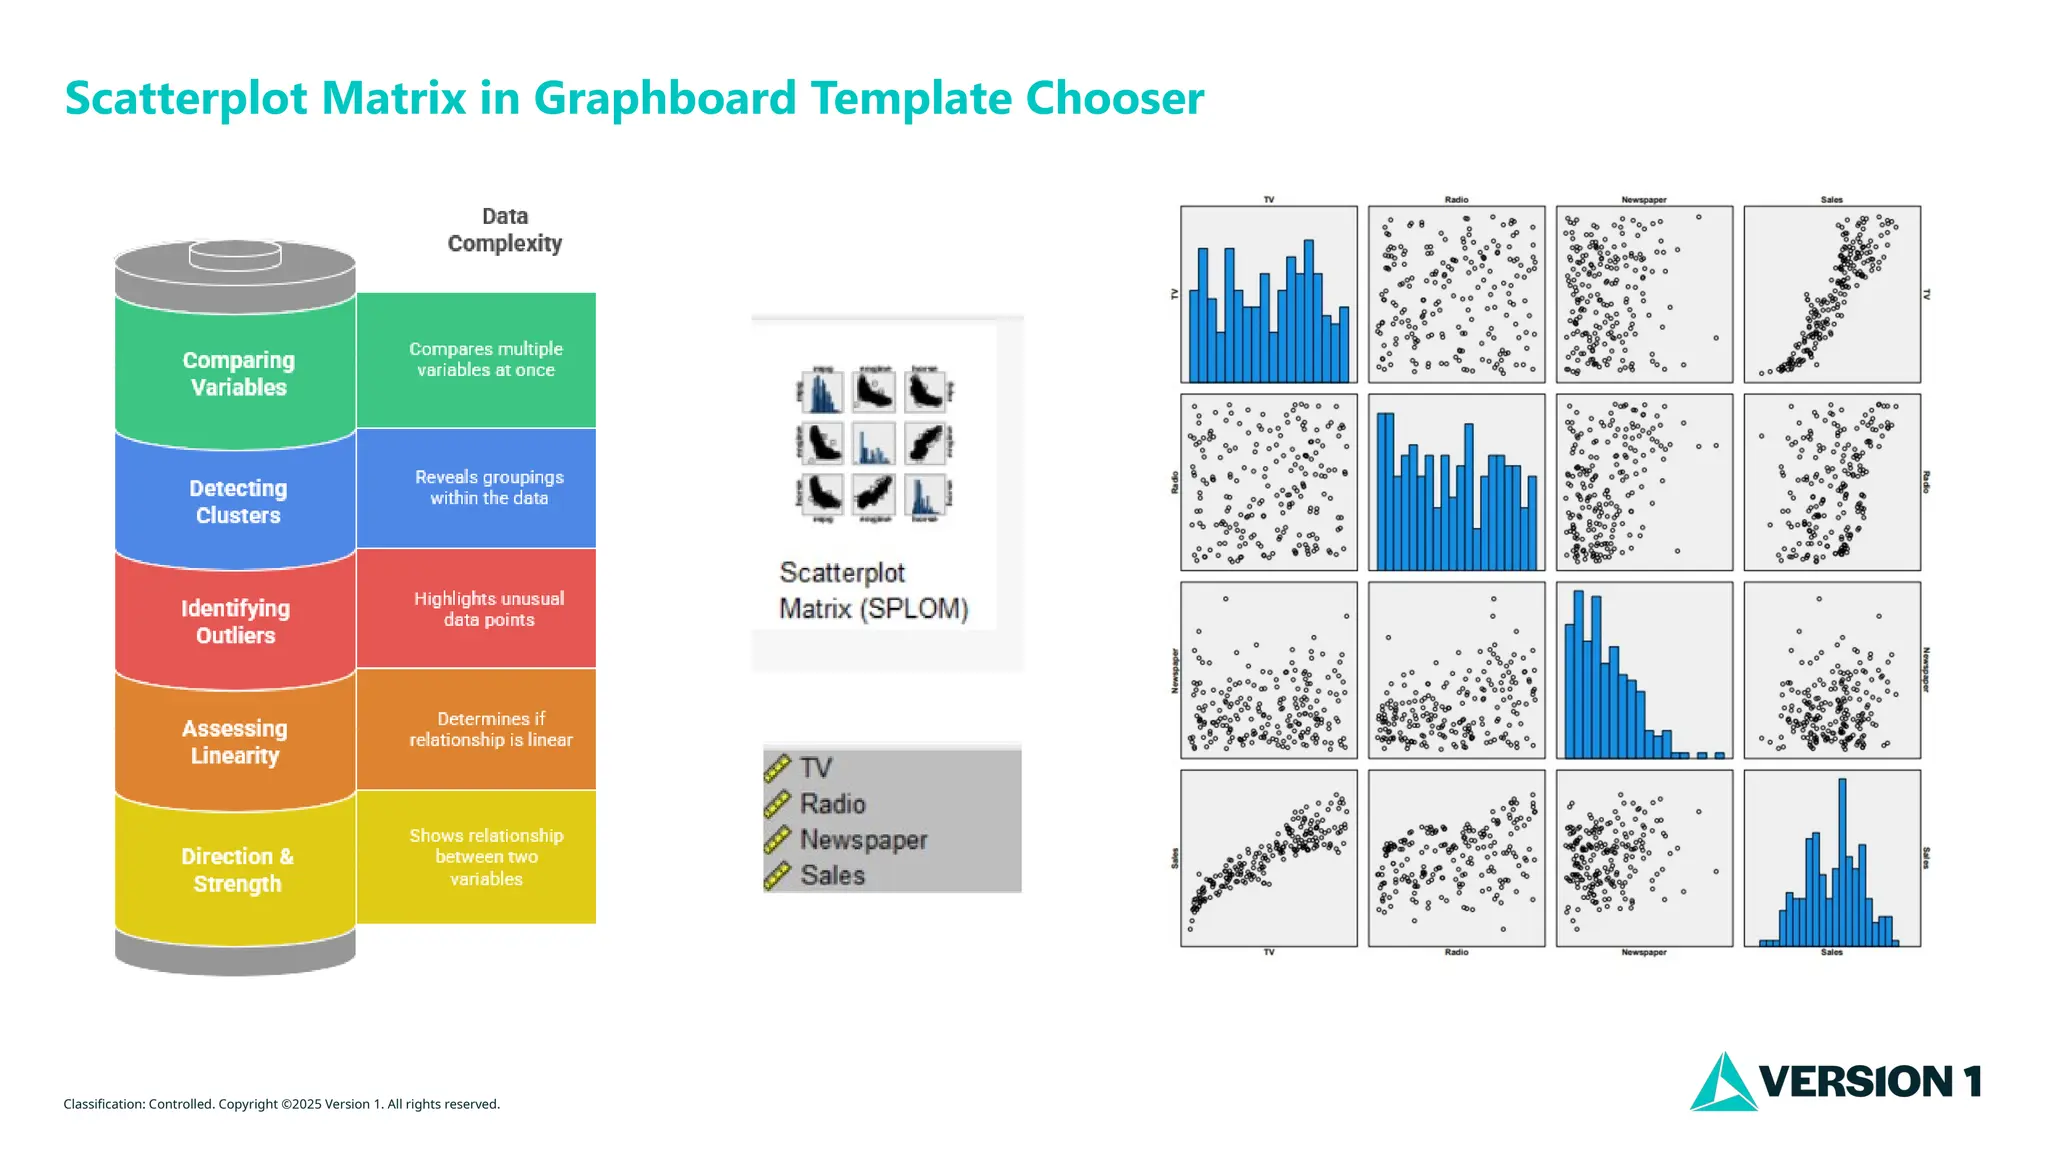
Scatter Plots: Visualise Your Data
• Scatter plots illustrate the relationships between two continuous
variables.
• They aid in identifying patterns, trends, and correlations between
these variables.
• X = Spend on TV advertising
• Y = Sales
- 3.
- 4.
- 5.
- 6.