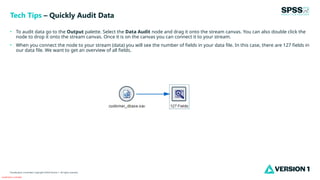
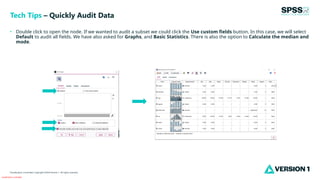
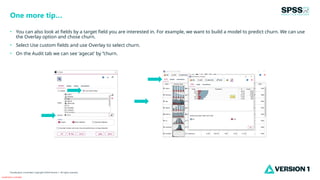
Classification: Controlled
Classification: Controlled. Copyright ©2024 Version 1. All rights reserved.
Quickly Audit Data
Tech Tips – IBM SPSS Modeler
Classification: Controlled
Classification: Controlled. Copyright ©2024 Version 1. All rights reserved.
• Here’s a quick tip to audit your data file in IBM SPSS Modeler.
• Users can obtain a quick audit and overview of a data file by using the Data Audit node. The Data Audit node is located on the
Output palette and provides visualizations of fields within the data file. The Data Audit also identifies outliers, extreme cases and
missing data.
Tech Tips – Quickly Audit Data
Classification: Controlled
Classification: Controlled. Copyright ©2024 Version 1. All rights reserved.
• To audit data go to the Output palette. Select the Data Audit node and drag it onto the stream canvas. You can also double click the
node to drop it onto the stream canvas. Once it is on the canvas you can connect it to your stream.
• When you connect the node to your stream (data) you will see the number of fields in your data file. In this case, there are 127 fields in
our data file. We want to get an overview of all fields.
Tech Tips – Quickly Audit Data
Classification: Controlled
Classification: Controlled. Copyright ©2024 Version 1. All rights reserved.
• Double click to open the node. If we wanted to audit a subset we could click the Use custom fields button. In this case, we will select
Default to audit all fields. We have also asked for Graphs, and Basic Statistics. There is also the option to Calculate the median and
mode.
Tech Tips – Quickly Audit Data
Classification: Controlled
Classification: Controlled. Copyright ©2024 Version 1. All rights reserved.
• On the Audit tab each field is listed with a thumbnail graph and statistics. Users can click on a thumbnail graph to see distributions or
histograms.
Tech Tips – Quickly Audit Data
Classification: Controlled
Classification: Controlled. Copyright ©2024 Version 1. All rights reserved.
• On the Quality tab, Field, Measurement, Outliers, Extremes and missing data are shown. Users can sort on % Complete to see
which fields have missing data. Users can click on the column top and use the arrow up or arrow down option to sort the fields on
missing.
• The Data Audit is a fast overview of your data available in just a few clicks.
Tech Tips – Quickly Audit Data
Classification: Controlled
Classification: Controlled. Copyright ©2024 Version 1. All rights reserved.
• You can also look at fields by a target field you are interested in. For example, we want to build a model to predict churn. We can use
the Overlay option and chose churn.
• Select Use custom fields and use Overlay to select churn.
• On the Audit tab we can see ‘agecat’ by ‘’churn.
One more tip…
Classification: Controlled
Classification: Controlled. Copyright ©2024 Version 1. All rights reserved.
For more information
please visit spssanalyticspartner.com
Thank You

Quickly Audit Data in IBM SPSS Modeler.pptx

  • 1.
    Classification: Controlled Classification: Controlled.Copyright ©2024 Version 1. All rights reserved. Quickly Audit Data Tech Tips – IBM SPSS Modeler
  • 2.
    Classification: Controlled Classification: Controlled.Copyright ©2024 Version 1. All rights reserved. • Here’s a quick tip to audit your data file in IBM SPSS Modeler. • Users can obtain a quick audit and overview of a data file by using the Data Audit node. The Data Audit node is located on the Output palette and provides visualizations of fields within the data file. The Data Audit also identifies outliers, extreme cases and missing data. Tech Tips – Quickly Audit Data
  • 3.
    Classification: Controlled Classification: Controlled.Copyright ©2024 Version 1. All rights reserved. • To audit data go to the Output palette. Select the Data Audit node and drag it onto the stream canvas. You can also double click the node to drop it onto the stream canvas. Once it is on the canvas you can connect it to your stream. • When you connect the node to your stream (data) you will see the number of fields in your data file. In this case, there are 127 fields in our data file. We want to get an overview of all fields. Tech Tips – Quickly Audit Data
  • 4.
    Classification: Controlled Classification: Controlled.Copyright ©2024 Version 1. All rights reserved. • Double click to open the node. If we wanted to audit a subset we could click the Use custom fields button. In this case, we will select Default to audit all fields. We have also asked for Graphs, and Basic Statistics. There is also the option to Calculate the median and mode. Tech Tips – Quickly Audit Data
  • 5.
    Classification: Controlled Classification: Controlled.Copyright ©2024 Version 1. All rights reserved. • On the Audit tab each field is listed with a thumbnail graph and statistics. Users can click on a thumbnail graph to see distributions or histograms. Tech Tips – Quickly Audit Data
  • 6.
    Classification: Controlled Classification: Controlled.Copyright ©2024 Version 1. All rights reserved. • On the Quality tab, Field, Measurement, Outliers, Extremes and missing data are shown. Users can sort on % Complete to see which fields have missing data. Users can click on the column top and use the arrow up or arrow down option to sort the fields on missing. • The Data Audit is a fast overview of your data available in just a few clicks. Tech Tips – Quickly Audit Data
  • 7.
    Classification: Controlled Classification: Controlled.Copyright ©2024 Version 1. All rights reserved. • You can also look at fields by a target field you are interested in. For example, we want to build a model to predict churn. We can use the Overlay option and chose churn. • Select Use custom fields and use Overlay to select churn. • On the Audit tab we can see ‘agecat’ by ‘’churn. One more tip…
  • 8.
    Classification: Controlled Classification: Controlled.Copyright ©2024 Version 1. All rights reserved. For more information please visit spssanalyticspartner.com Thank You