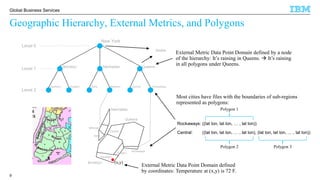
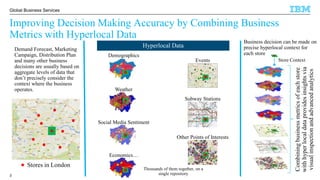
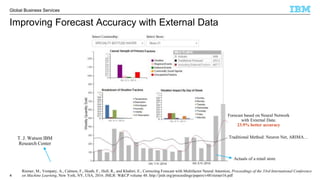
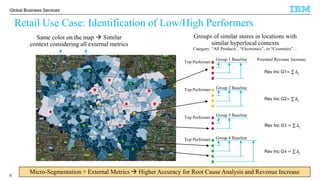
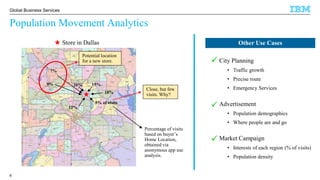
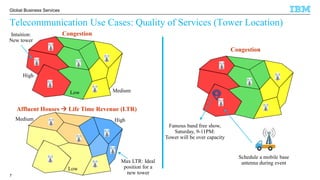
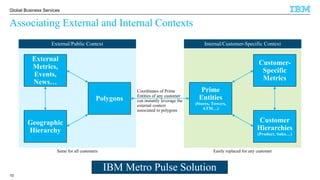
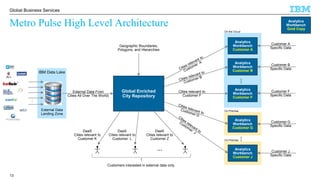
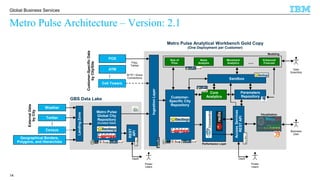
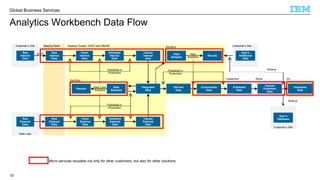
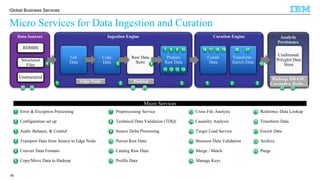
Using Hadoop for Cognitive Analytics
Pedro Desouza, Ph.D.
Associate Partner
Big Data & Analytics Center of Competence
IBM Global Business Services
June 29, 2016
© 2016 IBM Corporation
Global Business Services
Outline
2
P Metro Pulse: Enhancing Decision Making Processes With Hyperlocal Data
DashboardsP
Use Cases In Multiple IndustriesP
Geographic Hierarchies, External Metrics, and Mapping RepresentationP
Integration Of External and Customer-Specific MetricsP
Solution ArchitectureP
Technological ComponentsP
Micro Services for Data Ingestion and CurationP
© 2016 IBM Corporation
Global Business Services
Improving Decision Making Accuracy by Combining Business
Metrics with Hyperlocal Data
3
Weather
Social Media Sentiment
Economics…
Events
Thousands of them together, on a
single repository
Other Points of Interests
Subway Stations
Demographics
Hyperlocal Data
Business decision can be made on
precise hyperlocal context for
each store
Store Context
Combiningbusinessmetricsofeachstore
withhyperlocaldataprovidesinsightsvia
visualinspectionandadvancedanalytics
Demand Forecast, Marketing
Campaign, Distribution Plan
and many other business
decisions are usually based on
aggregate levels of data that
don’t precisely consider the
context where the business
operates.
Stores in London
© 2016 IBM Corporation
Global Business Services
Improving Forecast Accuracy with External Data
4
Traditional Method: Neuron Net, ARIMA…
Forecast based on Neural Network
with External Data:
23.9% better accuracy
Actuals of a retail store
Riemer, M., Vempaty, A., Calmon, F., Heath, F., Hull, R., and Khabiri, E., Correcting Forecast with Multifactor Neural Attention, Proceedings of the 33rd International Conference
on Machine Learning, New York, NY, USA, 2016. JMLR: W&CP volume 48. http://jmlr.org/proceedings/papers/v48/riemer16.pdf
T. J. Watson IBM
Research Center
© 2016 IBM Corporation
Global Business Services
Same color on the map  Similar
context considering all external metrics
5
Retail Use Case: Identification of Low/High Performers
Groups of similar stores in locations with
similar hyperlocal contexts
Category: “All Products’, “Electronics”, or “Cosmetics”…
Top Performer
Top Performer
Top Performer
Top Performer
Group 1 Baseline
Group 2 Baseline
Group 3 Baseline
Group 4 Baseline
Potential Revenue Increase:
Rev Inc G1= ∆𝑖
Rev Inc G2= ∆𝑖
Rev Inc G3 = ∆𝑖
Rev Inc G4 = ∆𝑖
Micro-Segmentation + External Metrics  Higher Accuracy for Root Cause Analysis and Revenue Increase
© 2016 IBM Corporation
Global Business Services
Population Movement Analytics
6
Store in Dallas
Close, but few
visits. Why?
15%20%
7%
9%
12%
5% of visits
Percentage of visits
based on buyer’s
Home Location,
obtained via
anonymous app use
analysis.
18%
Potential location
for a new store.
Advertisement
• Population demographics
• Where people are and go
P
Market Campaign
• Interests of each region (% of visits)
• Population density
P
Other Use Cases
City Planning
• Traffic growth
• Precise route
• Emergency Services
P
© 2016 IBM Corporation
Global Business Services
Telecommunication Use Cases: Quality of Services (Tower Location)
7
Affluent Houses  Life Time Revenue (LTR)
High
Low
Medium
Congestion
High
Low Medium
Intuition:
New tower
Max LTR: Ideal
position for a
new tower
Congestion
Famous band free show,
Saturday, 9-11PM:
Tower will be over capacity
Schedule a mobile base
antenna during event
© 2016 IBM Corporation
Global Business Services
Use cases are countless…
Banking and Finance
1. Branch Segmentation / New Market Opportunities
2. Cash Demand Forecasting
3. Promotion Customization
4. Staffing Mix / Specialty Account Services
5. Customer Churn
6. ATM Kiosk-to-Location Ratio Optimization
Retail
1. Uncaptured Opportunity
2. Assortment Optimization
3. Out of Stock
4. Demand Forecasting
5. Dynamic Pricing
6. Promotion Effectiveness
Insurance
1. Risk Management and Pricing Optimization
2. Portfolio Suitability
3. Demand Forecasting
4. Staffing Mix / Specialty Account Services
5. Damage Forecasting
City Analytics Industry Use Cases
Consumer Packaged Goods
1. Product mix
2. Out of Stock
3. Visibility
4. Expansion Opportunity
5. Customer Churn
6. Promotion Effectiveness
Travel and Transportation
1. Booking Traffic Forecasting Based on POIs
2. Service Relative Pricing Model
3. Promotion Customization
4. Amenity Mix
5. Cancellation Forecasting
Telecommunications
1. Customer Churn
2. Package/Service Offering Optimization
3. Coverage Optimization
4. New Product Demand
5. Device Repair Services
6. Service Outage Forecasting
8
© 2016 IBM Corporation
Global Business Services
Geographic Hierarchy, External Metrics, and Polygons
9
Rockaways
Manhattan
Soho
Midtown
Brooklyn
Queens
Southern
Eastern
Central
External Metric Data Point Domain defined
by coordinates: Temperature at (x,y) is 72 F.
(x,y)
External Metric Data Point Domain defined by a node
of the hierarchy: It’s raining in Queens.  It’s raining
in all polygons under Queens.
Level 0
Level 1
Level 2
New York
ManhattanBrooklyn Queens
Soho Midtown RockawaysCentralSouthern Eastern
Nodes
((lat lon, lat lon, … , lat lon))
((lat lon, lat lon, … , lat lon), (lat lon, lat lon, … , lat lon))
Polygon 1
Polygon 2 Polygon 3
Rockaways:
Central:
Most cities have files with the boundaries of sub-regions
represented as polygons:
© 2016 IBM Corporation
Global Business Services
Associating External and Internal Contexts
10
External
Metrics,
Events,
News…
Geographic
Hierarchy
Polygons
Prime
Entities
(Stores, Towers,
ATM…)
Customer-
Specific
Metrics
Customer
Hierarchies
(Product, Sales…)
External/Public Context Internal/Customer-Specific Context
Coordinates of Prime
Entities of any customer
can instantly leverage the
external context
associated to polygons
Easily replaced for any customerSame for all customers
IBM Metro Pulse Solution
© 2016 IBM Corporation
Global Business Services
Fundamental Polygon Functions
11
2) polygons_intersection(“Polygon P”, “Polygon Q”)
1polygons_intersection(“Pol 1”, “Pol 2”)
0polygons_intersection(“Pol 1”, “Pol 3”)
Pol 1
Pol 2
Pol 3
Data Quality: No two polygons under the same
hierarchy can intersect on any point other than
on the edges or vertices.
1) point_in_polygon(“Point X”, “Polygon P”)
Pol 1
Pol 2
Pol 3
Pol 4
A
B
C
1point_in_polygon(“A”, “Pol 2”)
0point_in_polygon(“B”, “Pol 3”)
Data Quality: All Prime Entities and Points of
Interest must belong to one and only one
polygon in each geographic hierarchy.
© 2016 IBM Corporation
Global Business Services
External Data Normalization Via a Reference Polygon
12
Reference Polygon
Pol 1
Pol 2
Pol 3
Pol 4
Metric 1: Original
Pol 1
Pol 2
Pol 3
Pol 4
“Metric 1” values are based on a set
of polygons that don’t match the
reference polygon.
Pol 1
Pol 2
Pol 3
Pol 4
Metric 1: Normalized
Different types of metrics (e.g., count,
temperature) require different types
of aggregation methods.
© 2016 IBM Corporation
Global Business Services
External Data
Landing Zone
IBM Data Lake
…
Metro Pulse High Level Architecture
13
Global Enriched
City Repository
External Data From
Cities All Over The World)
Geographic Boundaries,
Polygons, and Hierarchies
Analytics
Workbench
Customer G
Analytics
Workbench
Customer J
...
Customer G
Specific Data
Customer J
Specific Data
On Premise
On Premise
DaaS
Cities relevant to
Customer Z
DaaS
Cities relevant to
Customer L
DaaS
Cities relevant to
Customer K
Customers interested in external data only.
...
Analytics
Workbench
Customer A
Analytics
Workbench
Customer B
Analytics
Workbench
Customer F
...
Cities relevant to
Customer F
Customer A
Specific Data
Customer B
Specific Data
Customer F
Specific Data
On the Cloud
Analytics
Workbench
Gold Copy
© 2016 IBM Corporation
Global Business Services
Weather
GBS Data Lake
ExternalData
byCity
Twitter
Census
...
Geographical Borders,
Polygons, and Hierarchies
Metro Pulse
Global City
Repository
(Curated Data)
REST
API
Power
Users
LandingZone
DaaS
Metro Pulse Analytical Workbench Gold Copy
(One Deployment per Customer)
POS
ATM
Cell Towers
...
Files,
Tables
SFTP / Direct
Connections
IngestionLayer
Customer-SpecificData
byCity/Site
Metro Pulse Architecture – Version: 2.1
Performance Layer
14
Data
Scientists
Size of
Prize
Movement
Analytics
News
Analysis ...
Modeling
Enhanced
Forecast
Customer-
Specific City
Repository
Core
Analytics
Parameters
Repository
Sandbox
DaaS
Visualization
Business
User
Power
Users
AccessServices
RESTAPI
© 2016 IBM Corporation
Global Business Services
D3…
Data Lake
Analytics Workbench Data Flow
15
Raw
Internal
Data
Raw
Internal
Data
Clean
Internal
Data
SFTP
Validated
Internal
Data
Tabular
Internal
Data
Derived
Data
Consumable
Data
Visualized
Data
Raw
External
Data
Raw
External
Data
Clean
External
Data
Validated
External
Data
Tabular
External
Data
Published
Data
Cached
Published
Data
Data
Samples
Results
New Core
Analytics
Sandbox
Published in
Production
Published in
Production
Data
Samples
Results
New
Analytics
Sandbox
Published in
Production
Hadoop Cluster: HDFS and HBASEStaging NodeCustomer’s Site
Cassandra Redis
User’s
Additional
Data
Customer’s Site
User’s
Database
Customer’s Site
Spark
Spark
Integrated
Data
Node.js
Node.js
Micro services reusable not only for other customers, but also for other solutions
© 2016 IBM Corporation
Global Business Services
Micro Services for Data Ingestion and Curation
16
Data Sources Ingestion Engine
RDMBS
Structured
Files
Unstructured
Copy
Data
HadoopEdge Node
Analytic
Persistence
Curation Engine
Hadoop, HBASE.
Cassandra, Redis…
Get
Data
Raw Data
Store
Prepare
Raw Data
Curate
Data
Transform /
Enrich Data
Conformed/
Polyglot Data
Store
23
1 2 3
4 5 6
7 8 9 10
11 12 13 14
15
16 17 18 19 20 21
22 2322 2322
1 2 3
19 Reference Data Lookup
20 Transform Data
21 Enrich Data
22 Archive
23 Purge
1 Error & Exception Processing
2 Configuration set up
3 Audit, Balance, & Control
4 Transport Data from Source to Edge Node
5 Convert Data Formats
6 Copy/Move Data to Hadoop
7 Preprocessing Service
8 Technical Data Validation (TDQ)
9 Source Delta Processing
10 Persist Raw Data
11 Catalog Raw Data
12 Profile Data
13 Cross File Analysis
14 Causality Analysis
15 Target Load Service
16 Business Data Validation
17 Merge / Match
18 Manage Keys
Micro Services
© 2016 IBM Corporation
Global Business Services
Loading Geographic Hierarchy to HBASE
Table L0
Row Desc …
London London is… Great Britain…
Paris Paris is… Continental Europe…
Table L1
Row Desc History…
London:Central … ……
London:North … ……
HistoryName
London
Paris
Central
North
Name
…
Paris:Central … ……Central
…
…
Table L2
Row Desc History…
London:Central:Kensington … ……
London:Central:Buckingham … ……
Kensington
Buckingham
Name
…
Table L3
Row Desc History…
London:Central:Kensington:Notting Barns … ……
… … ……
Notting Barns
…
Name
…
P1 P2 P3 PN…
P1 P2 P3 PN…
P1 P2 P3 PN…
P1 P2 P3 PN…
Column Family: Data Column Family: Polygons
50484 51673 54735 53896
75736 78493 78303 79659
50484 51673 54735
50484 51673
50484
© 2016 IBM Corporation
Global Business Services
Metro Pulse Analytical
Workbench Edge Node
Flume Agent: Tweets
Flume Agent: Weather
Flume Agent: News
Hadoop Data Nodes: HDFS
Tweets
Weather
News
...
Metro Pulse Analytical
Workbench Edge Node
Flume Agent: Tweets
Flume Agent: Weather
Flume Agent: News
Hadoop Data Nodes: HDFS
Tweets
Weather
News
...
Metro Pulse Analytical
Workbench Edge Node
Flume Agent: Tweets
Flume Agent: Weather
Flume Agent: News
Hadoop Data Nodes: HDFS
Tweets
Weather
News
...
Easy to broadcast same data to multiple
customers. Easy to add new customers.
Metro Pulse Analytical
Workbench Edge Node
Flume Agent: Tweets
Flume Agent: Weather
Flume Agent: News
Hadoop Data Nodes: HDFS
Tweets
Weather
News
...
Ingesting External Data via Flume
18
Flume Agent: Tweets
Flume Agent: Weather
Flume Agent: News
...Metro Pulse Global Repository Flume Server
Global City
Repository
Tweets
Weather
News
Internet
Agents can be optimally configured according
to the data sources characteristics
Each agent writes to a different HDFS folders:
no conflict, good for parallel execution
Each source is captured as
a HBASE column family
One data source per agent: easy
to add new sources
© 2016 IBM Corporation
Global Business Services
Performance Layer
19
- V_Transaction
- V_Level_Entity
- V_Polygon_Entity
- V_Size_of_Prize
...
Cache Manager
Get_View(“XYZ”)
- V_Level_Entity
- V_Size_of_Prize
API
- If “XYZ” in Redis, return “XYZ”
- Else:
- Get “XYZ” from Cassandra
- Return “XYZ” to the API
- Load “XYZ” to Redis
“XYZ”
Eviction Policy: Less
Recently Used
Sub-second latency and high throughput Dashboards small files
High throughput for large files  DaaS
© 2016 IBM Corporation
Global Business Services
Sample of Visualization Objects on D3.js
20
© 2016 IBM Corporation
Global Business Services
21

Using Hadoop for Cognitive Analytics

  • 1.
    Using Hadoop forCognitive Analytics Pedro Desouza, Ph.D. Associate Partner Big Data & Analytics Center of Competence IBM Global Business Services June 29, 2016
  • 2.
    © 2016 IBMCorporation Global Business Services Outline 2 P Metro Pulse: Enhancing Decision Making Processes With Hyperlocal Data DashboardsP Use Cases In Multiple IndustriesP Geographic Hierarchies, External Metrics, and Mapping RepresentationP Integration Of External and Customer-Specific MetricsP Solution ArchitectureP Technological ComponentsP Micro Services for Data Ingestion and CurationP
  • 3.
    © 2016 IBMCorporation Global Business Services Improving Decision Making Accuracy by Combining Business Metrics with Hyperlocal Data 3 Weather Social Media Sentiment Economics… Events Thousands of them together, on a single repository Other Points of Interests Subway Stations Demographics Hyperlocal Data Business decision can be made on precise hyperlocal context for each store Store Context Combiningbusinessmetricsofeachstore withhyperlocaldataprovidesinsightsvia visualinspectionandadvancedanalytics Demand Forecast, Marketing Campaign, Distribution Plan and many other business decisions are usually based on aggregate levels of data that don’t precisely consider the context where the business operates. Stores in London
  • 4.
    © 2016 IBMCorporation Global Business Services Improving Forecast Accuracy with External Data 4 Traditional Method: Neuron Net, ARIMA… Forecast based on Neural Network with External Data: 23.9% better accuracy Actuals of a retail store Riemer, M., Vempaty, A., Calmon, F., Heath, F., Hull, R., and Khabiri, E., Correcting Forecast with Multifactor Neural Attention, Proceedings of the 33rd International Conference on Machine Learning, New York, NY, USA, 2016. JMLR: W&CP volume 48. http://jmlr.org/proceedings/papers/v48/riemer16.pdf T. J. Watson IBM Research Center
  • 5.
    © 2016 IBMCorporation Global Business Services Same color on the map  Similar context considering all external metrics 5 Retail Use Case: Identification of Low/High Performers Groups of similar stores in locations with similar hyperlocal contexts Category: “All Products’, “Electronics”, or “Cosmetics”… Top Performer Top Performer Top Performer Top Performer Group 1 Baseline Group 2 Baseline Group 3 Baseline Group 4 Baseline Potential Revenue Increase: Rev Inc G1= ∆𝑖 Rev Inc G2= ∆𝑖 Rev Inc G3 = ∆𝑖 Rev Inc G4 = ∆𝑖 Micro-Segmentation + External Metrics  Higher Accuracy for Root Cause Analysis and Revenue Increase
  • 6.
    © 2016 IBMCorporation Global Business Services Population Movement Analytics 6 Store in Dallas Close, but few visits. Why? 15%20% 7% 9% 12% 5% of visits Percentage of visits based on buyer’s Home Location, obtained via anonymous app use analysis. 18% Potential location for a new store. Advertisement • Population demographics • Where people are and go P Market Campaign • Interests of each region (% of visits) • Population density P Other Use Cases City Planning • Traffic growth • Precise route • Emergency Services P
  • 7.
    © 2016 IBMCorporation Global Business Services Telecommunication Use Cases: Quality of Services (Tower Location) 7 Affluent Houses  Life Time Revenue (LTR) High Low Medium Congestion High Low Medium Intuition: New tower Max LTR: Ideal position for a new tower Congestion Famous band free show, Saturday, 9-11PM: Tower will be over capacity Schedule a mobile base antenna during event
  • 8.
    © 2016 IBMCorporation Global Business Services Use cases are countless… Banking and Finance 1. Branch Segmentation / New Market Opportunities 2. Cash Demand Forecasting 3. Promotion Customization 4. Staffing Mix / Specialty Account Services 5. Customer Churn 6. ATM Kiosk-to-Location Ratio Optimization Retail 1. Uncaptured Opportunity 2. Assortment Optimization 3. Out of Stock 4. Demand Forecasting 5. Dynamic Pricing 6. Promotion Effectiveness Insurance 1. Risk Management and Pricing Optimization 2. Portfolio Suitability 3. Demand Forecasting 4. Staffing Mix / Specialty Account Services 5. Damage Forecasting City Analytics Industry Use Cases Consumer Packaged Goods 1. Product mix 2. Out of Stock 3. Visibility 4. Expansion Opportunity 5. Customer Churn 6. Promotion Effectiveness Travel and Transportation 1. Booking Traffic Forecasting Based on POIs 2. Service Relative Pricing Model 3. Promotion Customization 4. Amenity Mix 5. Cancellation Forecasting Telecommunications 1. Customer Churn 2. Package/Service Offering Optimization 3. Coverage Optimization 4. New Product Demand 5. Device Repair Services 6. Service Outage Forecasting 8
  • 9.
    © 2016 IBMCorporation Global Business Services Geographic Hierarchy, External Metrics, and Polygons 9 Rockaways Manhattan Soho Midtown Brooklyn Queens Southern Eastern Central External Metric Data Point Domain defined by coordinates: Temperature at (x,y) is 72 F. (x,y) External Metric Data Point Domain defined by a node of the hierarchy: It’s raining in Queens.  It’s raining in all polygons under Queens. Level 0 Level 1 Level 2 New York ManhattanBrooklyn Queens Soho Midtown RockawaysCentralSouthern Eastern Nodes ((lat lon, lat lon, … , lat lon)) ((lat lon, lat lon, … , lat lon), (lat lon, lat lon, … , lat lon)) Polygon 1 Polygon 2 Polygon 3 Rockaways: Central: Most cities have files with the boundaries of sub-regions represented as polygons:
  • 10.
    © 2016 IBMCorporation Global Business Services Associating External and Internal Contexts 10 External Metrics, Events, News… Geographic Hierarchy Polygons Prime Entities (Stores, Towers, ATM…) Customer- Specific Metrics Customer Hierarchies (Product, Sales…) External/Public Context Internal/Customer-Specific Context Coordinates of Prime Entities of any customer can instantly leverage the external context associated to polygons Easily replaced for any customerSame for all customers IBM Metro Pulse Solution
  • 11.
    © 2016 IBMCorporation Global Business Services Fundamental Polygon Functions 11 2) polygons_intersection(“Polygon P”, “Polygon Q”) 1polygons_intersection(“Pol 1”, “Pol 2”) 0polygons_intersection(“Pol 1”, “Pol 3”) Pol 1 Pol 2 Pol 3 Data Quality: No two polygons under the same hierarchy can intersect on any point other than on the edges or vertices. 1) point_in_polygon(“Point X”, “Polygon P”) Pol 1 Pol 2 Pol 3 Pol 4 A B C 1point_in_polygon(“A”, “Pol 2”) 0point_in_polygon(“B”, “Pol 3”) Data Quality: All Prime Entities and Points of Interest must belong to one and only one polygon in each geographic hierarchy.
  • 12.
    © 2016 IBMCorporation Global Business Services External Data Normalization Via a Reference Polygon 12 Reference Polygon Pol 1 Pol 2 Pol 3 Pol 4 Metric 1: Original Pol 1 Pol 2 Pol 3 Pol 4 “Metric 1” values are based on a set of polygons that don’t match the reference polygon. Pol 1 Pol 2 Pol 3 Pol 4 Metric 1: Normalized Different types of metrics (e.g., count, temperature) require different types of aggregation methods.
  • 13.
    © 2016 IBMCorporation Global Business Services External Data Landing Zone IBM Data Lake … Metro Pulse High Level Architecture 13 Global Enriched City Repository External Data From Cities All Over The World) Geographic Boundaries, Polygons, and Hierarchies Analytics Workbench Customer G Analytics Workbench Customer J ... Customer G Specific Data Customer J Specific Data On Premise On Premise DaaS Cities relevant to Customer Z DaaS Cities relevant to Customer L DaaS Cities relevant to Customer K Customers interested in external data only. ... Analytics Workbench Customer A Analytics Workbench Customer B Analytics Workbench Customer F ... Cities relevant to Customer F Customer A Specific Data Customer B Specific Data Customer F Specific Data On the Cloud Analytics Workbench Gold Copy
  • 14.
    © 2016 IBMCorporation Global Business Services Weather GBS Data Lake ExternalData byCity Twitter Census ... Geographical Borders, Polygons, and Hierarchies Metro Pulse Global City Repository (Curated Data) REST API Power Users LandingZone DaaS Metro Pulse Analytical Workbench Gold Copy (One Deployment per Customer) POS ATM Cell Towers ... Files, Tables SFTP / Direct Connections IngestionLayer Customer-SpecificData byCity/Site Metro Pulse Architecture – Version: 2.1 Performance Layer 14 Data Scientists Size of Prize Movement Analytics News Analysis ... Modeling Enhanced Forecast Customer- Specific City Repository Core Analytics Parameters Repository Sandbox DaaS Visualization Business User Power Users AccessServices RESTAPI
  • 15.
    © 2016 IBMCorporation Global Business Services D3… Data Lake Analytics Workbench Data Flow 15 Raw Internal Data Raw Internal Data Clean Internal Data SFTP Validated Internal Data Tabular Internal Data Derived Data Consumable Data Visualized Data Raw External Data Raw External Data Clean External Data Validated External Data Tabular External Data Published Data Cached Published Data Data Samples Results New Core Analytics Sandbox Published in Production Published in Production Data Samples Results New Analytics Sandbox Published in Production Hadoop Cluster: HDFS and HBASEStaging NodeCustomer’s Site Cassandra Redis User’s Additional Data Customer’s Site User’s Database Customer’s Site Spark Spark Integrated Data Node.js Node.js Micro services reusable not only for other customers, but also for other solutions
  • 16.
    © 2016 IBMCorporation Global Business Services Micro Services for Data Ingestion and Curation 16 Data Sources Ingestion Engine RDMBS Structured Files Unstructured Copy Data HadoopEdge Node Analytic Persistence Curation Engine Hadoop, HBASE. Cassandra, Redis… Get Data Raw Data Store Prepare Raw Data Curate Data Transform / Enrich Data Conformed/ Polyglot Data Store 23 1 2 3 4 5 6 7 8 9 10 11 12 13 14 15 16 17 18 19 20 21 22 2322 2322 1 2 3 19 Reference Data Lookup 20 Transform Data 21 Enrich Data 22 Archive 23 Purge 1 Error & Exception Processing 2 Configuration set up 3 Audit, Balance, & Control 4 Transport Data from Source to Edge Node 5 Convert Data Formats 6 Copy/Move Data to Hadoop 7 Preprocessing Service 8 Technical Data Validation (TDQ) 9 Source Delta Processing 10 Persist Raw Data 11 Catalog Raw Data 12 Profile Data 13 Cross File Analysis 14 Causality Analysis 15 Target Load Service 16 Business Data Validation 17 Merge / Match 18 Manage Keys Micro Services
  • 17.
    © 2016 IBMCorporation Global Business Services Loading Geographic Hierarchy to HBASE Table L0 Row Desc … London London is… Great Britain… Paris Paris is… Continental Europe… Table L1 Row Desc History… London:Central … …… London:North … …… HistoryName London Paris Central North Name … Paris:Central … ……Central … … Table L2 Row Desc History… London:Central:Kensington … …… London:Central:Buckingham … …… Kensington Buckingham Name … Table L3 Row Desc History… London:Central:Kensington:Notting Barns … …… … … …… Notting Barns … Name … P1 P2 P3 PN… P1 P2 P3 PN… P1 P2 P3 PN… P1 P2 P3 PN… Column Family: Data Column Family: Polygons Column Family: Data Column Family: Polygons Column Family: Data Column Family: Polygons Column Family: Data Column Family: Polygons 50484 51673 54735 53896 75736 78493 78303 79659 50484 51673 54735 50484 51673 50484
  • 18.
    © 2016 IBMCorporation Global Business Services Metro Pulse Analytical Workbench Edge Node Flume Agent: Tweets Flume Agent: Weather Flume Agent: News Hadoop Data Nodes: HDFS Tweets Weather News ... Metro Pulse Analytical Workbench Edge Node Flume Agent: Tweets Flume Agent: Weather Flume Agent: News Hadoop Data Nodes: HDFS Tweets Weather News ... Metro Pulse Analytical Workbench Edge Node Flume Agent: Tweets Flume Agent: Weather Flume Agent: News Hadoop Data Nodes: HDFS Tweets Weather News ... Easy to broadcast same data to multiple customers. Easy to add new customers. Metro Pulse Analytical Workbench Edge Node Flume Agent: Tweets Flume Agent: Weather Flume Agent: News Hadoop Data Nodes: HDFS Tweets Weather News ... Ingesting External Data via Flume 18 Flume Agent: Tweets Flume Agent: Weather Flume Agent: News ...Metro Pulse Global Repository Flume Server Global City Repository Tweets Weather News Internet Agents can be optimally configured according to the data sources characteristics Each agent writes to a different HDFS folders: no conflict, good for parallel execution Each source is captured as a HBASE column family One data source per agent: easy to add new sources
  • 19.
    © 2016 IBMCorporation Global Business Services Performance Layer 19 - V_Transaction - V_Level_Entity - V_Polygon_Entity - V_Size_of_Prize ... Cache Manager Get_View(“XYZ”) - V_Level_Entity - V_Size_of_Prize API - If “XYZ” in Redis, return “XYZ” - Else: - Get “XYZ” from Cassandra - Return “XYZ” to the API - Load “XYZ” to Redis “XYZ” Eviction Policy: Less Recently Used Sub-second latency and high throughput Dashboards small files High throughput for large files  DaaS
  • 20.
    © 2016 IBMCorporation Global Business Services Sample of Visualization Objects on D3.js 20
  • 21.
    © 2016 IBMCorporation Global Business Services 21