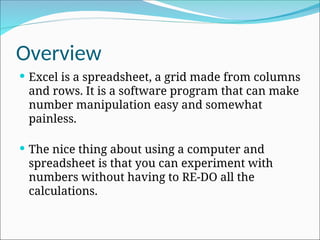
Overview
Excel isa spreadsheet, a grid made from columns
and rows. It is a software program that can make
number manipulation easy and somewhat
painless.
The nice thing about using a computer and
spreadsheet is that you can experiment with
numbers without having to RE-DO all the
calculations.
3.
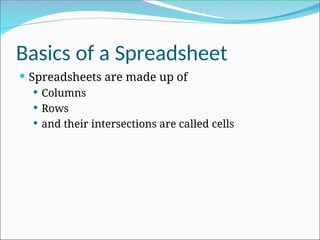
Basics of aSpreadsheet
Spreadsheets are made up of
Columns
Rows
and their intersections are called cells
4.
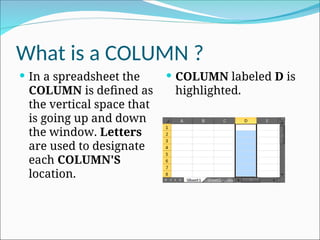
What is aCOLUMN ?
In a spreadsheet the
COLUMN is defined as
the vertical space that
is going up and down
the window. Letters
are used to designate
each COLUMN'S
location.
COLUMN labeled D is
highlighted.
5.
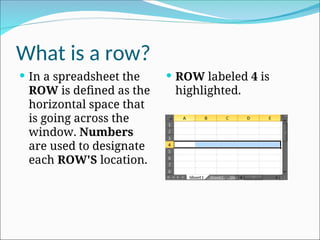
What is arow?
In a spreadsheet the
ROW is defined as the
horizontal space that
is going across the
window. Numbers
are used to designate
each ROW'S location.
ROW labeled 4 is
highlighted.
6.
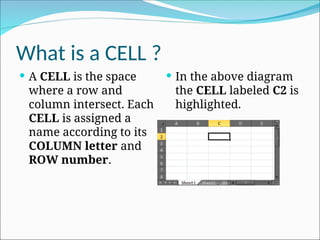
What is aCELL ?
A CELL is the space
where a row and
column intersect. Each
CELL is assigned a
name according to its
COLUMN letter and
ROW number.
In the above diagram
the CELL labeled C2 is
highlighted.
7.
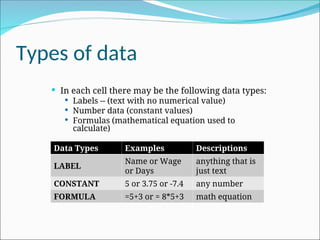
Types of data
In each cell there may be the following data types:
Labels -- (text with no numerical value)
Number data (constant values)
Formulas (mathematical equation used to
calculate)
Data Types Examples Descriptions
LABEL
Name or Wage
or Days
anything that is
just text
CONSTANT 5 or 3.75 or -7.4 any number
FORMULA =5+3 or = 8*5+3 math equation
8.
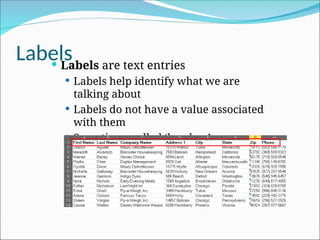
Labels
Labels aretext entries
Labels help identify what we are
talking about
Labels do not have a value associated
with them
Sometimes called ‘headers’
9.
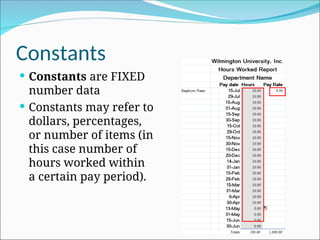
Constants
Constants areFIXED
number data
Constants may refer to
dollars, percentages,
or number of items (in
this case number of
hours worked within
a certain pay period).
10.
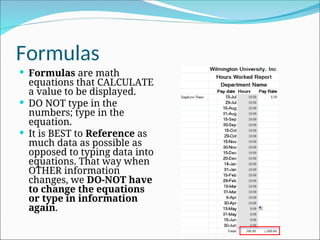
Formulas
Formulas aremath
equations that CALCULATE
a value to be displayed.
DO NOT type in the
numbers; type in the
equation.
It is BEST to Reference as
much data as possible as
opposed to typing data into
equations. That way when
OTHER information
changes, we DO-NOT have
to change the equations
or type in information
again.
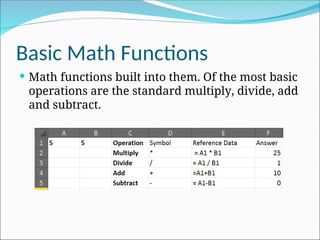
Basic Math Functions
Math functions built into them. Of the most basic
operations are the standard multiply, divide, add
and subtract.
13.
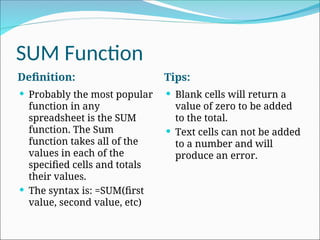
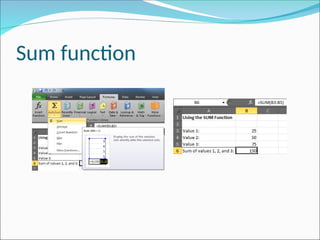
SUM Function
Definition: Tips:
Probably the most popular
function in any
spreadsheet is the SUM
function. The Sum
function takes all of the
values in each of the
specified cells and totals
their values.
The syntax is: =SUM(first
value, second value, etc)
Blank cells will return a
value of zero to be added
to the total.
Text cells can not be added
to a number and will
produce an error.
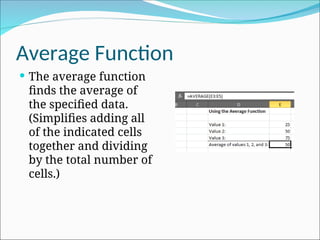
Average Function
Theaverage function
finds the average of
the specified data.
(Simplifies adding all
of the indicated cells
together and dividing
by the total number of
cells.)
16.
Max & MinFunctions
The Max function will return the
largest (max) value in the selected
range of cells. The Min function will
display the smallest value in a selected
set of cells.
17.
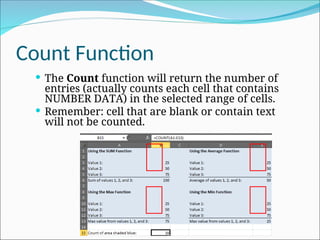
Count Function
TheCount function will return the number of
entries (actually counts each cell that contains
NUMBER DATA) in the selected range of cells.
Remember: cell that are blank or contain text
will not be counted.
18.
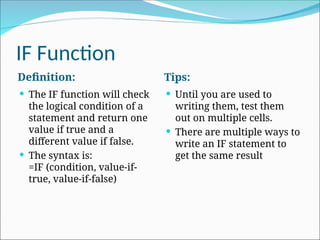
IF Function
Definition: Tips:
The IF function will check
the logical condition of a
statement and return one
value if true and a
different value if false.
The syntax is:
=IF (condition, value-if-
true, value-if-false)
Until you are used to
writing them, test them
out on multiple cells.
There are multiple ways to
write an IF statement to
get the same result
19.
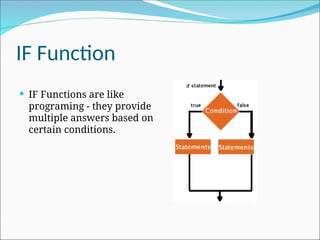
IF Function
IFFunctions are like
programing - they provide
multiple answers based on
certain conditions.
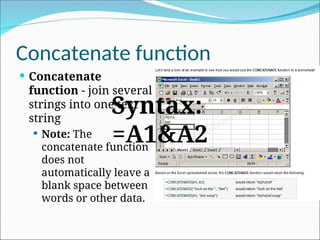
Concatenate function
Concatenate
function- join several
strings into one text
string
Note: The
concatenate function
does not
automatically leave a
blank space between
words or other data.
Syntax:
=A1&A2
22.
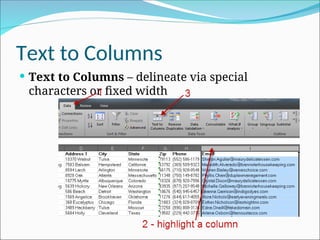
Text to Columns
Text to Columns – delineate via special
characters or fixed width
23.
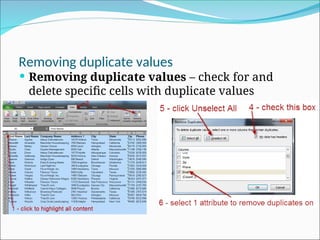
Removing duplicate values
Removing duplicate values – check for and
delete specific cells with duplicate values
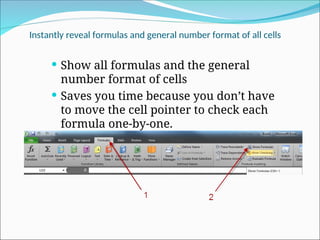
Instantly reveal formulasand general number format of all cells
Show all formulas and the general
number format of cells
Saves you time because you don’t have
to move the cell pointer to check each
formula one-by-one.
26.
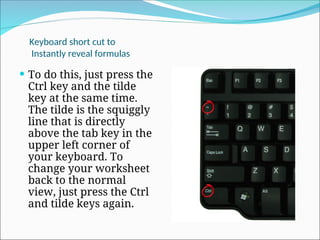
Keyboard short cutto
Instantly reveal formulas
To do this, just press the
Ctrl key and the tilde
key at the same time.
The tilde is the squiggly
line that is directly
above the tab key in the
upper left corner of
your keyboard. To
change your worksheet
back to the normal
view, just press the Ctrl
and tilde keys again.
27.
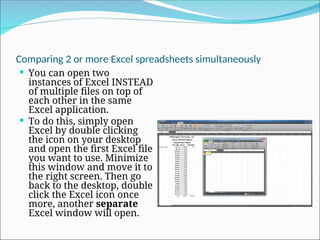
Comparing 2 ormore Excel spreadsheets simultaneously
You can open two
instances of Excel INSTEAD
of multiple files on top of
each other in the same
Excel application.
To do this, simply open
Excel by double clicking
the icon on your desktop
and open the first Excel file
you want to use. Minimize
this window and move it to
the right screen. Then go
back to the desktop, double
click the Excel icon once
more, another separate
Excel window will open.
28.
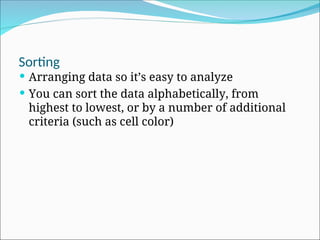
Sorting
Arranging dataso it’s easy to analyze
You can sort the data alphabetically, from
highest to lowest, or by a number of additional
criteria (such as cell color)
29.
filters
The Filteris a quick and easy way to find and
work with a subset of data in a range of cells.
30.
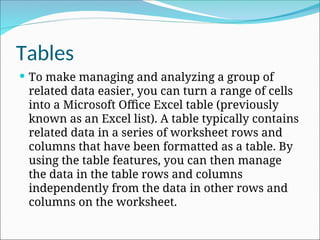
Tables
To makemanaging and analyzing a group of
related data easier, you can turn a range of cells
into a Microsoft Office Excel table (previously
known as an Excel list). A table typically contains
related data in a series of worksheet rows and
columns that have been formatted as a table. By
using the table features, you can then manage
the data in the table rows and columns
independently from the data in other rows and
columns on the worksheet.
31.
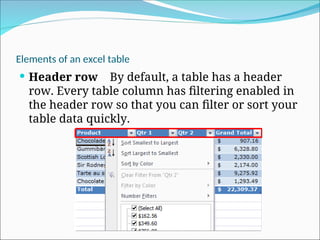
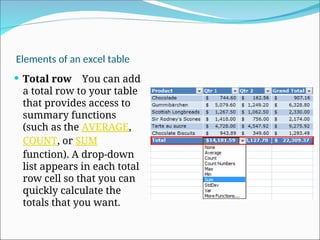
Elements of anexcel table
Header row By default, a table has a header
row. Every table column has filtering enabled in
the header row so that you can filter or sort your
table data quickly.
32.
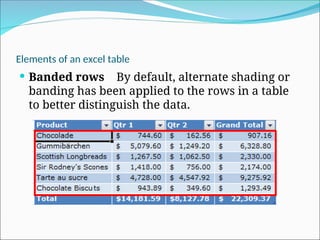
Elements of anexcel table
Banded rows By default, alternate shading or
banding has been applied to the rows in a table
to better distinguish the data.
33.
Elements of anexcel table
Total row You can add
a total row to your table
that provides access to
summary functions
(such as the AVERAGE,
COUNT, or SUM
function). A drop-down
list appears in each total
row cell so that you can
quickly calculate the
totals that you want.
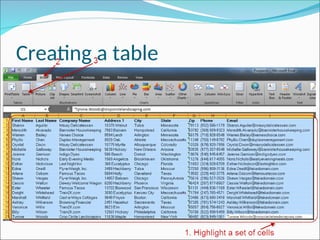
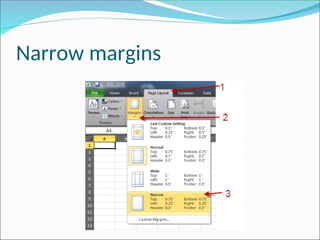
Freeze Headers
Tofreeze a row in your worksheet, highlight the
row where you wish all rows before the
highlighted row to be frozen or locked, go to
Window>Freeze Panes and you will see a line
appear across your worksheet. Everything
above the line is frozen and will remain in view
when you scroll down your worksheet.
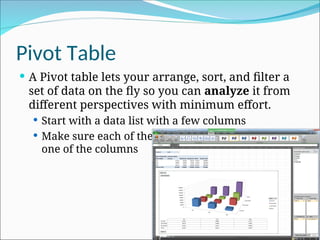
Pivot Table
APivot table lets your arrange, sort, and filter a
set of data on the fly so you can analyze it from
different perspectives with minimum effort.
Start with a data list with a few columns
Make sure each of the rows have a value of each
one of the columns
#18 IF Functions are like programing, THEY provide multiple answers based on certain conditions.
Until you are used to writing them, test them out on multiple cells. There are multiple ways to write an IF statement to get the same result


![[DSC Europe 25] Andrzej Kowalczyk - AI - how to start small and grow in the f...](https://cdn.slidesharecdn.com/ss_thumbnails/oy1zmo94qv6vpcqjvno2-andrzej-kowalczyk-ai-how-to-start-small-and-grow-in-the-future-1-260119121559-cf093b23-thumbnail.jpg?width=640&height=640&fit=bounds)


![[DSC Europe 25] Bojan Djuricic - Predictive Design Process.pdf](https://cdn.slidesharecdn.com/ss_thumbnails/5awdrbedqdek3gqu2ezy-4-the-predictive-design-bojan-djuricic-260120105856-6c399e9b-thumbnail.jpg?width=640&height=640&fit=bounds)


![[DSC Europe 25] Ivan Lukovic & Marija Djukic - From Data to Value: Why Maturi...](https://cdn.slidesharecdn.com/ss_thumbnails/ahrfps8xr6knowwhacxh-1-ivan-marija-dsc-2025-ld-v1-presentation-260115093812-be21adfc-thumbnail.jpg?width=640&height=640&fit=bounds)