Download as PDF, PPTX
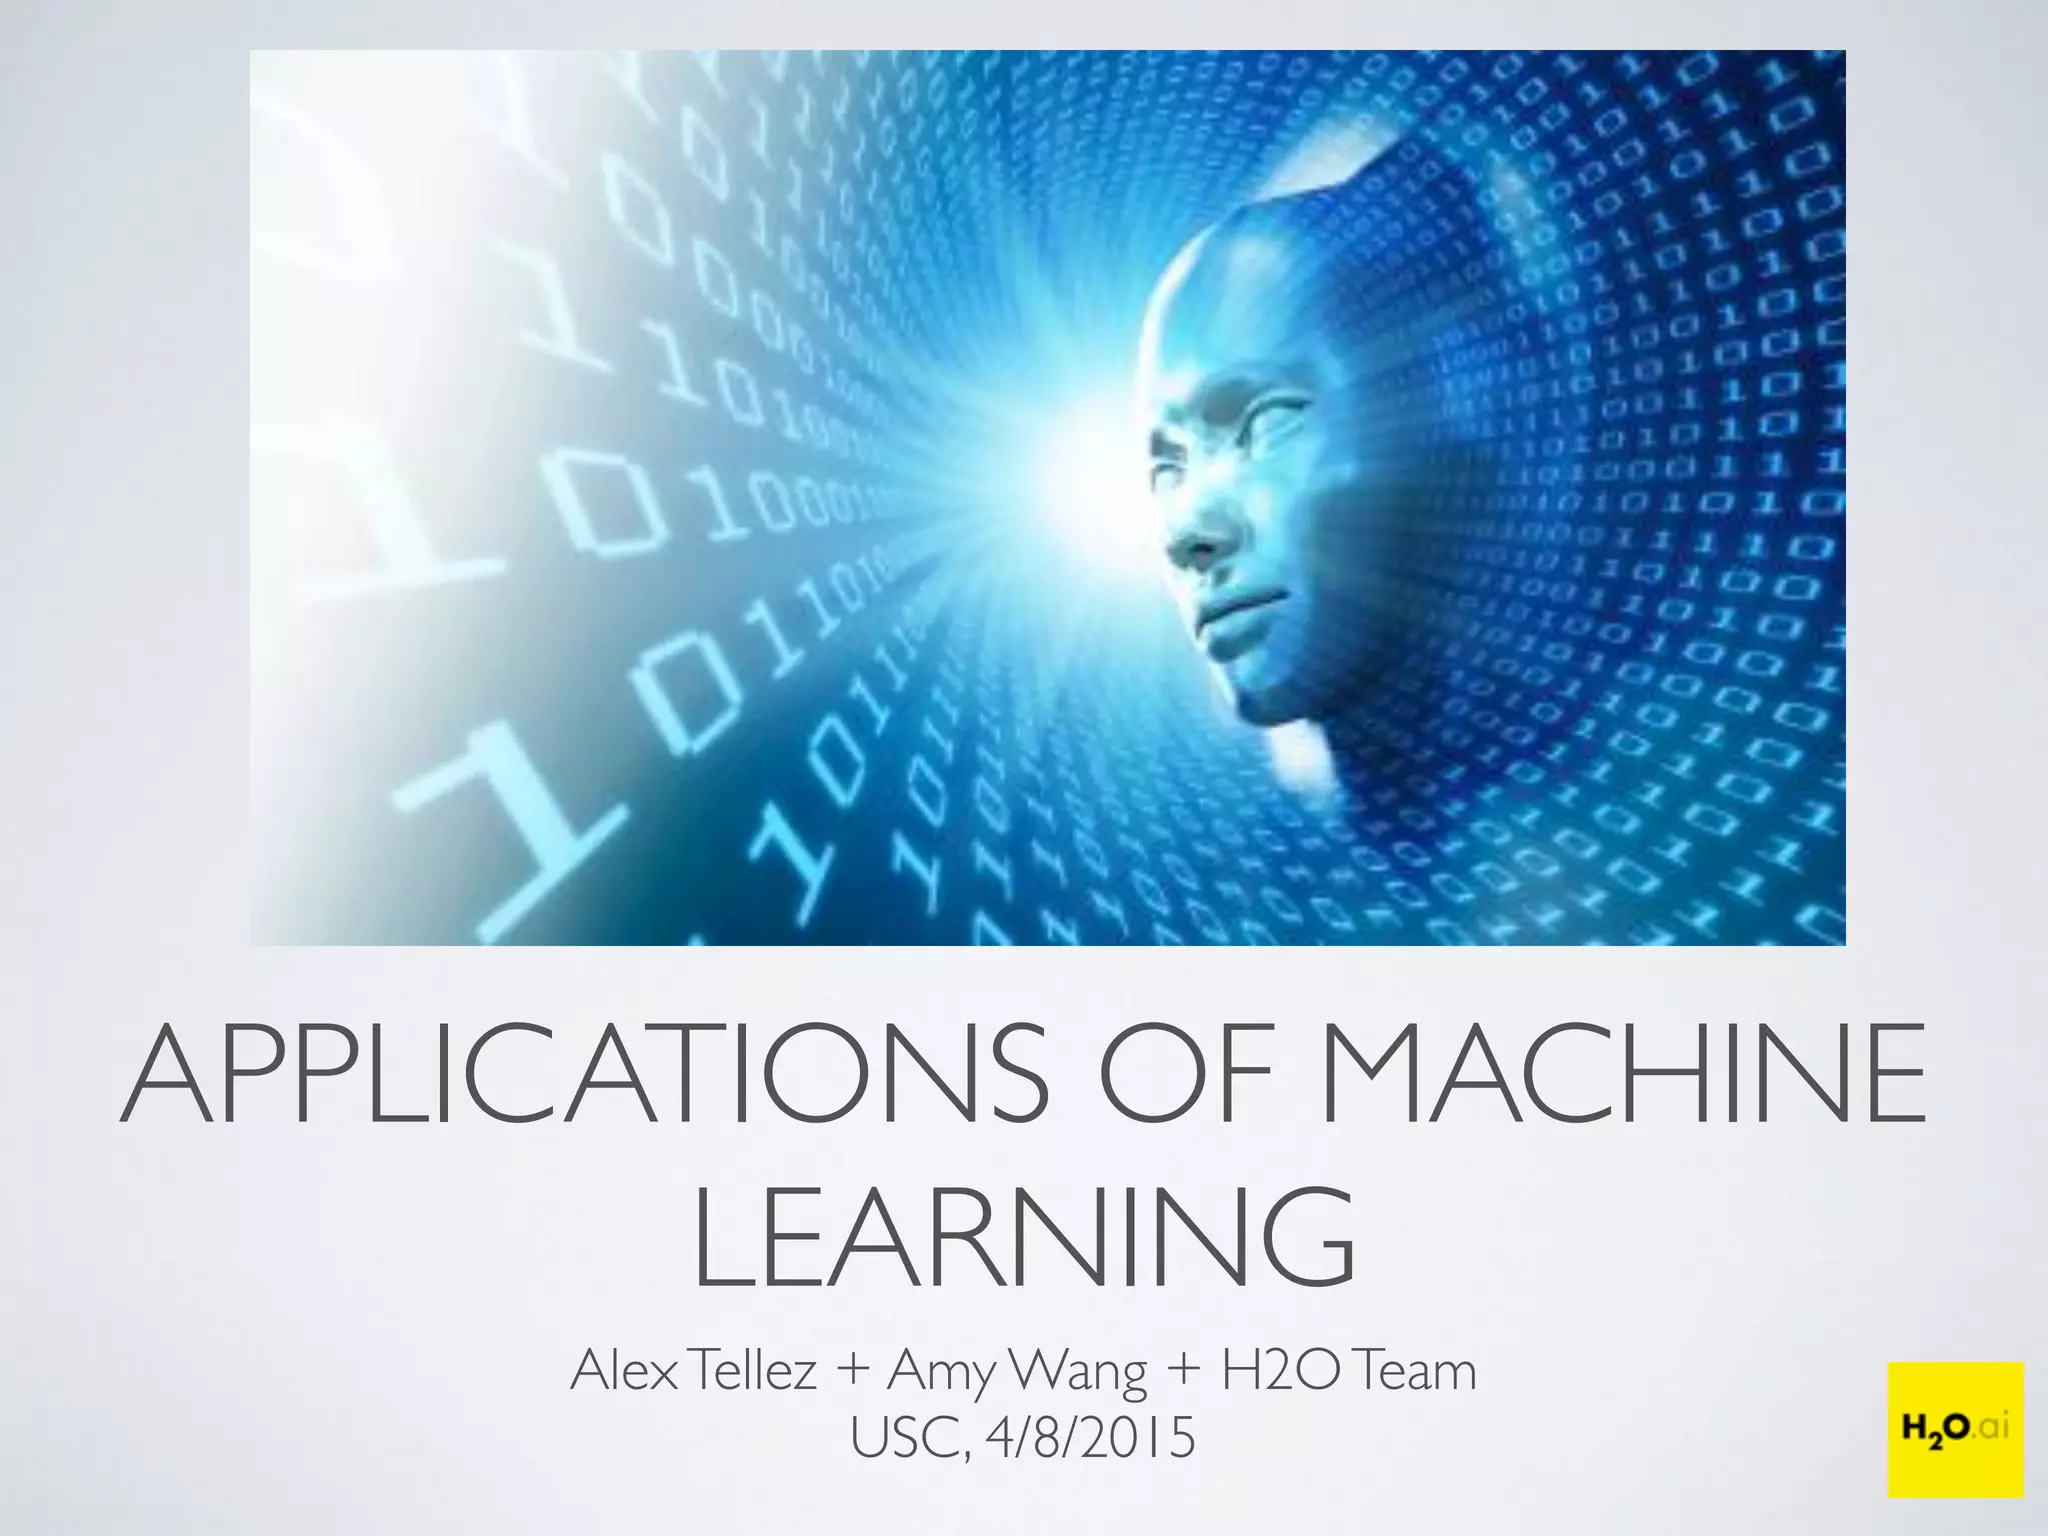
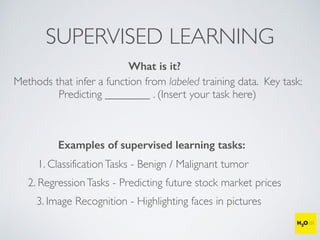
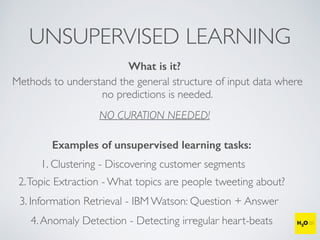
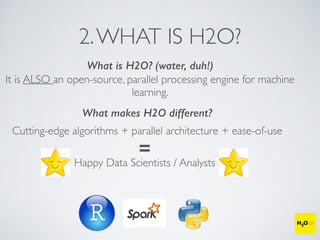
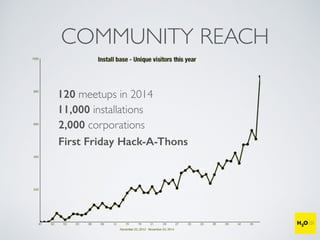
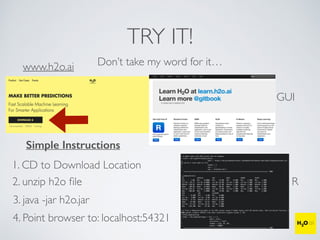
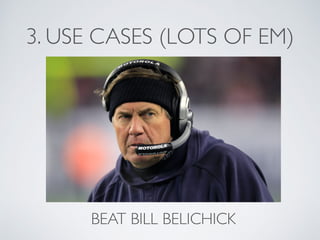
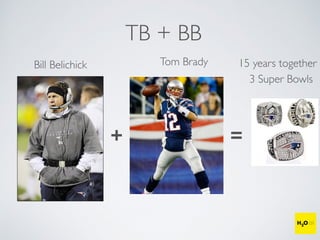
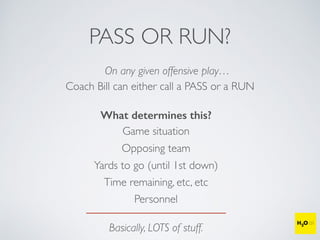
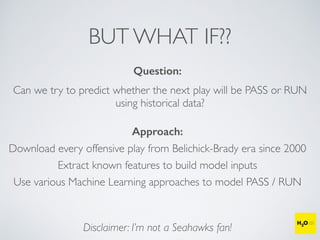
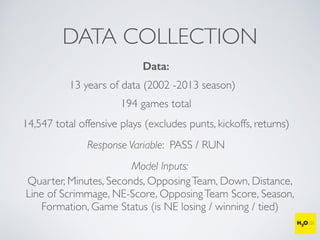

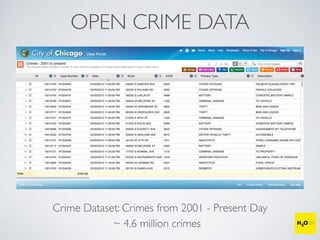
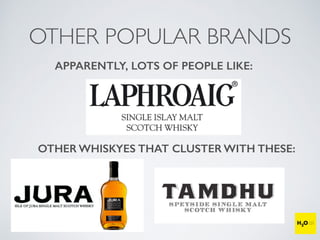
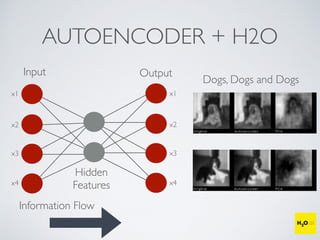
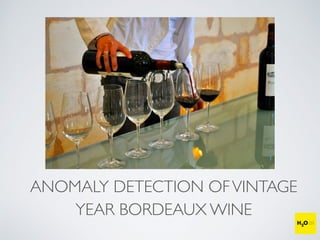
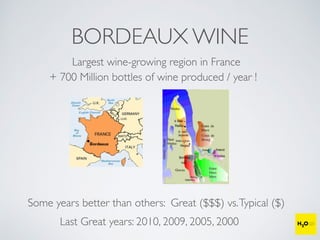
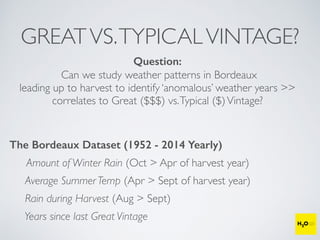
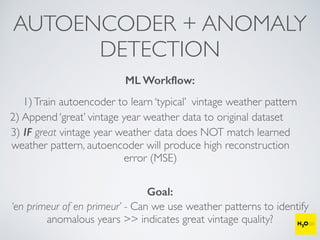
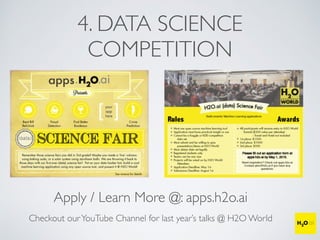

The document discusses the applications of machine learning, particularly through the H2O.ai platform, emphasizing the challenges and opportunities presented by big data. It covers various use cases including predicting football plays, crime analysis in Chicago, whiskey recommendations, and identifying exceptional Bordeaux wine vintages, supported by data science competitions. The text introduces essential machine learning concepts such as supervised and unsupervised learning, along with H2O's capabilities and techniques for processing large datasets.

![Big Data [sorry] & Data Science: What Does a Data Scientist Do?](https://cdn.slidesharecdn.com/ss_thumbnails/dslatcloudmsevent20130125-130126065651-phpapp01-thumbnail.jpg?width=640&height=640&fit=bounds)


![20260201 [FOSDEM] gomodjail - library sandboxing for Go modules.pdf](https://cdn.slidesharecdn.com/ss_thumbnails/20260201fosdemgomodjail-librarysandboxingforgomodules-260201225659-76609ec4-thumbnail.jpg?width=640&height=640&fit=bounds)


