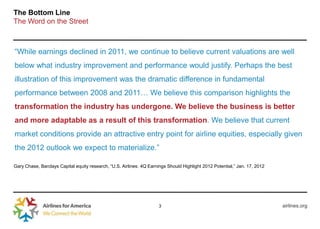
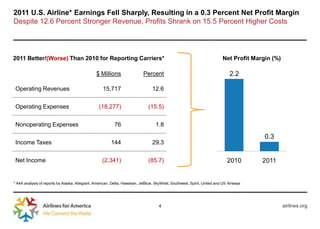
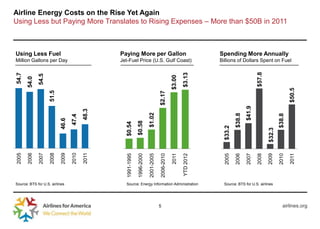
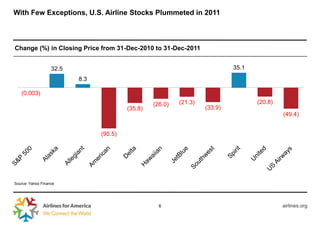
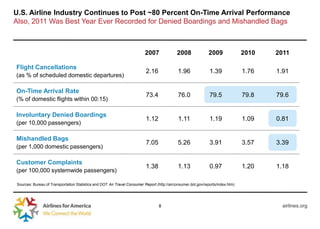
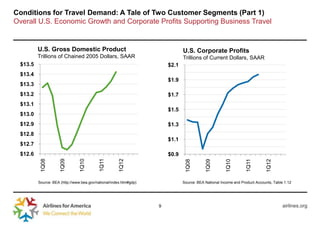
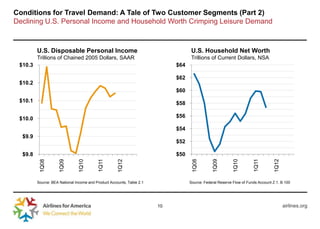
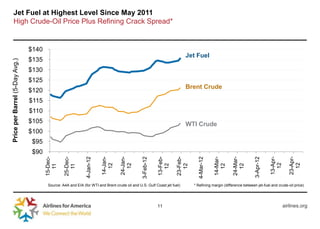
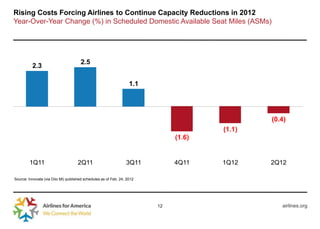
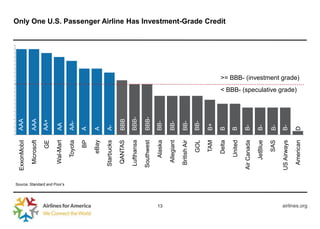
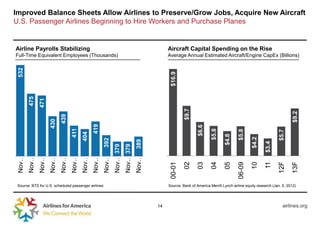
John P. Heimlich
Vice President and Chief Economist
Airlines for America


Media Briefing
February 28, 2012
The Bottom Line
The Word on the Street


“While earnings declined in 2011, we continue to believe current valuations are well
below what industry improvement and performance would justify. Perhaps the best
illustration of this improvement was the dramatic difference in fundamental
performance between 2008 and 2011… We believe this comparison highlights the
transformation the industry has undergone. We believe the business is better
and more adaptable as a result of this transformation. We believe that current
market conditions provide an attractive entry point for airline equities, especially given
the 2012 outlook we expect to materialize.”

Gary Chase, Barclays Capital equity research, “U.S. Airlines: 4Q Earnings Should Highlight 2012 Potential,” Jan. 17, 2012


                                                                      3                                                     airlines.org
2011 U.S. Airline* Earnings Fell Sharply, Resulting in a 0.3 Percent Net Profit Margin
Despite 12.6 Percent Stronger Revenue, Profits Shrank on 15.5 Percent Higher Costs


2011 Better/(Worse) Than 2010 for Reporting Carriers*                                                                     Net Profit Margin (%)

                                                $ Millions                  Percent                                           2.2

 Operating Revenues                                 15,717                       12.6


 Operating Expenses                               (18,277)                     (15.5)


 Nonoperating Expenses                                     76                      1.8

                                                                                                                                         0.3
 Income Taxes                                            144                     29.3


 Net Income                                         (2,341)                    (85.7)                                        2010       2011


* A4A analysis of reports by Alaska, Allegiant, American, Delta, Hawaiian, JetBlue, SkyWest, Southwest, Spirit, United and US Airways


                                                                                     4                                                            airlines.org
Airline Energy Costs on the Rise Yet Again
Using Less but Paying More Translates to Rising Expenses – More than $50B in 2011


Using Less Fuel                                  Paying More per Gallon                                                Spending More Annually
Million Gallons per Day                          Jet-Fuel Price (U.S. Gulf Coast)                                      Billions of Dollars Spent on Fuel


                                                                                                                                                 $57.8
                                                                                                            $3.13
54.7


              54.5


                                                                                                    $3.00
       54.0


                                                                                                                                                                         $50.5
                     51.5


                                                                                        $2.17


                                                                                                                                         $41.9
                                          48.3


                                                                            $1.02


                                                                                                                                 $38.8


                                                                                                                                                                 $38.8
                                   47.4
                            46.6


                                                                $0.58
                                                   $0.54


                                                                                                                         $33.2


                                                                                                                                                         $32.3
              2007
2005

       2006


                     2008

                            2009

                                   2010

                                          2011


                                                    1991-1995

                                                                1996-2000

                                                                            2001-2005

                                                                                        2006-2010

                                                                                                    2011

                                                                                                            YTD 2012


                                                                                                                         2005

                                                                                                                                 2006

                                                                                                                                         2007

                                                                                                                                                 2008

                                                                                                                                                         2009

                                                                                                                                                                 2010

                                                                                                                                                                         2011
Source: BTS for U.S. airlines                      Source: Energy Information Administration                             Source: BTS for U.S. airlines


                                                                                        5                                                                           airlines.org
With Few Exceptions, U.S. Airline Stocks Plummeted in 2011


Change (%) in Closing Price from 31-Dec-2010 to 31-Dec-2011


                   32.5                                                      35.1
                          8.3

   (0.003)
                                                  (26.0)   (21.3)                   (20.8)
                                         (35.8)                     (33.9)
                                                                                             (49.4)


                                (95.5)


Source: Yahoo Finance


                                                    6                                        airlines.org
U.S. Airline Industry Continues to Post ~80 Percent On-Time Arrival Performance
Also, 2011 Was Best Year Ever Recorded for Denied Boardings and Mishandled Bags


                                                                          2007              2008               2009              2010   2011

Flight Cancellations
                                                                          2.16               1.96              1.39              1.76   1.91
(as % of scheduled domestic departures)

On-Time Arrival Rate
                                                                          73.4               76.0              79.5              79.8   79.6
(% of domestic flights within 00:15)

Involuntary Denied Boardings
                                                                          1.12               1.11              1.19              1.09   0.81
(per 10,000 passengers)

Mishandled Bags
                                                                          7.05               5.26              3.91              3.57   3.39
(per 1,000 domestic passengers)

Customer Complaints
                                                                          1.38               1.13              0.97              1.20   1.18
(per 100,000 systemwide passengers)

Sources: Bureau of Transportation Statistics and DOT Air Travel Consumer Report (http://airconsumer.dot.gov/reports/index.htm)


                                                                                  8                                                      airlines.org
Conditions for Travel Demand: A Tale of Two Customer Segments (Part 1)
Overall U.S. Economic Growth and Corporate Profits Supporting Business Travel


         U.S. Gross Domestic Product                                          U.S. Corporate Profits
         Trillions of Chained 2005 Dollars, SAAR                              Trillions of Current Dollars, SAAR
 $13.5                                                                 $2.1
 $13.4
                                                                       $1.9
 $13.3
 $13.2                                                                 $1.7
 $13.1
                                                                       $1.5
 $13.0
 $12.9                                                                 $1.3
 $12.8
                                                                       $1.1
 $12.7
 $12.6                                                                 $0.9
                                           1Q11
          1Q08


                     1Q09


                                1Q10


                                                      1Q12


                                                                               1Q08


                                                                                          1Q09


                                                                                                      1Q10


                                                                                                                            1Q12
                                                                                                                 1Q11
         Source: BEA (http://www.bea.gov/national/index.htm#gdp)              Source: BEA National Income and Product Accounts, Table 1.12


                                                                   9                                                                 airlines.org
Conditions for Travel Demand: A Tale of Two Customer Segments (Part 2)
Declining U.S. Personal Income and Household Worth Crimping Leisure Demand


         U.S. Disposable Personal Income                                           U.S. Household Net Worth
         Trillions of Chained 2005 Dollars, SAAR                                   Trillions of Current Dollars, NSA
 $10.3                                                                      $64

                                                                            $62
 $10.2
                                                                            $60
 $10.1                                                                      $58

 $10.0                                                                      $56

                                                                            $54
  $9.9
                                                                            $52

  $9.8                                                                      $50


                                                                                   1Q08


                                                                                               1Q09


                                                                                                          1Q10


                                                                                                                                 1Q12
                                                                                                                     1Q11
                                1Q10


                                           1Q11
          1Q08


                     1Q09


                                                     1Q12


         Source: BEA National Income and Product Accounts, Table 2.1              Source: Federal Reserve Flow of Funds Account Z.1, B.100


                                                                       10                                                               airlines.org
Jet Fuel at Highest Level Since May 2011
   High Crude-Oil Price Plus Refining Crack Spread*


                                $140
                                                                                                                         Jet Fuel
                                $135
Price per Barrel (5-Day Avg.)


                                $130
                                $125
                                                                                                                         Brent Crude
                                $120
                                $115
                                $110
                                $105                                                                                     WTI Crude
                                $100
                                $95
                                $90
                                       15-Dec-


                                                 25-Dec-


                                                                         14-Jan-


                                                                                   24-Jan-


                                                                                                          13-Feb-


                                                                                                                    23-Feb-


                                                                                                                                           14-Mar-


                                                                                                                                                     24-Mar-


                                                                                                                                                                              13-Apr-


                                                                                                                                                                                           23-Apr-
                                                              4-Jan-12


                                                                                               3-Feb-12


                                                                                                                                4-Mar-12


                                                                                                                                                                   3-Apr-12


                                                                                                                                                                                             12
                                                                                                                                                                                12
                                                                                     12
                                                                           12


                                                                                                                                             12


                                                                                                                                                       12
                                                                                                            12


                                                                                                                      12
                                         11


                                                   11


                                        Source: A4A and EIA (for WTI and Brent crude oil and U.S. Gulf Coast jet fuel)        * Refining margin (difference between jet-fuel and crude-oil price)


                                                                                                          11                                                                            airlines.org
Rising Costs Forcing Airlines to Continue Capacity Reductions in 2012
Year-Over-Year Change (%) in Scheduled Domestic Available Seat Miles (ASMs)


                                      2.5
          2.3

                                                                   1.1


                                                                                              (0.4)
                                                                                      (1.1)
                                                                              (1.6)


        1Q11                         2Q11                        3Q11         4Q11    1Q12    2Q12

Source: Innovata (via Diio Mi) published schedules as of Feb. 24, 2012


                                                                         12                      airlines.org
ExxonMobil     AAA

                                               Microsoft    AAA

                                                     GE     AA+

                                               Wal-Mart     AA


               Source: Standard and Poor’s
                                                 Toyota     AA-

                                                     BP     A

                                                   eBay     A

                                              Starbucks     A-

                                               QANTAS       BBB

                                              Lufthansa     BBB-

                                             Southwest      BBB-


13
                                                 Alaska     BB-

                                               Allegiant    BB-

                                              British Air   BB-

                                                   GOL      BB-

                                                   TAM      B+
                                                                                                                             Only One U.S. Passenger Airline Has Investment-Grade Credit


                                                  Delta     B

                                                 United     B

                                             Air Canada     B-

                                                JetBlue     B-

                                                   SAS      B-
                                             US Airways     B-
                                                                   < BBB- (speculative grade)
                                                                                                >= BBB- (investment grade)


                                              American      D
airlines.org
Improved Balance Sheets Allow Airlines to Preserve/Grow Jobs, Acquire New Aircraft
U.S. Passenger Airlines Beginning to Hire Workers and Purchase Planes


Airline Payrolls Stabilizing                                                                      Aircraft Capital Spending on the Rise
Full-Time Equivalent Employees (Thousands)                                                        Average Annual Estimated Aircraft/Engine CapEx (Billions)
 532


                                                                                                   $16.9
        475
               471


                                                                                                           $9.7


                                                                                                                                                                            $9.2
                             439
                      430


                                                  419


                                                                                                                   $6.6
                                    411


                                                                                                                           $5.8


                                                                                                                                           $5.8


                                                                                                                                                                   $5.7
                                           404


                                                                                                                                   $4.8


                                                                                                                                                   $4.2
                                                         392


                                                                                      389


                                                                                                                                                           $3.4
                                                                           Nov… 379
                                                                Nov… 379
        Nov…
 Nov…


               Nov…
                      Nov…
                             Nov…
                                    Nov…
                                           Nov…
                                                  Nov…
                                                         Nov…


                                                                                      Nov…


                                                                                                                                                                           13F
                                                                                                                                                                   12F
                                                                                                           02

                                                                                                                   03

                                                                                                                           04

                                                                                                                                   05


                                                                                                                                                   10

                                                                                                                                                           11
                                                                                                   00-01


                                                                                                                                           06-09
 Source: BTS for U.S. scheduled passenger airlines                                                Source: Bank of America Merrill Lynch airline equity research (Jan. 5, 2012)


                                                                                             14                                                                      airlines.org
U.S. Passenger Airlines: Economic Review
The Bottom Line in Early 2012


» Looking Back
  • Net profit margin fell from 1.6 percent in 2010 to 0.3 percent (prelim. per 11 carriers) in 2011
    o   Second year of modest profitability after recording an average margin of -6.3 percent in 2001-2009
    o   All but three U.S. airline stocks took a beating in 2011, especially relative to S&P 500
    o   Spot price of U.S. jet fuel hit all-time high in 2011; thus far (through Feb. 22), running 16 percent higher in 2012
  • 2011 was a stellar year on many operational fronts
    o   Second consecutive year of zero passenger fatalities
    o   Best year ever recorded for baggage handling and denied boardings; best 4Q ever recorded for on-time arrivals
    o   All-time high for U.S. exports of air-travel services ($36.7B) and for U.S. merchandise exported by air ($424.3B)

» Looking Ahead
  • Fuel remains largest and most volatile cost – continuing threat to GDP and earnings
  • Airlines reacting to increasing (and volatile) marginal costs and uncertain revenues with
    conservative volumes, high utilization of existing assets, “variabilization” of cost
    structure, avoidance of costs incurred without sufficient revenues generated, product
    diversification
  • Major focus on debt reduction, fleet renewal and product enhancement
  • Improved financial wherewithal translating to uptick in employment and fleet upgrades
  • Increasing governmental/regulatory costs creating potential barrier to entry for start-ups

                                                                    15                                                         airlines.org
www.airlines.org

U.S. Airlines Economic Review

  • 1.
    John P. Heimlich VicePresident and Chief Economist Airlines for America Media Briefing February 28, 2012
  • 2.
    The Bottom Line TheWord on the Street “While earnings declined in 2011, we continue to believe current valuations are well below what industry improvement and performance would justify. Perhaps the best illustration of this improvement was the dramatic difference in fundamental performance between 2008 and 2011… We believe this comparison highlights the transformation the industry has undergone. We believe the business is better and more adaptable as a result of this transformation. We believe that current market conditions provide an attractive entry point for airline equities, especially given the 2012 outlook we expect to materialize.” Gary Chase, Barclays Capital equity research, “U.S. Airlines: 4Q Earnings Should Highlight 2012 Potential,” Jan. 17, 2012 3 airlines.org
  • 3.
    2011 U.S. Airline*Earnings Fell Sharply, Resulting in a 0.3 Percent Net Profit Margin Despite 12.6 Percent Stronger Revenue, Profits Shrank on 15.5 Percent Higher Costs 2011 Better/(Worse) Than 2010 for Reporting Carriers* Net Profit Margin (%) $ Millions Percent 2.2 Operating Revenues 15,717 12.6 Operating Expenses (18,277) (15.5) Nonoperating Expenses 76 1.8 0.3 Income Taxes 144 29.3 Net Income (2,341) (85.7) 2010 2011 * A4A analysis of reports by Alaska, Allegiant, American, Delta, Hawaiian, JetBlue, SkyWest, Southwest, Spirit, United and US Airways 4 airlines.org
  • 4.
    Airline Energy Costson the Rise Yet Again Using Less but Paying More Translates to Rising Expenses – More than $50B in 2011 Using Less Fuel Paying More per Gallon Spending More Annually Million Gallons per Day Jet-Fuel Price (U.S. Gulf Coast) Billions of Dollars Spent on Fuel $57.8 $3.13 54.7 54.5 $3.00 54.0 $50.5 51.5 $2.17 $41.9 48.3 $1.02 $38.8 $38.8 47.4 46.6 $0.58 $0.54 $33.2 $32.3 2007 2005 2006 2008 2009 2010 2011 1991-1995 1996-2000 2001-2005 2006-2010 2011 YTD 2012 2005 2006 2007 2008 2009 2010 2011 Source: BTS for U.S. airlines Source: Energy Information Administration Source: BTS for U.S. airlines 5 airlines.org
  • 5.
    With Few Exceptions,U.S. Airline Stocks Plummeted in 2011 Change (%) in Closing Price from 31-Dec-2010 to 31-Dec-2011 32.5 35.1 8.3 (0.003) (26.0) (21.3) (20.8) (35.8) (33.9) (49.4) (95.5) Source: Yahoo Finance 6 airlines.org
  • 6.
    U.S. Airline IndustryContinues to Post ~80 Percent On-Time Arrival Performance Also, 2011 Was Best Year Ever Recorded for Denied Boardings and Mishandled Bags 2007 2008 2009 2010 2011 Flight Cancellations 2.16 1.96 1.39 1.76 1.91 (as % of scheduled domestic departures) On-Time Arrival Rate 73.4 76.0 79.5 79.8 79.6 (% of domestic flights within 00:15) Involuntary Denied Boardings 1.12 1.11 1.19 1.09 0.81 (per 10,000 passengers) Mishandled Bags 7.05 5.26 3.91 3.57 3.39 (per 1,000 domestic passengers) Customer Complaints 1.38 1.13 0.97 1.20 1.18 (per 100,000 systemwide passengers) Sources: Bureau of Transportation Statistics and DOT Air Travel Consumer Report (http://airconsumer.dot.gov/reports/index.htm) 8 airlines.org
  • 7.
    Conditions for TravelDemand: A Tale of Two Customer Segments (Part 1) Overall U.S. Economic Growth and Corporate Profits Supporting Business Travel U.S. Gross Domestic Product U.S. Corporate Profits Trillions of Chained 2005 Dollars, SAAR Trillions of Current Dollars, SAAR $13.5 $2.1 $13.4 $1.9 $13.3 $13.2 $1.7 $13.1 $1.5 $13.0 $12.9 $1.3 $12.8 $1.1 $12.7 $12.6 $0.9 1Q11 1Q08 1Q09 1Q10 1Q12 1Q08 1Q09 1Q10 1Q12 1Q11 Source: BEA (http://www.bea.gov/national/index.htm#gdp) Source: BEA National Income and Product Accounts, Table 1.12 9 airlines.org
  • 8.
    Conditions for TravelDemand: A Tale of Two Customer Segments (Part 2) Declining U.S. Personal Income and Household Worth Crimping Leisure Demand U.S. Disposable Personal Income U.S. Household Net Worth Trillions of Chained 2005 Dollars, SAAR Trillions of Current Dollars, NSA $10.3 $64 $62 $10.2 $60 $10.1 $58 $10.0 $56 $54 $9.9 $52 $9.8 $50 1Q08 1Q09 1Q10 1Q12 1Q11 1Q10 1Q11 1Q08 1Q09 1Q12 Source: BEA National Income and Product Accounts, Table 2.1 Source: Federal Reserve Flow of Funds Account Z.1, B.100 10 airlines.org
  • 9.
    Jet Fuel atHighest Level Since May 2011 High Crude-Oil Price Plus Refining Crack Spread* $140 Jet Fuel $135 Price per Barrel (5-Day Avg.) $130 $125 Brent Crude $120 $115 $110 $105 WTI Crude $100 $95 $90 15-Dec- 25-Dec- 14-Jan- 24-Jan- 13-Feb- 23-Feb- 14-Mar- 24-Mar- 13-Apr- 23-Apr- 4-Jan-12 3-Feb-12 4-Mar-12 3-Apr-12 12 12 12 12 12 12 12 12 11 11 Source: A4A and EIA (for WTI and Brent crude oil and U.S. Gulf Coast jet fuel) * Refining margin (difference between jet-fuel and crude-oil price) 11 airlines.org
  • 10.
    Rising Costs ForcingAirlines to Continue Capacity Reductions in 2012 Year-Over-Year Change (%) in Scheduled Domestic Available Seat Miles (ASMs) 2.5 2.3 1.1 (0.4) (1.1) (1.6) 1Q11 2Q11 3Q11 4Q11 1Q12 2Q12 Source: Innovata (via Diio Mi) published schedules as of Feb. 24, 2012 12 airlines.org
  • 11.
    ExxonMobil AAA Microsoft AAA GE AA+ Wal-Mart AA Source: Standard and Poor’s Toyota AA- BP A eBay A Starbucks A- QANTAS BBB Lufthansa BBB- Southwest BBB- 13 Alaska BB- Allegiant BB- British Air BB- GOL BB- TAM B+ Only One U.S. Passenger Airline Has Investment-Grade Credit Delta B United B Air Canada B- JetBlue B- SAS B- US Airways B- < BBB- (speculative grade) >= BBB- (investment grade) American D airlines.org
  • 12.
    Improved Balance SheetsAllow Airlines to Preserve/Grow Jobs, Acquire New Aircraft U.S. Passenger Airlines Beginning to Hire Workers and Purchase Planes Airline Payrolls Stabilizing Aircraft Capital Spending on the Rise Full-Time Equivalent Employees (Thousands) Average Annual Estimated Aircraft/Engine CapEx (Billions) 532 $16.9 475 471 $9.7 $9.2 439 430 419 $6.6 411 $5.8 $5.8 $5.7 404 $4.8 $4.2 392 389 $3.4 Nov… 379 Nov… 379 Nov… Nov… Nov… Nov… Nov… Nov… Nov… Nov… Nov… Nov… 13F 12F 02 03 04 05 10 11 00-01 06-09 Source: BTS for U.S. scheduled passenger airlines Source: Bank of America Merrill Lynch airline equity research (Jan. 5, 2012) 14 airlines.org
  • 13.
    U.S. Passenger Airlines:Economic Review The Bottom Line in Early 2012 » Looking Back • Net profit margin fell from 1.6 percent in 2010 to 0.3 percent (prelim. per 11 carriers) in 2011 o Second year of modest profitability after recording an average margin of -6.3 percent in 2001-2009 o All but three U.S. airline stocks took a beating in 2011, especially relative to S&P 500 o Spot price of U.S. jet fuel hit all-time high in 2011; thus far (through Feb. 22), running 16 percent higher in 2012 • 2011 was a stellar year on many operational fronts o Second consecutive year of zero passenger fatalities o Best year ever recorded for baggage handling and denied boardings; best 4Q ever recorded for on-time arrivals o All-time high for U.S. exports of air-travel services ($36.7B) and for U.S. merchandise exported by air ($424.3B) » Looking Ahead • Fuel remains largest and most volatile cost – continuing threat to GDP and earnings • Airlines reacting to increasing (and volatile) marginal costs and uncertain revenues with conservative volumes, high utilization of existing assets, “variabilization” of cost structure, avoidance of costs incurred without sufficient revenues generated, product diversification • Major focus on debt reduction, fleet renewal and product enhancement • Improved financial wherewithal translating to uptick in employment and fleet upgrades • Increasing governmental/regulatory costs creating potential barrier to entry for start-ups 15 airlines.org
  • 14.