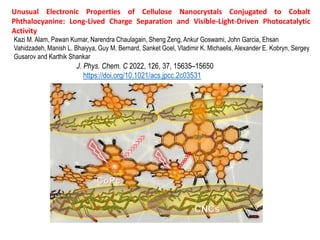
Unusual Electronic Properties of Cellulose Nanocrystals Conjugated to Cobalt Phthalocyanine: Long-Lived Charge Separation and Visible-Light-Driven Photocatalytic Activity

Octacarboxylated cobalt phthalocyanine (CoPc) was covalently conjugated to cellulose nanocrystals (CNCs) by employing an esterification protocol. Solid-state NMR, X-ray photoelectron spectroscopy (XPS), Raman, and infrared spectra were used to verify and study the nature of covalent attachment responsible for the immobilization of CoPc on the CNC surface. The covalent attachment was investigated from a theoretical simulation perspective using dispersion-corrected density functional theory (DFT) calculations, which verified the stable bond formation between CNC and CoPc. CoPc is an organic semiconductor with a high exciton binding energy, and CNCs are known to be insulating. Yet, Kelvin probe force microscopy (KPFM) indicated charge carrier generation and long-lived charge separation in the CNC–CoPc conjugate compared to pristine CoPc under visible light illumination. Such behavior is more typical of a semiconductor nanocomposite. The CNC–CoPc conjugate exhibited superior performance in the visible-light-driven surface photocatalytic reduction of 4-nitrobenzenethiol (4-NBT) to p,p′-dimercaptoazobenzene (DMAB) and photodegradation of rhodamine B.

Recommended
Recommended
More Related Content
Similar to Unusual Electronic Properties of Cellulose Nanocrystals Conjugated to Cobalt Phthalocyanine: Long-Lived Charge Separation and Visible-Light-Driven Photocatalytic Activity
Similar to Unusual Electronic Properties of Cellulose Nanocrystals Conjugated to Cobalt Phthalocyanine: Long-Lived Charge Separation and Visible-Light-Driven Photocatalytic Activity (20)
More from Pawan Kumar
More from Pawan Kumar (20)
Recently uploaded
Recently uploaded (20)
Unusual Electronic Properties of Cellulose Nanocrystals Conjugated to Cobalt Phthalocyanine: Long-Lived Charge Separation and Visible-Light-Driven Photocatalytic Activity
- 1. Unusual Electronic Properties of Cellulose Nanocrystals Conjugated to Cobalt Phthalocyanine: Long-Lived Charge Separation and Visible-Light-Driven Photocatalytic Activity J. Phys. Chem. C 2022, 126, 37, 15635–15650 https://doi.org/10.1021/acs.jpcc.2c03531 Kazi M. Alam, Pawan Kumar, Narendra Chaulagain, Sheng Zeng, Ankur Goswami, John Garcia, Ehsan Vahidzadeh, Manish L. Bhaiyya, Guy M. Bernard, Sanket Goel, Vladimir K. Michaelis, Alexander E. Kobryn, Sergey Gusarov and Karthik Shankar
- 2. Figure 1. High resolution X-ray photoelectron spectroscopy (HR-XPS) core-level spectra of anodized CoPc (a) in the C 1s region, (b) in the N 1s region, (c) in the O 1s region, and (d) in the Co 2p region.
- 3. Figure 2. HR-XPS core-level spectra of (a) CNCs in the C 1s region, (b) CNC−CoPc in the C 1s region, (c) CNC in the O 1s region, (d) CNC− CoPc in the O 1s region, (e) CNC−CoPc in the Co 2p region, and (f) CNC−CoPc in the N 1s region.
- 4. Figure 3. (a) TEM image of an agglomeration of CoPc-conjugated CNCs. (b) HRTEM image of CNC−CoPc. (c), (d) Selected magnified regions of (b) showing lattice planes of CoPc attached on the CNC surface. (e) Dark-field STEM-EDX image of a cluster of CoPc-conjugated CNCs. STEM-EDX elemental mapping images for (f) C, (g) O, (h) S, (i) Co, and (j) N.
- 5. Figure 4. (a) UV−vis spectra of CoPc and CNC−CoPc. (b) Soret band emission spectra of CoPc and CNC−CoPc at 340 nm excitation wavelength. All of the absorption and photoluminescence data were collected in DMF. Kelvin probe force microscopy (KPFM) surface potential distribution in the dark and under illumination conditions (LED 635 nm) for (c) pristine CoPc and (d) CNC−CoPc.
- 6. Figure 5. Surface catalytic conversion of 4- nitrobenzenethiol (4-NBT) to p,p′-dimercaptoazobenzene (DMAB) monitored by Raman spectroscopy. (a) Performance comparison for Ag nanoparticles and CoPc−Ag and CNC−CoPc−Ag systems at 1 mW laser power. Laser power- dependent spectral evolution of the reactant (4-NBT) and product (DMAB) for different systems: (b) Ag nanoparticles, (c) CoPc−Ag, and (d) CNC− CoPc−Ag. Raman spectra were accumulated for 5 × 15 s exposure time in air at room temperature (excitation wavelength 532 nm).
- 7. Figure 6. Spatial distributions of molecular orbitals for (a) pristine CoPc and (b)−(e) CNC−CoPc conjugated systems. Metallophthalocyanine rings oriented vertically to the CNC surface for (b) hydrophilic plane (11̅0) and (c) hydrophobic plane (200). Metallophthalocyanine rings oriented horizontally to the CNC surface for (d) hydrophilic plane (11̅0) and (e) hydrophobic plane (200). HOMO and LUMO orbitals are represented by red and blue surfaces, respectively. The colors for C, O, H, S, N, and Co atoms are cyan, orange, white, yellow, gray, and brown, respectively
- 9. Figure S2. XPS elemental survey scan of CoPc (black), CNC (blue) and CNC-CoPc (red) and HRXPS spectra of (b) CNC in N1s region, (c) CNCs in S2p region and (d) CNC-CoPc in S2p region.
- 12. Figure S5. Excitation dependent Soret band emission spectra of (a) CoPc and (b) CNC-CoPc respectively. All the photoluminescence data were collected in DMF.
- 13. Figure S6. Surface topographic AFM (a) height and (b) phase images of CNC-CoPc on FTO.
- 14. Figure S7. Cyclic voltammogram of (a) bare octacarboxylated CoPc and (b) CNC-CoPc in aqueous solvent.
- 15. Figure S8. (a) FESEM image of a sub- monolayer Ag nanoparticles on CNC-CoPc film. (b) FESEM image of a sub-monolayer Ag nanoparticles on CoPc film. (c) HRTEM image of Ag nanoparticle. (d) Selected magnified region of (c) showing lattice plane (1 1 1) of Ag. (e) Bright field STEM-EDX image of a small cluster of Ag nanoparticles. STEM-EDX elemental mapping for (f) silver and (h) oxygen. (g) X-ray diffractograms of the lab- grown Ag nanoparticles drop-cast on glass.
- 16. Figure S9. Photocatalytic performance test by a RhB degradation experiment for bare octacarboxylated CoPc and CNC-CoPc conjugated systems under AM1.5G one-sun simulated sunlight. (a) Bare CoPc without any added scavenger and CNC-CoPc conjugate without and with added scavenger. (b) CNC-CoPc conjugate without any scavenger under continuous dark and under partial dark and AM1.5G one-sun simulated sunlight. The inset of (b) is showing the two possible photocatalytic pathways, namely chromophore cleavage (cycloreversion) and Ndeethylation
- 17. Figure S10. UV-Vis absorption spectra in RhB degradation experiment for bare octacarboxylated CoPc and CNC- CoPc conjugated systems under AM1.5G one-sun simulated sunlight. (a) Bare CoPc without any added scavenger. (b) & (c) CNC-CoPc conjugate without any scavenger under continuous dark and under partial dark and AM1.5G one-sun simulated sunlight respectively. (d) & (e) CNC-CoPc conjugate with AgNO3 and EDTA scavengers respectively.
- 18. Figure S11. Photocatalytic performance test by a RhB degradation experiment for two different amounts of bare octacarboxylated CoPc under AM1.5G one-sun simulated sunlight.
- 19. Figure S12. Steady state photoluminescence spectra of bare RhB (pink), bare CoPc emerged in aqueous RhB solution (brown) and CNC-CoPc conjugate emerged in aqueous RhB solution (cyan). The excitation wavelength was 470 nm.
- 20. Figure S13. CNC-segment considered for large scale molecular dynamics simulation; (a) Schematic perspective view, (b) top view, (c) side view, and (d) cross-sectional view of the generated structure. The hydrophilic and hydrophobic planes (110) and (200) respectively, were taken from the optimized structure for further quantum chemical calculations using DFT. C, O and H atoms are in grey, red and white colours respectively. The green arrow is along CNC axis (zdirection).
- 21. Figure S14. Projected density of states (PDOS) of atoms involved in covalent bond formation between CoPc (C) and CNC (O). Metallophthalocyanine rings orient vertical to the CNC surface, (a) hydrophilic plane (110) and (b) hydrophobic plane (200). Metallophthalocyanine rings orient horizontal to the CNC surface, (c) hydrophilic plane (110) and (b) hydrophobic plane (200).
- 22. Figure S15. Isosurfaces of electron density difference for CNC-CoPc. Metallophthalocyanine rings orient vertically to the CNC surface, (a) hydrophilic plane (110) and (b) hydrophobic plane (200). Metallophthalocyanine rings orient horizontal to the CNC surface, (c) hydrophilic plane (110) and (b) hydrophobic plane (200). The pink and tan colored surfaces represent charge depletion and accumulation regions respectively. The isosurface value is set to 0.01 eV Å -3. The colors for C, O, H, S, N and Co atoms are cyan, orange, white, yellow, gray and green respectively.
- 23. Figure S16. Total density of states (DOS) and density of states projected on Co atom (d-orbital only) for (a) pristine CoPc and (b)-(e) CNC-CoPc conjugated systems. Metallophthalocyanine rings oriented vertically to the CNC surface, for the (b) hydrophilic plane (110) and (c) hydrophobic plane (200). Metallophthalocyanine rings oriented horizontally to the CNC surface, for the (d) hydrophilic plane (110) and (e) hydrophobic plane (200).