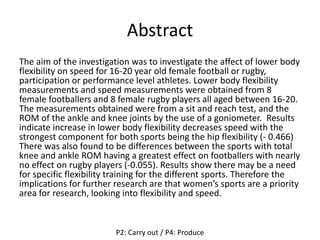
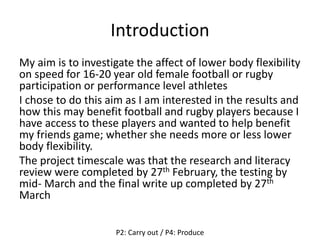
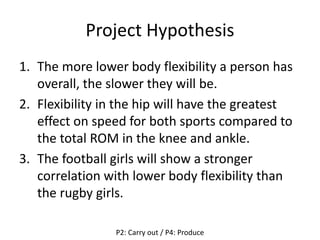
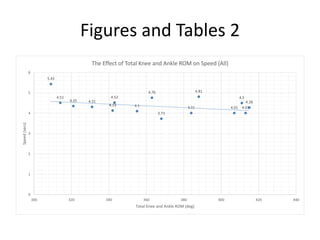
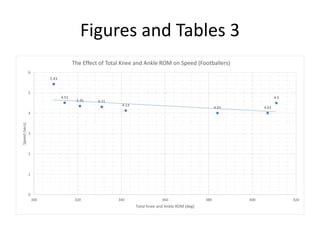
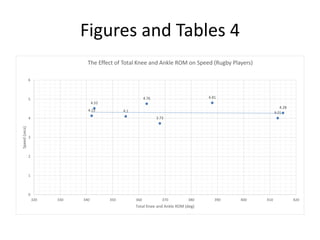
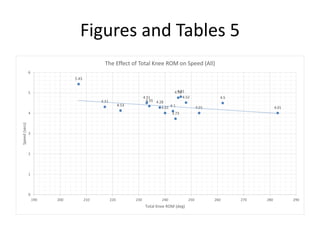
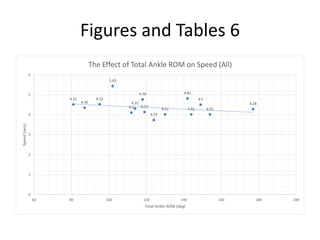
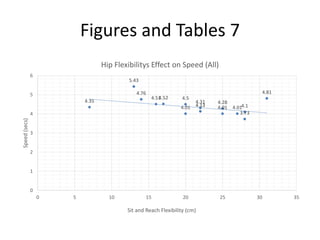
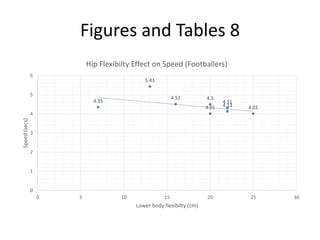
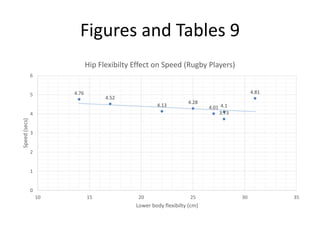
1. Unit 5 Research Project
referral 2
Worthing College Sports Science
Georgia Short
2015
2. Assessment Criteria
Pages 3-17 & 27-38
ā¢ P2: carry out sport science or exercise science-
based research
ā¢ P3: collect and record data from the research
project conducted
ā¢ M2: correctly analyse collected data, describing
techniques used
ā¢ D1: correctly analyse data, explaining techniques
used
ā¢ P4: produce a full research report using a
standard scientific structure
3. To investigate the affect of lower
body flexibility on speed for 16-20
year old female football or rugby,
participation or performance level
athletes
P2: Carry out / P4: Produce
4. Abstract
The aim of the investigation was to investigate the affect of lower body
flexibility on speed for 16-20 year old female football or rugby,
participation or performance level athletes. Lower body flexibility
measurements and speed measurements were obtained from 8
female footballers and 8 female rugby players all aged between 16-20.
The measurements obtained were from a sit and reach test, and the
ROM of the ankle and knee joints by the use of a goniometer. Results
indicate increase in lower body flexibility decreases speed with the
strongest component for both sports being the hip flexibility (- 0.466)
There was also found to be differences between the sports with total
knee and ankle ROM having a greatest effect on footballers with nearly
no effect on rugby players (-0.055). Results show there may be a need
for specific flexibility training for the different sports. Therefore the
implications for further research are that womenās sports are a priority
area for research, looking into flexibility and speed.
P2: Carry out / P4: Produce
6. Contents: Appendices
Page 27- Appendix Title Page
Page 28- Appendix 1 (standardised instructions general)
Page 29- Appendix 2 (standardised instructions
goniometer test)
Page 30- Appendix 3 (standardised instructions sit and
reach test)
Page 31- Appendix 4 (standardised instructions flying
30 metre sprint)
P2: Carry out / P4: Produce
7. Contents: Figures and Tables
Page 32- Figures and Tables
Page 33- Figures and Tables 1 (chart of all data)
Page 34- Figures and Tables 2 (The Effect of Total Knee and Ankle ROM on Speed (All))
Page 35- Figures and Tables 3 (The Effect of Total Knee and Ankle ROM on Speed
(Footballers))
Page 36- Figures and Tables 4 (The Effect of Total Knee and Ankle ROM on Speed (Rugby
Players))
Page 37- Figures and Tables 5 (The Effect of Total Knee ROM on Speed (All))
Page 38- Figures and Tables 6 (The Effect of Total Ankle ROM on Speed (All))
Page 39- Figures and Tables 7 (Lower Body Flexibility Effect on Speed (All))
Page 40- Figures and Tables 8 (Lower Body Flexibility Effect on Speed (Footballers))
Page 41- Figures and Tables 9 (Lower Body Flexibility Effect on Speed (Rugby Players))
P2: Carry out / P4: Produce
8. Acknowledgements
I would like to thank my participants for taking
part in the research. I would also like to thank
Brooke Marshall and Phoebe Thorpe for
assisting me in collecting my data. This project
would not have been possible with out them.
P2: Carry out / P4: Produce
9. Introduction
My aim is to investigate the affect of lower body flexibility
on speed for 16-20 year old female football or rugby
participation or performance level athletes
I chose to do this aim as I am interested in the results and
how this may benefit football and rugby players because I
have access to these players and wanted to help benefit
my friends game; whether she needs more or less lower
body flexibility.
The project timescale was that the research and literacy
review were completed by 27th February, the testing by
mid- March and the final write up completed by 27th
March
P2: Carry out / P4: Produce
10. Literature Review and References
My literacy review can be found here
P2: Carry out / P4: Produce
11. Project Hypothesis
1. The more lower body flexibility a person has
overall, the slower they will be.
2. Flexibility in the hip will have the greatest
effect on speed for both sports compared to
the total ROM in the knee and ankle.
3. The football girls will show a stronger
correlation with lower body flexibility than
the rugby girls.
P2: Carry out / P4: Produce
12. Method
ā¢ I will be using opportunity sampling to recruit my participants for my research; this will be 8 female
footballers and 8 female rugby players, all aged between 16-20 and of participation or performance
level.
ā¢ I will not be getting my participants to take a PARQ test before carrying out two kinds of flexibility
tests and a speed test; this is because they are all currently training/playing and therefore it can be
assumed they are fit and healthy for testing.
ā¢ I will read a set of standardized instructions to the participants so they are clear as to what Iām
measuring and how they are to conduct the test (see appendix 1)
ā¢ My first flexibility test will be measuring the flexibility at the ankle and then the knee by using a
goniometer. This will measure the difference between full extension and full flexion at the joints.
The goniometer standardized instructions will be read to the athlete (see appendix 2)
ā¢ The other flexibility test will be a sit and reach test which will determine flexibility at the hips, this
is a maximal test and therefore will be conducted three times and the best score taken. (see
appendix 3)
ā¢ I will then also be carrying out a simple sprint test; standing start, over 30 meters. This will be
completed three times, and the average score taken. (see appendix 4)
ā¢ I will then put all data into excel and by creating a range of graphs in order to make comparisons.
ā¢ The initial testing of all tests will be completed and typed up by the 13th of March. The graphs and
comparisons will be made by the 18th of march.
ā¢ My write up will be completed by the 27th of March.
P3: Collect and record / M2: Correctly analyse & describe techniques / D1: Correctly analyse & explain techniques
13. Data Collection
I will be collecting primary data, firstly, by myself or my
assistant conducting laboratory based experiments and
collecting the flexibility tests; recording the results on paper.
We will then conduct field based experiments to record the
best speed from three tests of each of these participants over
a 30m sprint from standing start. The sprint data I collect will
be continuous and will be recorded to two decimal places. We
take the best because the sprint test is a maximal test. As this
is all numerical data, it is quantitative and easy to make
comparisons. I will later collate my data within excel
spreadsheet. I am collecting comparative and nominal data as
I will be comparing the two groups of footballers and rugby
players. All my data collated together overall will be ordinal.
P3: Collect and record / M2: Correctly analyse & describe techniques / D1: Correctly analyse & explain techniques
14. Data Analysis
By using the best speed score from 3 attempts
(because the sprint test is a maximal test) I will
firstly compare this to the flexibility scores as a
whole. By collating the data into an excel spread
sheet and creating a scatter graph I will conduct a
line of best fit. Then I will compare each component
of flexibility separately and I will be looking to see
which component lower body flexibility has the
greatest effect on speed. Finally I will use the
scatter graph to compare the flexibility and speed
to see if there is a difference between rugby and
football players.
P3: Collect and record / M2: Correctly analyse & describe techniques / D1: Correctly analyse & explain techniques
15. Results
All results have been typed up and can be viewed as a chart. (See figure and table 1). After creating
graphs for each of my objectives to give a visual view and then have calculated the line of regression for
each of my objectives. The line of regression models the relationship between the x and y variables, this
shows how far the points are from the trend line (line of best fit). This allows me to compare each
component to see the relationship it has with speed. A perfect correlation would give a score of +/- 1, a
strong score of +/- 0.8/0.9, medium around +/- 0.4-0.7 , weak from +/- 0.1-0.3. A score of 0 is no
correction whatsoever.
LINE OF REGRESSION SCORES
The Effect of Total Knee and Ankle ROM on Speed (All) -0.375 (See figure and table 2)
The Effect of Total Knee and Ankle ROM on Speed (Footballers) -0.523 (See figure and table 3)
The Effect of Total Knee and Ankle ROM on Speed (Rugby Players) -0.055 (See figure and table 4)
The Effect of Total Knee ROM on Speed (All) -0.368 (See figure and table 5)
The Effect of Total Ankle ROM on Speed (All) -0.273(See figure and table 6)
Hip Flexibility Effect on Speed (All) -0.466 (See figure and table 7)
Hip Flexibility Effect on Speed (Footballers) -0.511 (See figure and table 8)
Hip Flexibility Effect on Speed (Rugby Players) -0.397 (See figure and table 9)
P3: Collect and record / M2: Correctly analyse & describe techniques / D1: Correctly analyse & explain techniques
16. Discussion
All results gained were negative, this shows that all components have an effect on speed, the greater
the flexibility an athlete has cause a decrease in speed of the athlete, although some components have
a much stronger regression line than others. This wasnāt expected after carrying out research and
completing my literacy review. I was expecting positive correlations between all components of
flexibility and speed.
The results indicate that total knee and ankle flexibility has the greatest effect on footballers speed.
There was a medium negative correlation of -0.523 between the two. The more flexible the football
player is the faster they are. However total knee and ankle flexibility had the least correlation between
all aspects on the rugby players showing near to no correlation at all, -0.055. This shows there are
significant differences between the sports.
The sit and reach test, measuring flexibility in the hip shows a medium negative correlation against
speed. Again there are differences between the two sports however there is less of a difference. The
Rugby players showed a weak negative correlation, this indicates that hip flexibility has a greater effect
on their speed than total knee and ankle ROM.
The component of flexibility that had the greatest effect on speed for both rugby and footballers was
the lower body component which was what I expected to find. However it only had the greatest effect
on rugby players when looking at the sports separately.
P2: Carry out / P4: Produce
17. Conclusion
My aim was to investigate the affect of lower body flexibility on speed for 16-
20 year old female football or rugby, participation or performance level
athletes. From looking at my literacy review I was expecting to find that the
more flexible the athletes lower body was the slower they would be. However
I found a negative correlation between flexibility and speed meaning that the
more flexible the athlete was the faster they were, which is the opposite of
what I found in the literacy review. The literacy review supports my
hypothesis however my testing does not.
My results support my second hypothesis as a general however when broken
down to separate sports only supports the rugby players. It also has shown
the hip flexibility has the strongest correlation on speed in general.
Because my third hypothesis is non-directional towards which way the
correlation will be strongest; my hypothesis is therefore supported by my
results; total ROM for knee and ankle had a much greater difference than
lower body flexibility even though both were stronger for footballers than
rugby players.
P2: Carry out / P4: Produce
18. Assessment Criteria Pages 19-26
ā¢ P5: carry out a review of the research project
conducted, describing strengths, areas for
improvement and future recommendations.
ā¢ M3: carry out a review of the research project,
explaining strengths, areas for improvement
and future recommendations.
ā¢ D2: carry out a review of the research project,
justifying future recommendations for further
research.
19. Review (1/3)
I think that the project conclusions met the project aim quite well. I was able
to gain results for all my hypotheses and my objectives even if they were not
what I was expecting.
My first objective was to find the body component which had the greatest
effect on speed and this was the lower body flexibility; obtained by from the
sit and reach test. (-0.466)
My second objective was to see the effect total lower body flexibility had,
there was a -0.375 for total knee and ankle ROM which was a weak
correlation, showing a slight relationship with speed.
The third objective was to see if there was a difference between rugby and
football players. I found more than one difference after conducting the tests.
Flexibility of the ankle and the knee has a much stronger correlation to
footballers (-0.523) then to rugby players , who have almost no correlation(-
0.055). There was also slight differences between lower body flexibility and
speed between the sports however this was less significant.
P5: Describe / M3: Explain / D2: Justify
20. Review (2/3)
The strengths of the research project were that I made sure
the ROM tests in the ankle and knee were conducted in the
same manner. There was various ways to conduct these test
but to make sure I got the most accurate results I made sure
all the athletes were given a set of standardized instructions
(see appendix 2)
Another strength of the research project was that the sit and
reach test was conducted three times and because it was a
maximal test the highest score was taken.
I think that the whole research project is both valid and
reliable. It is valid because I was able to measure what I set
out to and reliable as I believe with the method and
standardized instructions would easily be followed to gain the
same results.
P5: Describe / M3: Explain / D2: Justify
21. Review (3/3)
One area of improvement for this research project would be to break
down the flexibility tests more to see if there are specific muscles
which have the greatest effect. This would allow more research into
each area.
I would also make sure that the sprint test was carried out three times
as it is maximal test and I didnāt have enough time to do this. I took
the tests before training sessions and therefore was on a time limit.
The goniometer tests took a long time and therefore the sprint test
were only conducted once.
I would also use a flying sprint test as I donāt think 30 metres was long
enough to get an accurate measure of the athletes true maximum
speed.
I would monitor the warm up more accurately as the footballers went
about the warm up in a different way to the rugby girls. This would
improve the reliability of the research in the future.
P5: Describe / M3: Explain / D2: Justify
22. Future Recommendations (1/8)
If the project was to be completed again I would use more participants, I think
that 16 participants was okay as this was a primary study. It allowed me to
look for significance without wasting too much time or money however as
there was trends found it should be repeated on a wider scale. The further
research would allow the researchers to conduct more tests to see if there
are any stronger relationships between certain aspects of lower body
flexibility and speed.
I would look into the different positions the participants play and see whether
this effects the type and amount of flexibility or speed required. Although my
research was sport specific, certain positions on each team require the
athletes to utilize different skills; the goal keeper for example needs flexibility,
however doesnāt need to move round the pitch to make attacks.
This would benefit the research as it would make it more representative to
the population as there would be a wider range of ethnicity's and races
looked at. It would benefit sports as a whole as the research may indicate
that certain races of people may be more suited towards different sports,
they could then focus on these areas of sports from a younger age.
P4: Produce / P5: Describe / M3: Explain / D2: Justify
23. Future Recommendations (2/8)
The benefits of the proposed changes would make the research more accurate. The more participants
there are the more representative of the population, gender, ethnicity and age can all effect the results
and the more participants the research has the more true the statistical analysis is. By having more
results you would be able to see if there is an optimum lower body flexibility level; the graph may
plateau at a certain number. However there may also be results that indicate that after the optimum
level, athletes speed starts to increase again and flexibility has the opposite effect.
Although my research was sport specific, certain positions on each team require the athletes to play
using different skills; the goal keeper for example needs flexibility, however doesnāt need to move round
the pitch to make attacks. This would allow the researchers to compare the ROM needed for certain
positions and may lead to different position sessions, highly specific and focus sessions being conducted
within a sport.
By looking into certain positions this would benefit the players and coaches as they could know more
specifically what area of flexibility to focus on for the different sports and positions. It would benefit
them by allowing specific training plans for the type of sport and position played to be more specific.
With the research the managers could use it when making squad selections team selections by looking
at the flexibility the athletes already have, and then know what role they are more suited to.
P4: Produce / P5: Describe / M3: Explain / D2: Justify
24. Future Recommendations (3/8)
A future recommendation would be to conduct the research on boys.
By carrying out the research with the same variables would enable
researchers to identify the differences between aspiring male and
female athletes. The control variable would have to be kept the same
this includes the same population; athletes of participation/performer
level, rugby/footballers and of age 16-20, the same variables and the
same measures. This would allow researchers to see if there are any
specific gender differences. It could show how flexibility affects the
different genders in different ways and lead to different training
sessions being planner for the different genders.
By looking in to gender differences this would benefit players and
coaches. If results showed clear differences between the genders then
they would be able to create specific training programs which were
aimed at the different genders
P4: Produce / P5: Describe / M3: Explain / D2: Justify
25. Future Recommendations (4/8)
Another future recommendation that would benefit the research
would be looking into a wider variation of sports. This would allow
researchers to compare
track, racket and aesthetic sports instead of just field based contact
sports. There may be patterns within sports that would be interesting
to look at and show trainers how much flexibility training young
aspiring athletes should be taking part in.
This research may also lead to flexibility tests of a young age to see
what sport what be most suitable to the athletes.
By looking at how flexibility affects speed in different sports, and
whether it is an important factor would benefit a wide range athletes.
They would be able to see whether they require certain lower body
flexibility and how much it affects their sport. They could start training
certain aspects of flexibility from a younger age, or even cut flexibility
aspects of training completely.
P4: Produce / P5: Describe / M3: Explain / D2: Justify
26. Future Recommendations (5/8)
My final future recommendation for this project would be to look at a
range of age group variations. As people age, the tissue around joints
tends to thicken, this can decrease the joint's range of motion; even
though speed increases as we age. It would be interesting to look to
see if there is an optimum age where flexibility has a positive effect on
the speed of an athlete and whether the causes a decrease.
This would benefit a wider range of ages and may show that there are
optimal levels of flexibility depending on age. This would indicate what
age in the athletes training they need to focus more specifically on
flexibility and when they can concentrate less on it and more on other
factors. The players would benefit from the knowledge and the
coaches would benefit when planning their session looking to improve
there athletes performance, increasing chances of winning.
The athletes at a young age would benefit by knowing whether
flexibility is an important factor as often for more aggressive sports it
gets forgotten about.
P4: Produce / P5: Describe / M3: Explain / D2: Justify
27. Future Recommendations (6/8)
Another future recommendation would be to
looked at the other joints and if flexibility in them
would affect speed. This would allow researchers to
identify whether speed is specifically affected to
lower body flexibility or flexibility as a whole. This
would benefit athletes by indicating what aspect of
flexibility they need to train. The players would
benefit from the knowledge and the coaches would
benefit when planning their session looking to
improve there athletes performance, increasing
chances of winning.
28. Future Recommendations (7/8)
ā¢ I would recommend using more specialised equipment
when conducting this research again. I would also make
sure that more readings were taken so that the results
were more accurate and reliable. By having specialised
equipment the results will be more precise, this would
benefit the researchers as it would mean that there
research was more valid and would have less gaps, making
it more likely to be validated by peer review. This would
allow the coaches to create training programs knowing that
the research is correct and that training/not training
flexibility was beneficial to the athletes. This would also
allow other researchers to carry out investigations into the
area knowing that previous results were valid and reliable.
29. Future Recommendations (8/8)
ā¢ When carrying out the research in the future a further
recommendation would be to use an alternative method of data
analysis. I would suggest using the line of regression as well as or
alternatively using Spearman's rank correlation. This would benefit
the research as it gives another set of results that can be compared,
as it is a more precise and accurate method of analysis. When
making judgements of the significance that lower body flexibility
has on speed, the results would be more accurate and therefore
valued. By using a nonparametric test the advantage is that, in this
instance, no assumption has been made about the likely
distribution of results. This could cause an increase in strength of
the research and is a benefit for the researcher. This would also
benefit the coaches as they can see the significance and know
whether to increase specific flexibility training or not.
31. Appendix 1
ā¢ Standardised instructions:
ā¢ I will be conducting 3 different tests on you today.
The first will be goniometer tests, this is on both
knees and ankles, and will measure the range of
movement (ROM) in the joints. The second will
be a sit and reach test, this is to measure your
lower body flexibility. The third is a 30metre
sprint. Before conducting the tests you will need
to complete a short warm up, this is to prevent
injury.
32. Appendix 2
Standardised Instructions: Goniometer Tests
The goniometer test will be conducted on both knees and
ankles. It requires measuring full extension and full
flection at the joints. I will firstly require you to stand up
straight, with feet flat on the floor, this will allow me to
measure full extension at the knees. I will then require
you to lay on your front and kick your knees back as far as
possible, this will allow me to record your full flection. For
the ankles you will sit flat on the ground, removing shoes
as they restrict the movement, you will then point your
toes, I will measure the full extension of both ankles.
Then you pull your toes back towards your body and
hold, this will allow me to measure full flection.
33. Appendix 3
Standardised Instructions: Sit and Reach
You need to sit with your legs fully extended on
the ground and your feet placed flat against the
edge of the sit and reach box. Place both hands
together and slowly stretch over and slide your
hands along the top of the box. My assistant or I
will record your score. Complete this three
times.
34. Appendix 4
Standardised Instructions: 30m standing start sprint
test
You will stand at the first cone and be given the
commands on your marks, get set, go. On the
command go, the assistant will start the stopwatch
simultaneously as you sprint to the cone on the
other side. You will then get a 1 minute rest before
completing the test again. You will complete the
sprint test a total of three times and your fastest
score will be taken.
37. Figures and Tables 2
4.01
4.5
5.43
4.51
4.31
4.01
4.13
4.35 4.28
4.81
4.01
4.52
4.1
3.73
4.76
4.13
0
1
2
3
4
5
6
300 320 340 360 380 400 420 440
Speed(secs)
Total Knee and Ankle ROM (deg)
The Effect of Total Knee and Ankle ROM on Speed (All)
38. Figures and Tables 3
4.01
4.5
5.43
4.51
4.31
4.01
4.13
4.35
0
1
2
3
4
5
6
300 320 340 360 380 400 420
Speed(secs)
Total Knee and Ankle ROM (deg)
The Effect of Total Knee and Ankle ROM on Speed (Footballers)
39. Figures and Tables 4
4.28
4.81
4.01
4.52
4.1
3.73
4.76
4.13
0
1
2
3
4
5
6
320 330 340 350 360 370 380 390 400 410 420
Speed(secs)
Total Knee and Ankle ROM (deg)
The Effect of Total Knee and Ankle ROM on Speed (Rugby Players)
40. Figures and Tables 5
4.01
4.5
5.43
4.51
4.31
4.01
4.13
4.35 4.28
4.81
4.01
4.52
4.1
3.73
4.76
4.13
0
1
2
3
4
5
6
190 200 210 220 230 240 250 260 270 280 290
Speed(secs)
Total Knee ROM (deg)
The Effect of Total Knee ROM on Speed (All)
41. Figures and Tables 6
4.01
4.5
5.43
4.51
4.31
4.01
4.13
4.35 4.28
4.81
4.01
4.52
4.1
3.73
4.76
4.13
0
1
2
3
4
5
6
60 80 100 120 140 160 180 200
Speed(secs)
Total Ankle ROM (deg)
The Effect of Total Ankle ROM on Speed (All)
42. Figures and Tables 7
4.01
4.5
5.43
4.51
4.31
4.014.13
4.35 4.28
4.81
4.01
4.52
4.1
3.73
4.76
4.13
0
1
2
3
4
5
6
0 5 10 15 20 25 30 35
Speed(secs)
Sit and Reach Flexibility (cm)
Hip Flexibilitys Effect on Speed (All)
43. Figures and Tables 8
4.01
4.5
5.43
4.51
4.31
4.014.13
4.35
0
1
2
3
4
5
6
0 5 10 15 20 25 30
Speed(secs)
Lower body flexibilty (cm)
Hip Flexibilty Effect on Speed (Footballers)
44. Figures and Tables 9
4.28
4.81
4.01
4.52
4.1
3.73
4.76
4.13
0
1
2
3
4
5
6
10 15 20 25 30 35
Speed(secs)
Lower body flexibilty (cm)
Hip Flexibilty Effect on Speed (Rugby Players)