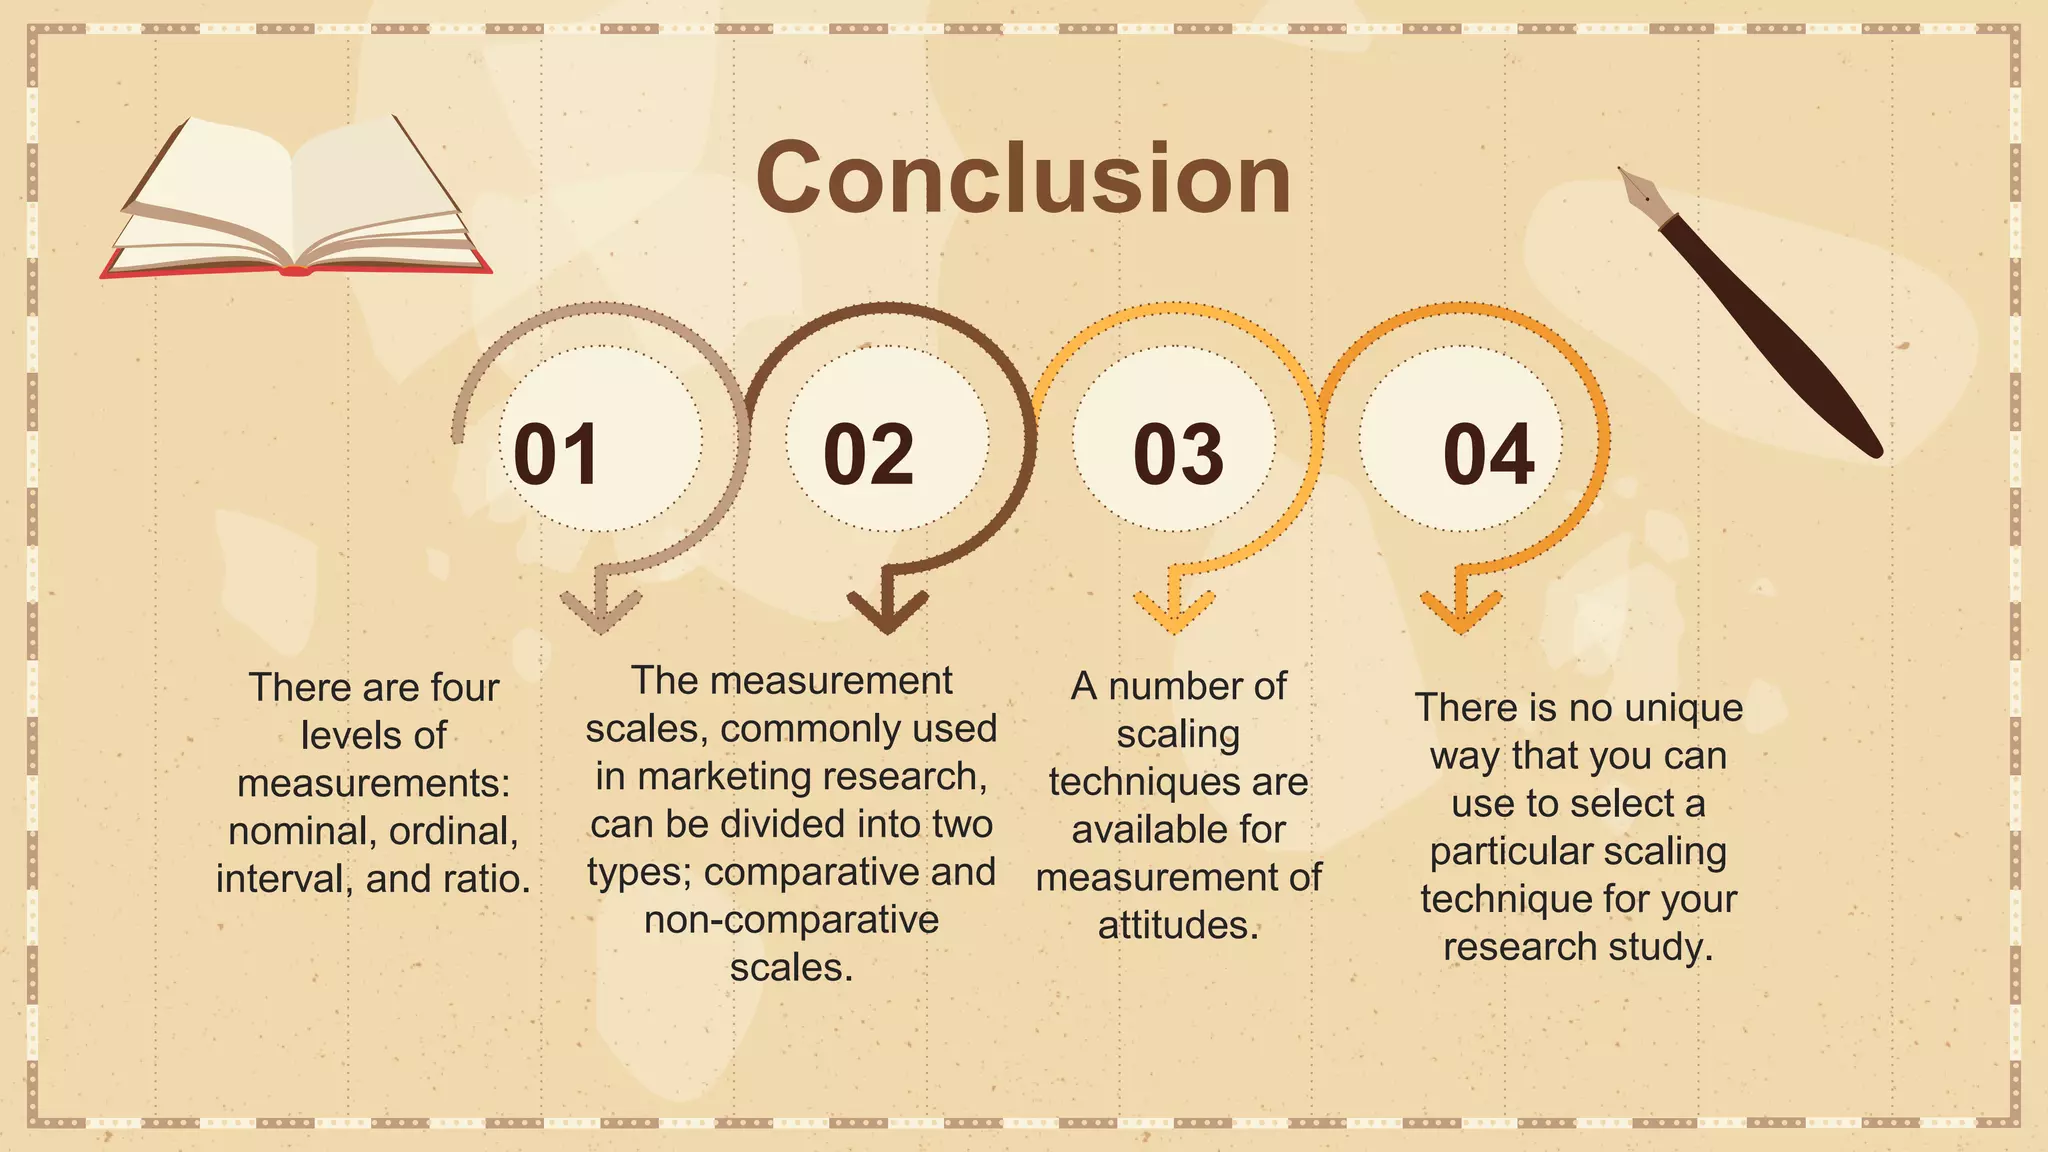
This document discusses various attitude scaling techniques used in business research. It covers:
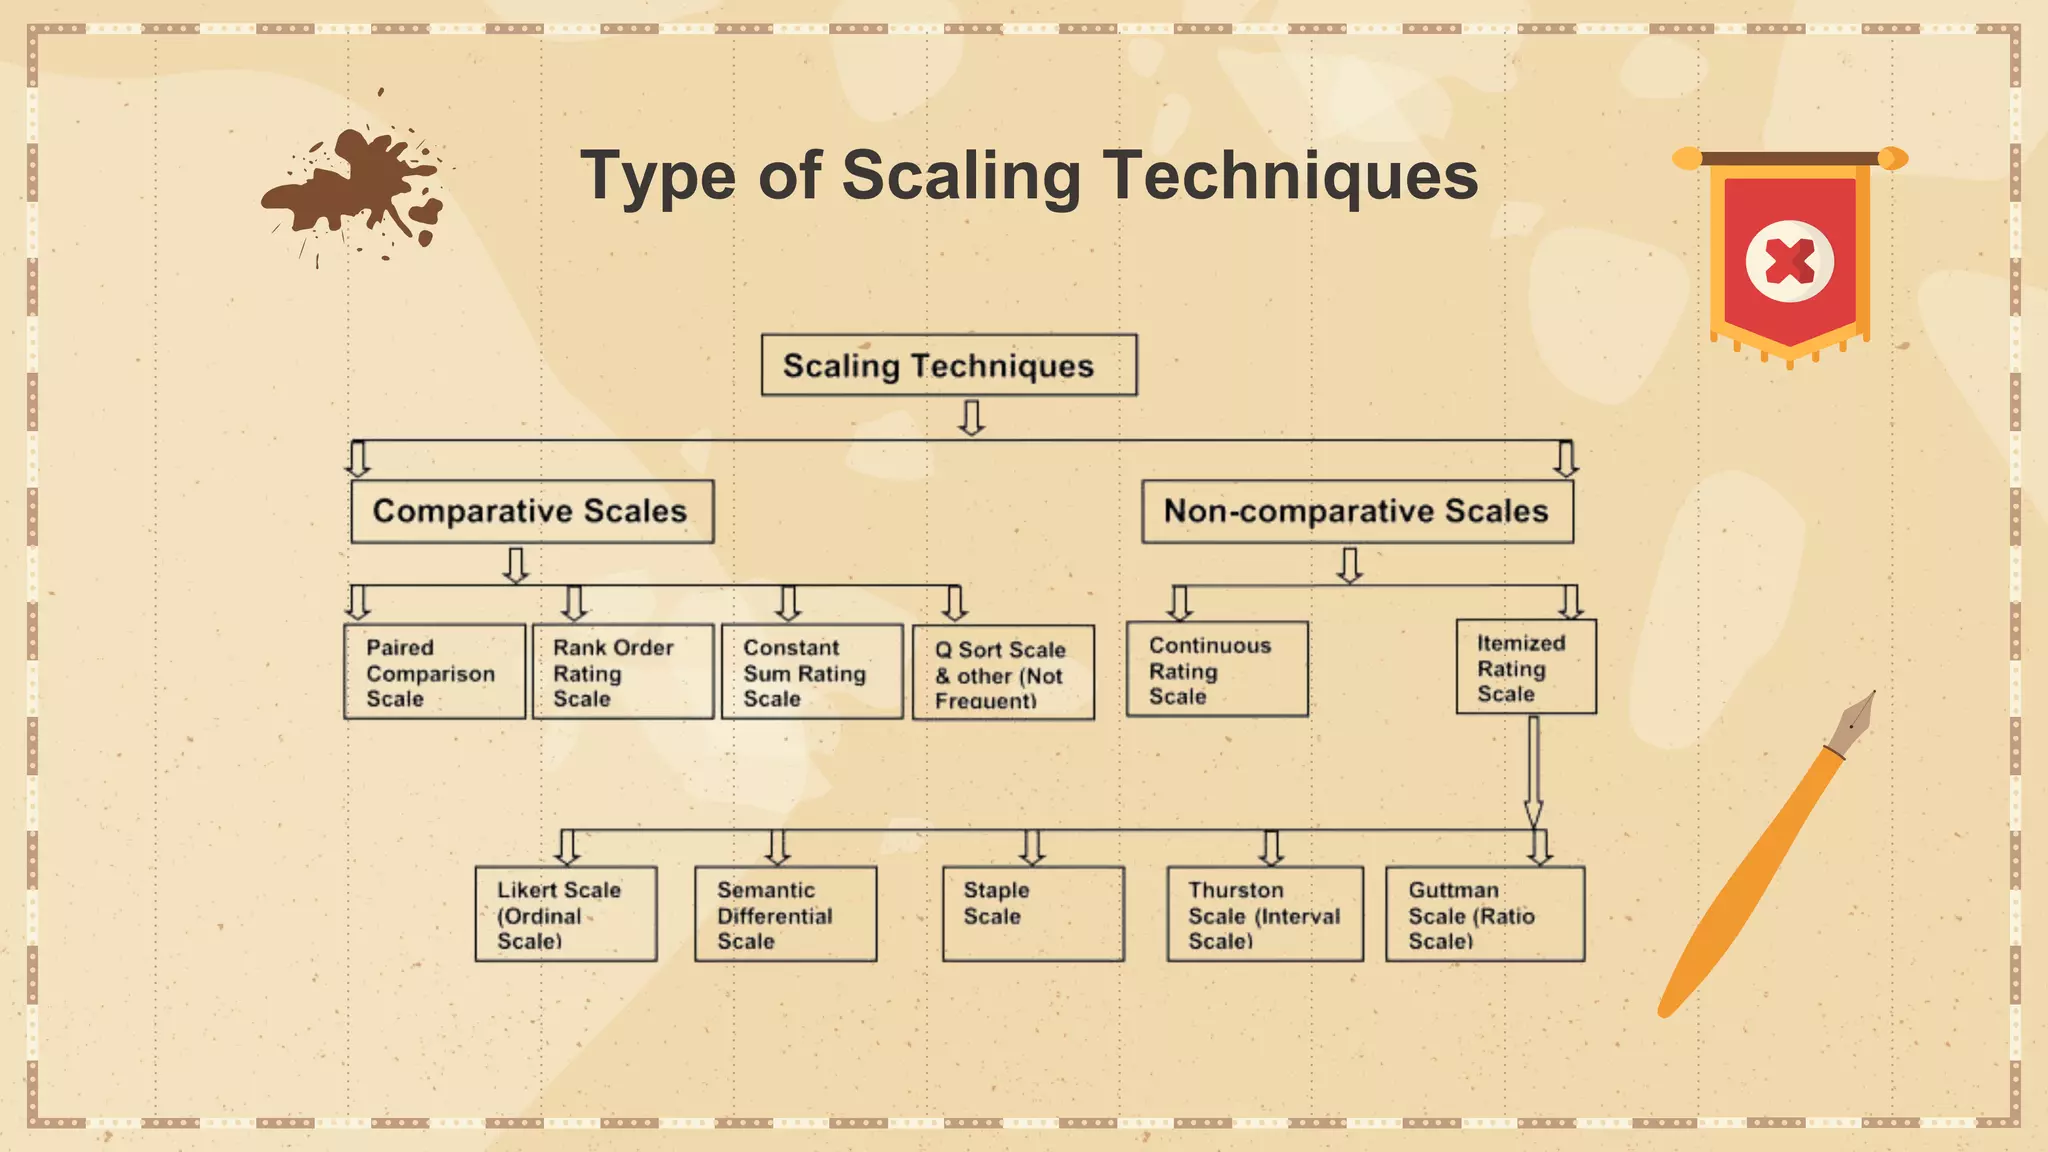
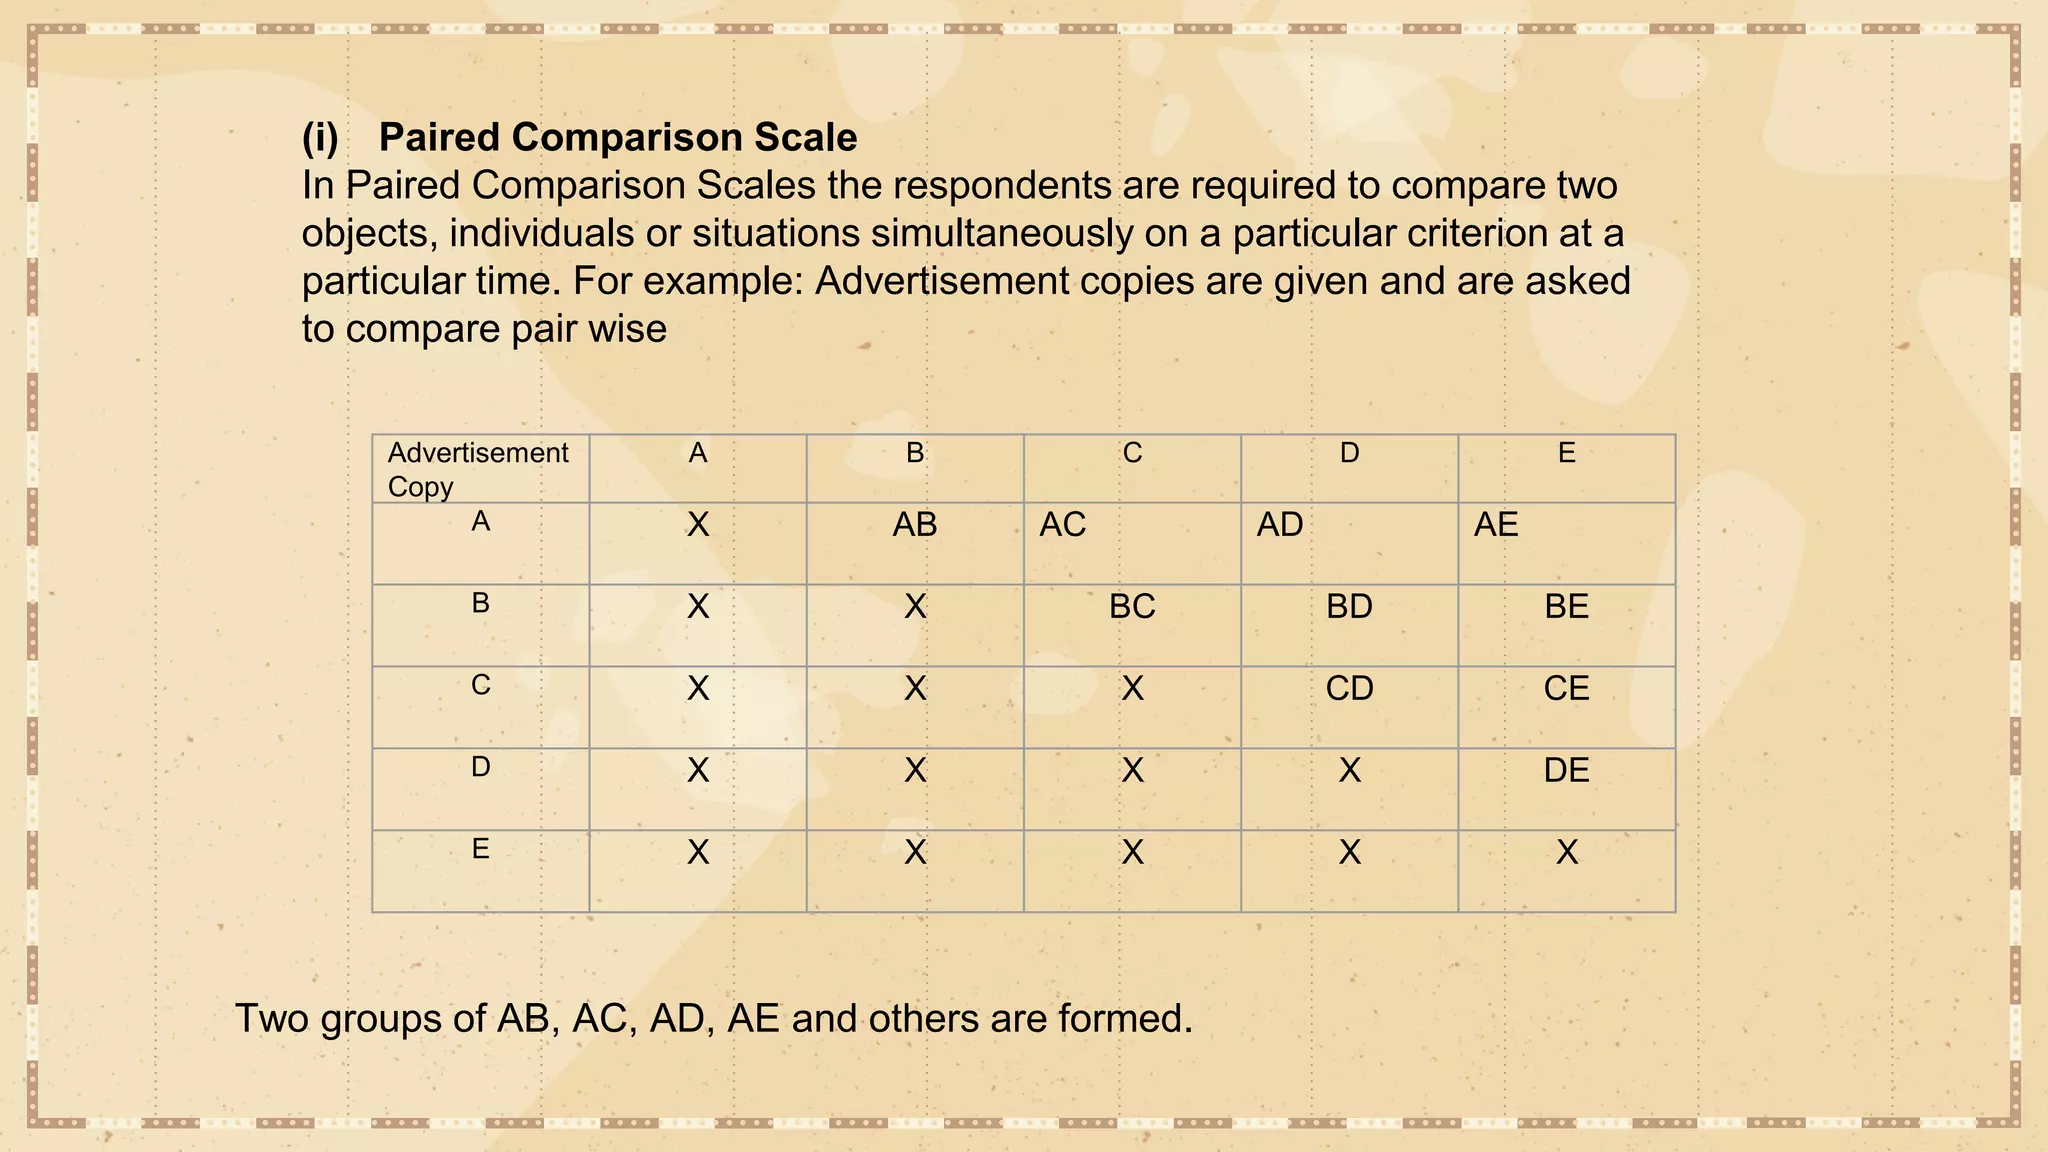
1) Comparative scales like paired comparison, rank order rating, and constant sum scales which compare objects simultaneously.
2) Non-comparative scales like continuous rating and itemized rating (e.g. Likert scales) which rate characteristics of a single object.
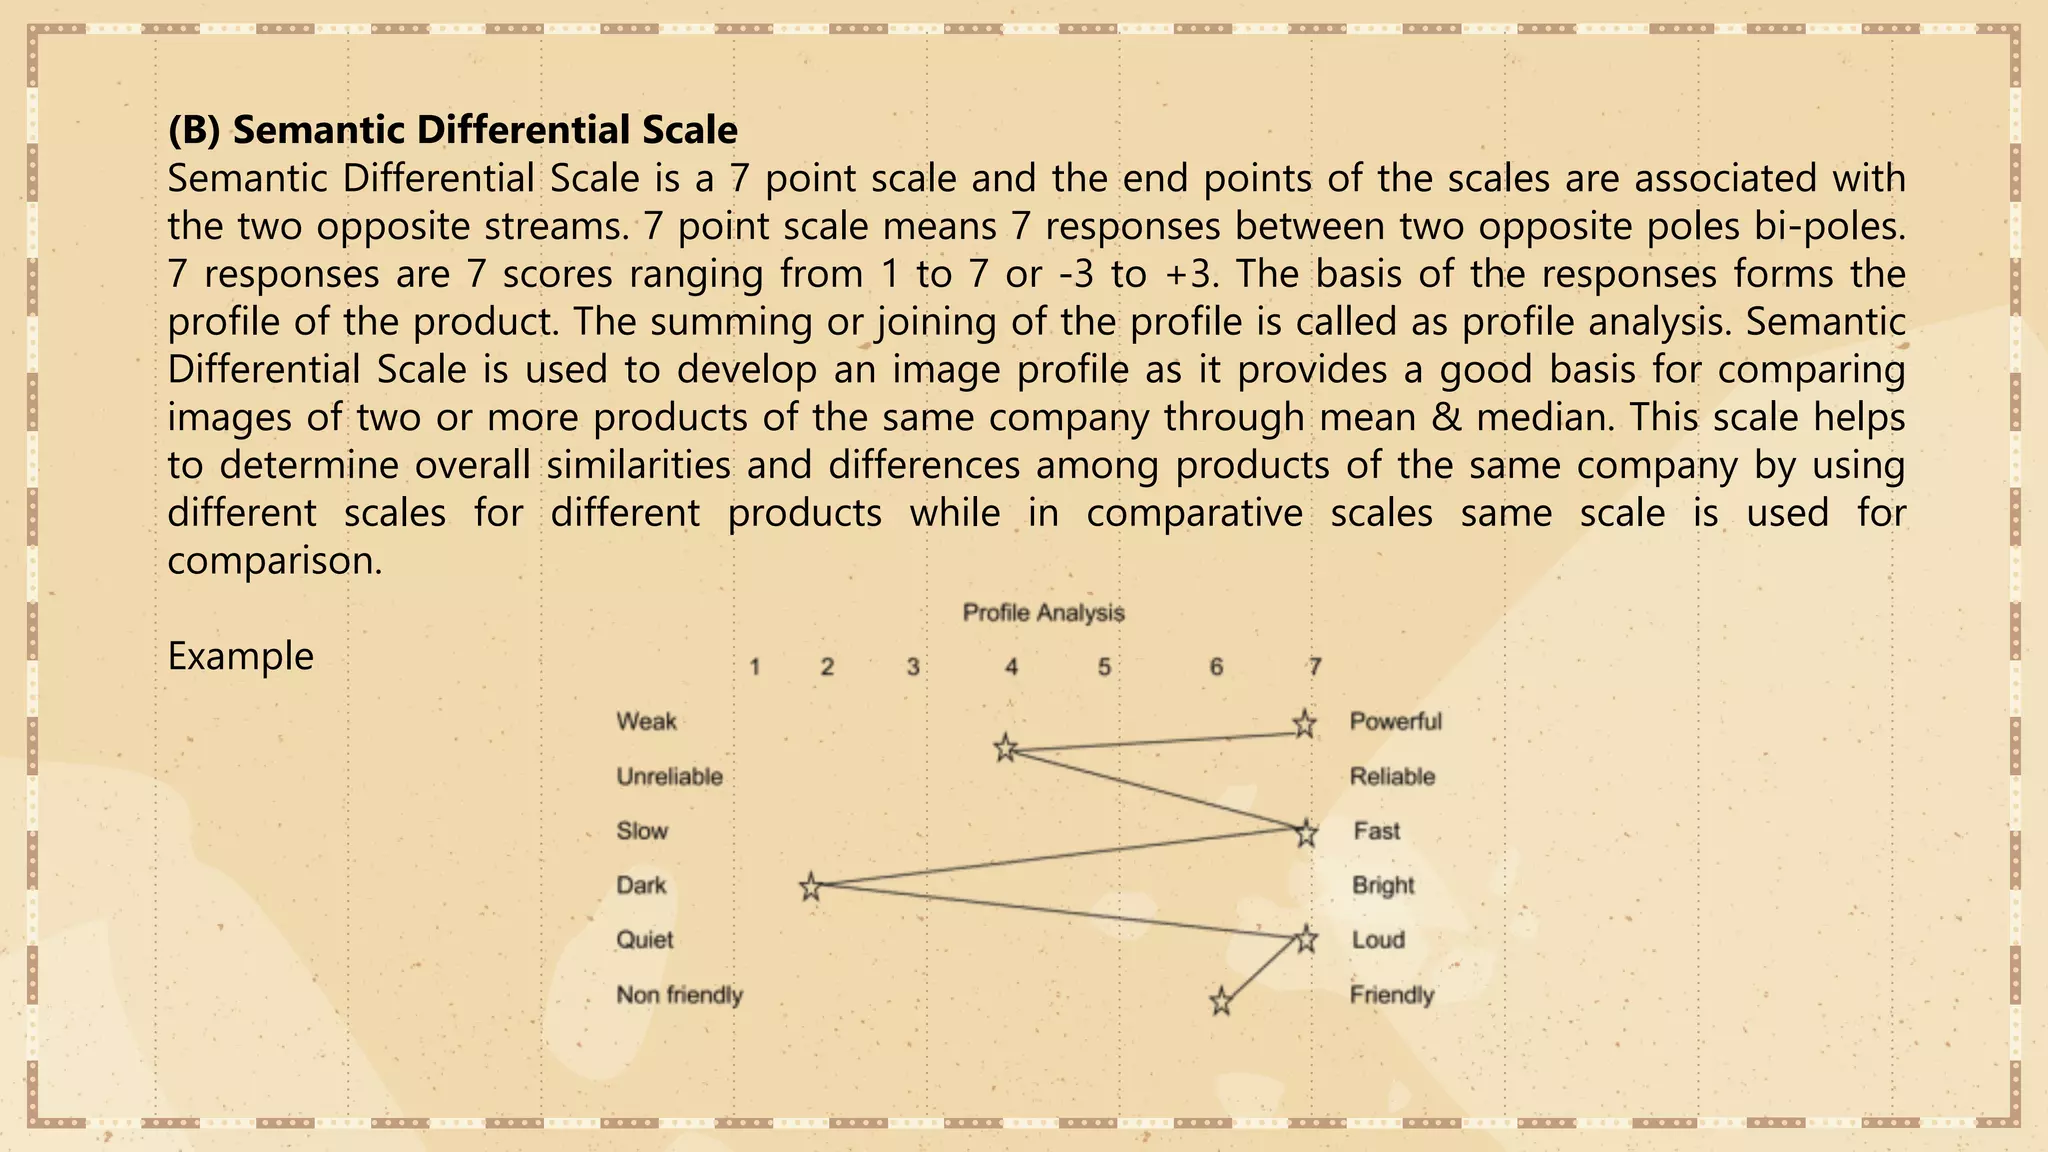
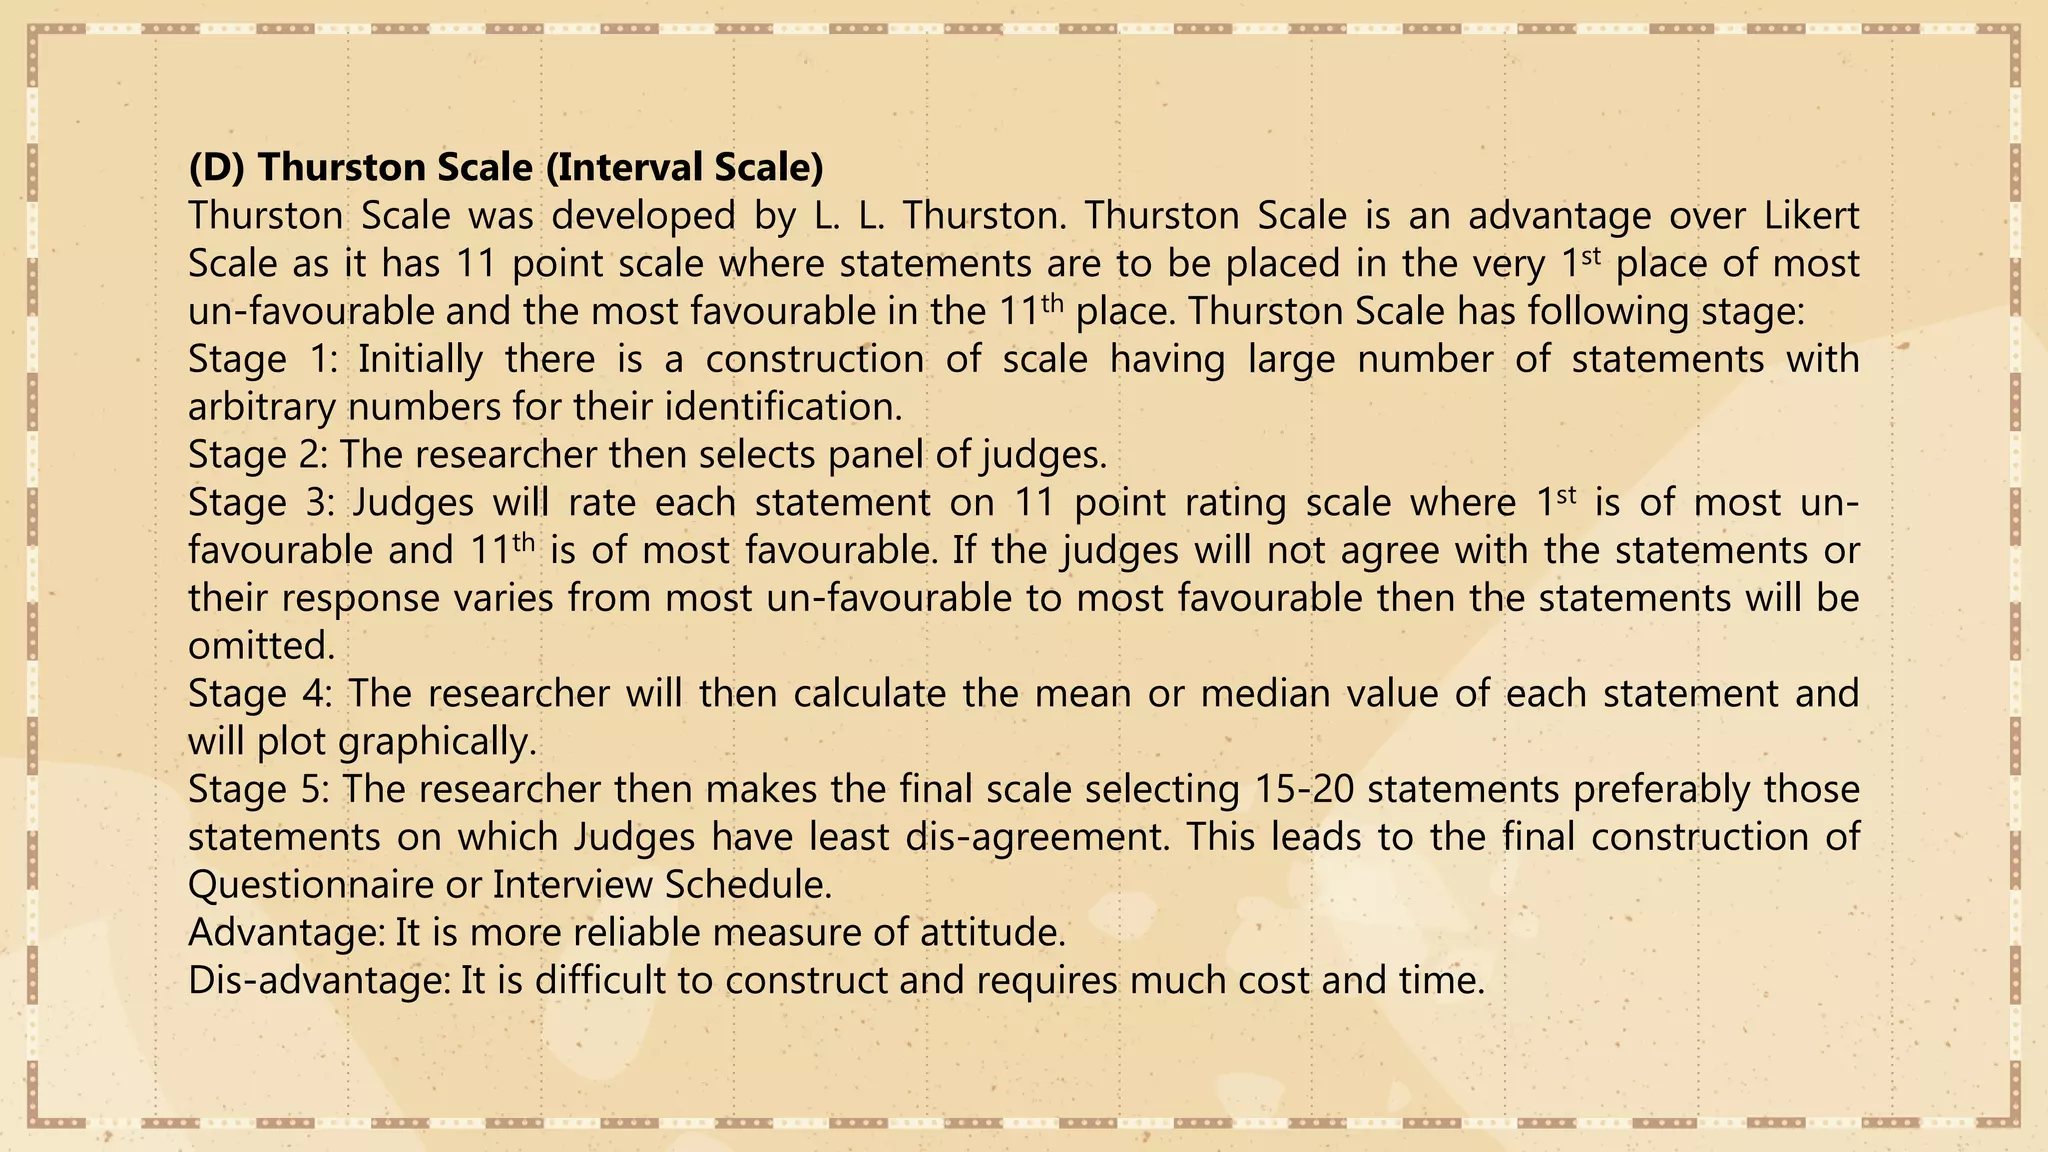
3) Specific scales discussed include semantic differential scales, Stapel scales, Thurston scales, and Guttman scales - each with their own unique approach to measuring attitudes.
caling is the branch of measurement that involves the construction of an instrument that associates qualitative constructs with quantitative metric units. Scaling evolved out of efforts in psychology and education to measure “unmeasurable” constructs like authoritarianism and self-esteem. In many ways, scaling remains one of the most arcane and misunderstood aspects of social research measurement. And, it attempts to do one of the most difficult of research tasks – measure abstract concepts.
Most people don’t even understand what scaling is. The basic idea of scaling is described in General Issues in Scaling, including the important distinction between a scale and a response format. Scales are generally divided into two broad categories: unidimensional and multidimensional. The unidimensional scaling methods were developed in the first half of the twentieth century and are generally named after their inventor. We’ll look at three types of unidimensional scaling methods here:
Thurstone or Equal-Appearing Interval Scaling
Likert or “Summative” Scaling
Guttman or “Cumulative” Scaling
In the late 1950s and early 1960s, measurement theorists developed more advanced techniques for creating multidimensional scales. Although these techniques are not considered here, you may want to look at the method of concept mapping that relies on that approach to see the power of these multivariate methods.
Scaling is the process of measuring or ordering entities with respect to quantitative attributes or traits. With comparative scaling, the items are directly compared with each other .In non -comparative scaling each item is scaled independently of the others.
This presentation is on Measurement and it's scales. There are four different types of scales of measurement, namely, Nominal, Ordinal, Interval and Ratio
measurement and scaling is an important tool of research. by following the right and suitable scale will provide an appropriate result of research.this slide show will additionally provide the statistical testing for research measurement and scale.
Measurement is a procedure for assigning symbols, letters, or numbers to empirical properties of variables according to rules. A Scale is a tool or mechanism by which individuals are distinguished as to how they differ from one another on the variables of interest to our study There are four levels of measurements: nominal, ordinal, interval, and ratio. The measurement scales, commonly used in marketing research, can be divided into two types; comparative and non-comparative scales. A number of scaling techniques are available for measurement of attitudes. There is no unique way that you can use to select a particular scaling technique for your research study.
Research Methodology: Questionnaire, Sampling, Data Preparationamitsethi21985
As per PTU's MBA Syllabus, Unit No. 2: Sources Of Data: Primary And Secondary; Data Collection Methods; Questionnaire Designing: Construction, Types And Developing A Good Questionnaire. Sampling Design and Techniques, Scaling Techniques, Meaning, Types, Data Processing Operations, Editing, Coding, Classification, Tabulation. Research Proposal/Synopsis Writing. Practical Framework
Research methodlogy unit-iv-measurement and data preperation_For BBA_B.com_M...Manoj Kumar
This PPT will be helpful understanding Research Methodology concepts like
Measurement
Types of Scales
Scaling Technique
Data Processing
Data Analysis & Interpretation
Displaying of Data
Links for other units are also given below kindly use that too.
Unit-I
https://www2.slideshare.net/ManojKumar730/research-methodology-unitiresearch-and-its-various-process
Unit-II
https://www2.slideshare.net/ManojKumar730/research-methodology-unit-iidata-collection
Unit-iii
https://www2.slideshare.net/ManojKumar730/research-methodlogy-unitiiisampling
Unit-IV
https://www2.slideshare.net/ManojKumar730/research-methodlogy-unitivmeasurement-and-data-preperationfor-bbabcommba-and-for-other-ug-and-pg-students
Unit-V
https://www2.slideshare.net/ManojKumar730/research-methodlogy-unitvreseach-report-for-bcom-bba-mba-and-other-ug-and-pg-courses
How to Run Landing Page Tests On and Off Paid Social PlatformsVWO
Join us for an exclusive webinar featuring Mariate, Alexandra and Nima where we will unveil a comprehensive blueprint for crafting a successful paid media strategy focused on landing page testing.With escalating costs in paid advertising, understanding how to maximize each visitor’s experience is crucial for retention and conversion.
This session will dive into the methodologies for executing and analyzing landing page tests within paid social channels, offering a blend of theoretical knowledge and practical insights.
The Pearmill team will guide you through the nuances of setting up and managing landing page experiments on paid social platforms. You will learn about the critical rules to follow, the structure of effective tests, optimal conversion duration and budget allocation.
The session will also cover data analysis techniques and criteria for graduating landing pages.
In the second part of the webinar, Pearmill will explore the use of A/B testing platforms. Discover common pitfalls to avoid in A/B testing and gain insights into analyzing A/B tests results effectively.
10 Video Ideas Any Business Can Make RIGHT NOW!
You'll never draw a blank again on what kind of video to make for your business. Go beyond the basic categories and truly reimagine a brand new advanced way to brainstorm video content creation. During this masterclass you'll be challenged to think creatively and outside of the box and view your videos through lenses you may have never thought of previously. It's guaranteed that you'll leave with more than 10 video ideas, but I like to under-promise and over-deliver. Don't miss this session.
Key Takeaways:
How to use the Video Matrix
How to use additional "Lenses"
Where to source original video ideas
5 big bets to drive growth in 2024 without one additional marketing dollar AND how to adapt to the biggest shifting eCommerce trend- AI.
1) Romance Your Customers - Retention
2) ‘Alternative’ Lead Gen - Advocacy
3) The Beautiful Basics - Conversion Rate Optimization
4) Land that Bottom Line - Profitability
5) Roll the Dice - New Business Models
The What, Why & How of 3D and AR in Digital CommercePushON Ltd
Vladimir Mulhem has over 20 years of experience in commercialising cutting edge creative technology across construction, marketing and retail.
Previously the founder and Tech and Innovation Director of Creative Content Works working with the likes of Next, John Lewis and JD Sport, he now helps retailers, brands and agencies solve challenges of applying the emerging technologies 3D, AR, VR and Gen AI to real-world problems.
In this webinar, Vladimir will be covering the following topics:
Applications of 3D and AR in Digital Commerce,
Benefits of 3D and AR,
Tools to create, manage and publish 3D and AR in Digital Commerce.
When most people in the industry talk about online or digital reputation management, what they're really saying is Google search and PPC. And it's usually reactive, left dealing with the aftermath of negative information published somewhere online. That's outdated. It leaves executives, organizations and other high-profile individuals at a high risk of a digital reputation attack that spans channels and tactics. But the tools needed to safeguard against an attack are more cybersecurity-oriented than most marketing and communications professionals can manage. Business leaders Leaders grasp the importance; 83% of executives place reputation in their top five areas of risk, yet only 23% are confident in their ability to address it. To succeed in 2024 and beyond, you need to turn online reputation on its axis and think like an attacker.
Key Takeaways:
- New framework for examining and safeguarding an online reputation
- Tools and techniques to keep you a step ahead
- Practical examples that demonstrate when to act, how to act and how to recover
Videos are more engaging, more memorable, and more popular than any other type of content out there. That’s why it’s estimated that 82% of consumer traffic will come from videos by 2025.
And with videos evolving from landscape to portrait and experts promoting shorter clips, one thing remains constant – our brains LOVE videos.
So is there science behind what makes people absolutely irresistible on camera?
The answer: definitely yes.
In this jam-packed session with Stephanie Garcia, you’ll get your hands on a steal-worthy guide that uncovers the art and science to being irresistible on camera. From body language to words that convert, she’ll show you how to captivate on command so that viewers are excited and ready to take action.
Mastering Multi-Touchpoint Content Strategy: Navigate Fragmented User JourneysSearch Engine Journal
Digital platforms are constantly multiplying, and with that, user engagement is becoming more intricate and fragmented.
So how do you effectively navigate distributing and tailoring your content across these various touchpoints?
Watch this webinar as we dive into the evolving landscape of content strategy tailored for today's fragmented user journeys. Understanding how to deliver your content to your users is more crucial than ever, and we’ll provide actionable tips for navigating these intricate challenges.
You’ll learn:
- How today’s users engage with content across various channels and devices.
- The latest methodologies for identifying and addressing content gaps to keep your content strategy proactive and relevant.
- What digital shelf space is and how your content strategy needs to pivot.
With Wayne Cichanski, we’ll explore innovative strategies to map out and meet the diverse needs of your audience, ensuring every piece of content resonates and connects, regardless of where or how it is consumed.
A.I. (artificial intelligence) platforms are popping up all the time, and many of them can and should be used to help grow your brand, increase your sales and decrease your marketing costs.In this presentation:We will review some of the best AI platforms that are available for you to use.We will interact with some of the platforms in real-time, so attendees can see how they work.We will also look at some current brands that are using AI to help them create marketing messages, saving them time and money in the process. Lastly, we will discuss the pros and cons of using AI in marketing & branding and have a lively conversation that includes comments from the audience.
Key Takeaways:
Attendees will learn about LLM platforms, like ChatGPT, and how they work, with preset examples and real time interactions with the platform. Attendees will learn about other AI platforms that are creating graphic design elements at the push of a button...pre-set examples and real-time interactions.Attendees will discuss the pros & cons of AI in marketing + branding and share their perspectives with one another. Attendees will learn about the cost savings and the time savings associated with using AI, should they choose to.
Top 3 Ways to Align Sales and Marketing Teams for Rapid GrowthDemandbase
In this session, Demandbase’s Stephanie Quinn, Sr. Director of Integrated and Digital Marketing, Devin Rosenberg, Director of Sales, and Kevin Rooney, Senior Director of Sales Development will share how sales and marketing shapes their day-to-day and what key areas are needed for true alignment.
SEO as the Backbone of Digital MarketingFelipe Bazon
In this talk Felipe Bazon will share how him and his team at Hedgehog Digital share our journey of making C-Levels alike, specially CMOS realize that SEO is the backbone of digital marketing by showing how SEO can contribute to brand awareness, reputation and authority and above all how to use SEO to create more robust global marketing strategies.
Mastering Local SEO for Service Businesses in the AI Era is tailored specifically for local service providers like plumbers, dentists, and others seeking to dominate their local search landscape. This session delves into leveraging AI advancements to enhance your online visibility and search rankings through the Content Factory model, designed for creating high-impact, SEO-driven content. Discover the Dollar-a-Day advertising strategy, a cost-effective approach to boost your local SEO efforts and attract more customers with minimal investment. Gain practical insights on optimizing your online presence to meet the specific needs of local service seekers, ensuring your business not only appears but stands out in local searches. This concise, action-oriented workshop is your roadmap to navigating the complexities of digital marketing in the AI age, driving more leads, conversions, and ultimately, success for your local service business.
Key Takeaways:
Embrace AI for Local SEO: Learn to harness the power of AI technologies to optimize your website and content for local search. Understand the pivotal role AI plays in analyzing search trends and consumer behavior, enabling you to tailor your SEO strategies to meet the specific demands of your target local audience. Leverage the Content Factory Model: Discover the step-by-step process of creating SEO-optimized content at scale. This approach ensures a steady stream of high-quality content that engages local customers and boosts your search rankings. Get an action guide on implementing this model, complete with templates and scheduling strategies to maintain a consistent online presence. Maximize ROI with Dollar-a-Day Advertising: Dive into the cost-effective Dollar-a-Day advertising strategy that amplifies your visibility in local searches without breaking the bank. Learn how to strategically allocate your budget across platforms to target potential local customers effectively. The session includes an action guide on setting up, monitoring, and optimizing your ad campaigns to ensure maximum impact with minimal investment.
Most small businesses struggle to see marketing results. In this session, we will eliminate any confusion about what to do next, solving your marketing problems so your business can thrive. You’ll learn how to create a foundational marketing OS (operating system) based on neuroscience and backed by real-world results. You’ll be taught how to develop deep customer connections, and how to have your CRM dynamically segment and sell at any stage in the customer’s journey. By the end of the session, you’ll remove confusion and chaos and replace it with clarity and confidence for long-term marketing success.
Key Takeaways:
• Uncover the power of a foundational marketing system that dynamically communicates with prospects and customers on autopilot.
• Harness neuroscience and Tribal Alignment to transform your communication strategies, turning potential clients into fans and those fans into loyal customers.
• Discover the art of automated segmentation, pinpointing your most lucrative customers and identifying the optimal moments for successful conversions.
• Streamline your business with a content production plan that eliminates guesswork, wasted time, and money.
2. In this unit we will cover the following topics:
● Concept of Measurement:
Need of Measurement; Problems in measurement in
management research – Validity and Reliability. Levels of
measurement – Nominal, Ordinal, Interval, Ratio.
● Attitude Scaling Techniques:
Concept of Scale – Rating Scales viz. Likert Scales,
Semantic Differential Scales, Constant Sum Scales,
Graphic Rating Scales – Ranking Scales – Paired
comparison & Forced Ranking – Concept and Application
3. Concept of
Measurement
Need of Measurement;
Problems in measurement in
management research –
Validity and Reliability. Levels
of measurement – Nominal,
Ordinal, Interval, Ratio.
4. Measurement & Scaling
Measurement means assigning numbers or other symbols to
characteristics of objects according to certain pre-specified rules.
We measure not the object but some characteristic of it. Thus, we do
not measure consumers, only their perceptions, attitudes, preferences
or other relevant characteristics.
Scaling may be considered an extension of measurement. Scaling
involves creating a continuum upon which measured objects are located.
Scaling is the process of placing the respondents on a continuum with
respect to their attitude towards banks. In our example, scaling is the
process by which respondents would be classified as having an
unfavourable, neutral or positive attitude.
5. Importance or need of measurement
• Research conclusions are only as good as the data on which they are based
• Observations must be quantifiable in order to subject them to statistical analysis
• The dependent variable(s) must be measured in any quantitative study.
• The more precise, sensitive the method of measurement, the better.
• Establish Standard Interchangeability.
• To check Customer Satisfaction
• To Validate the design
• Physical parameter into meaningful number.
• True dimension Evaluate the Performance.
7. Scales Nominal Ordinal Interval Ratio
labels
Variables ✓ ✓ ✓ ✓
Ranks
categories in
order ✓ ✓ ✓
Has known,
equal intervals ✓ ✓
Has a true or
meaningful
zero ✓
Levels of Measurement
8. Problems in measurement in management research
– Validity and Reliability
• In terms of Validity are:
• History,
• Maturation,
• Instrumentation,
• Testing,
• Selection bias,
• Social interaction
• In terms of Reliability are:
• Stability of responses
• Opinions may vary regarding each study
• Knowledge
• Quality of the questions
• Total number of questions
9. 1. Nominal Scale
(A) Nominal Scale
Nominal Scale is a very simple scale.
In Nominal Scale numbers/symbols are no more than labels and are used
specifically to identify different categories of responses.
Nominal Scale is used to show relationship between two variables.
In Nominal Scale numbers/ symbols are assigned to cricket players/ football
players/ events in order to label them.
Nominal Scale provides convenient ways of keeping tracks of pupil, objects
and events.
The numbers which are assigned do not reflect the amount of characteristics
possessed by the objects. The only permissible operation is counting.
10. 2. Ordinal Scale
(B) Ordinal Scale
Ordinal Scale is more powerful than Nominal Scale because the numbers possess the
property of rank order.
Ordinal Scale is the simple scale for measuring the attitude.
Ordinal Scale ranks on the basis of their importance.
Ordinal Scale provides ranks to cricket players/ football players/ events/objects from
highest to lowest or lowest to highest.
Ordinal Scale provides first place, second place or third place to winners.
Ordinal Scale provides statements of ‘greater than’ or ‘less than’ but do not state how
much greater or less than. It means there is hidden information of how much first is
first, second is second or third is third.
11. 3. Interval Scale
(C) Interval scale
Interval scale provides the specific values to the objects and the intervals.
Interval scale has 0 point which is arbitrary i.e. man made. Interval Scale
lacks true zero because it does not have the capacity to measure the
complete absence of the characteristic. Here we cannot say that one value
is twice the other value because we do not know the zero point.
Interval Scale has performance rating on 0-10 scale or 20-30 scale.
In Ordinal Scale we do not know by how much there is a gap between two
levels but in Interval Scale we can know the level of gap.
Interval Scale is also known as Rating Scale.
12. 4. Ratio Scale
(D) Ratio scale
Ratio scale shows ratio between two figures.
Ratio scale possesses all the properties of the Nominal, Ordinal &
Interval Scale.
Ratio scale has a natural zero.
Ratio scale can measure physical quantities like length, weight etc.
Ratio scale is not widely used in marketing research but they are
very common on physical part.
15. Attitude
measurement
Attitudes are persuasive component of business research component.
Researcher measure attitudes that peoplecustomer have toward any
concepts, events, phenomenon and entities. Attitude is a learned pre-
disposition to behave in a consistently favourable or un-favourable way with
respect to a given object. The measuring of attitude is difficult as we have
lower scales of measurement.
Attitude scaling procedures
Attitude scaling is the term commonly used to prefer to process of measuring
attitudes. Attitude scaling tends to focus on measurement of the respondents
belief about a particular attribute.
17. Comparative Scales
Comparative Scales are those scales where two or more than two objects are measured
simultaneously. Comparative Scales have the characteristics of ordinal or rank order
scale. Comparative Scales are of the following types:
Paired Comparison Scale
Rank Order Rating Scale
Constant Sum Rating Scale
Q Sort Scale (Not frequent)
A. Comparative Scales
18. Advertisement
Copy
A B C D E
A X AB AC AD AE
B X X BC BD BE
C X X X CD CE
D X X X X DE
E X X X X X
(i) Paired Comparison Scale
In Paired Comparison Scales the respondents are required to compare two
objects, individuals or situations simultaneously on a particular criterion at a
particular time. For example: Advertisement copies are given and are asked
to compare pair wise
Two groups of AB, AC, AD, AE and others are formed.
19. (ii) Rank Order Rating Scale
In Rank Order Rating Scale the respondents are required to compare objects, individuals or
situations by arranging them or ranking them on some criteria at a particular time. The criteria
can be environment, package or promotions in context with human resource. It is like
OrdinalRank Scale which describes objects from most liking to least liking (1 is most liking or
best while 3 is least liking or worse).
S. No. Name of companies Criteria= Environment
1. SAHARA 2
2. TELCO 1
3. SCOOTERS INDIA 3
S. No. Name of companies Criteria= Package
1. SAHARA 2
2. TELCO 1
3. SCOOTERS INDIA 3
S. No. Name of companies Criteria= Promotion
1. SAHARA 2
2. TELCO 1
3. SCOOTERS INDIA 3
20. (iii) Constant Sum Rating Scale
In Constant Sum Rating Scale the respondents are required to compare objects, individuals or
situations by allocating points and then arranging them or ranking them on some criteria at a
particular time. The criteria can be style, mileage and maintenance in context with marketing. It
is like OrdinalRank Scale where objects, individuals or situations are ranked through the
technique of Ratio Scale on some criteria. (100 points are divided among objects, individuals or
situations related with some criteria).
For example
S. No. Name of companies Criteria= Style (Points) Rank
1. HONDA 30 2
2. HERO 40 1
3. BAJAJ 20 3
4. TVS 10 4
S. No. Name of companies Criteria= Mileage (Points) Rank
1. HONDA 30 2
2. HERO 40 1
3. BAJAJ 20 3
4. TVS 10 4
21. (iv) Q Sort Scale (Not frequent)
Q Sort Scale is not very frequent. Q Sort Scale is like Rank Order Rating Scale where
the number of objects, individuals or situations is to be ranked in piles of 60 objects to
140 objects. In Q Sort Scale there are 3 piles of low, medium or high on the basis of
some criteria i.e. quality, price or promotion.
S. No. Name of companies Criteria= Maintenance (Points) Rank
1. HONDA 20 3
2. HERO 40 1
3. BAJAJ 30 2
4. TVS 10 4
22. Non comparative Scales
Non comparative Scales are those scales where two or more than two characteristics or
functions of a particular object, individual or situation are measured simultaneously. Non
comparative Scales also have the characteristics of ordinal or rank order scale. Non comparative
Scales are of the following types:
Continuous Rating Scale
Itemized Rating Scale
B. Non comparative Scales
23. (i) Continuous Rating Scale
In Continuous Rating Scales the respondents are required to rate two or more than two
characteristics or functions of a particular object, individual or situation simultaneously at a
particular time. In Continuous Rating Scales the respondents are given range and they have to
either tick mark ( ) or cross (x) the characteristic or function in terms of importance over the line.
In Continuous Rating Scales the measurement of physical distance is known. The greater the
distance the more favourable is the response or attitude towards the characteristics or functions.
It is also known as Graphical Rating Scale.
Example Criteria
Characteristics Very Bad
Neither Bad nor
Good
Very Good
0 10 20 30 40 50 60 70 80 9
0
100
Courteous
environment
Convenient
Location
Convenient
Hours
24. (ii) Itemized Rating Scale
Itemized Rating Scales are similar to Continuous Rating Scales as the respondents are required to rate
two or more than two characteristics or functions of a particular object, individual or situation
simultaneously at a particular time. Itemized Rating Scales are different to Continuous Rating Scales
as the respondents are required to rate the brief description associated with each characteristic or
function of a particular object, individual or situation. Itemized Rating Scales are of following types:
(a) Likert Scale (Ordinal Scale)
Likert Scale was developed by Rensis Likert. Likert Scale is the most widely used scale. Likert Scale is 5
point scales ranging from strongly agree to strongly disagree related with the series of the statement.
The 5 point means 5 responses which are strongly agree, agree, neither agree nor disagree, disagree
and strongly disagree. There are about 20-30 statements. Each response is assigned a numerical score
ranging from 1 to 5 or +2 to -2. The total of the score of the respondents is computed by adding the
different scores received from the respondents. The total score of the respondent reveals the
particular opinion of a person towards the particular statement. It has ability to rank the attitudes. It is
also called as Summated Rating Scale.
25. Example
Criteria
Statements Strongly
agree
5
Agree
4
Neither agree
nor disagree
3
Disagree
2
Strongly
disagree
1
+2 +1 0 -1 -2
The environment given
by the organization is
optimum.
The location of the
organization is
convenient for everyone.
The hours of the
organization are
convenient for everyone.
26. Calculating attitude through Likert Scale
Respondent 1= The environment given by the organization is optimum= strongly agree=5
Respondent 2= The environment given by the organization is optimum= agree=4
Respondent 3= The environment given by the organization is optimum= strongly agree=5
The attitude measurement related with this statement = 5+4+5=14
Respondent 1= The location of the organization is convenient for everyone= agree=4
Respondent 2= The location of the organization is convenient for everyone= disagree=2
Respondent 3= The location of the organization is convenient for everyone= agree=4
The attitude measurement related with this statement = 4+2+4=10
Respondent 1= The hours of the organization are convenient for everyone= strongly agree=5
Respondent 2= The hours of the organization are convenient for everyone = strongly agree=5
Respondent 3= The hours of the organization are convenient for everyone = strongly agree=5
The attitude measurement related with this statement = 5+5+5=15
27. (B) Semantic Differential Scale
Semantic Differential Scale is a 7 point scale and the end points of the scales are associated with
the two opposite streams. 7 point scale means 7 responses between two opposite poles bi-poles.
7 responses are 7 scores ranging from 1 to 7 or -3 to +3. The basis of the responses forms the
profile of the product. The summing or joining of the profile is called as profile analysis. Semantic
Differential Scale is used to develop an image profile as it provides a good basis for comparing
images of two or more products of the same company through mean & median. This scale helps
to determine overall similarities and differences among products of the same company by using
different scales for different products while in comparative scales same scale is used for
comparison.
Example
28. (a) Staple Scale
Staple Scale was developed by Jan Stapel. Staple Scale is a 10 point scale with uni-
pole label of high quality or good food with 10 responses scattered along the word
in a horizontal or vertical line. These 10 responses are ranging from +5 to -5.
Example
Vertical Representation
+5
+4
+3
+2
+1
High quality
-1
-2
-3
-4
-5
Horizontal Representation
+5 +4 +3 +2 +1 High quality -1 -2 -3 -4 -5
+5 +4 +3 +2 +1 Good food -1 -2 -3 -4 -5
+5 +4 +3 +2 +1 Courteous service -1 -2 -3 -4 -5
+5 +4 +3 +2 +1 Low price -1 -2 -3 -4 -5
29. (D) Thurston Scale (Interval Scale)
Thurston Scale was developed by L. L. Thurston. Thurston Scale is an advantage over Likert
Scale as it has 11 point scale where statements are to be placed in the very 1st place of most
un-favourable and the most favourable in the 11th place. Thurston Scale has following stage:
Stage 1: Initially there is a construction of scale having large number of statements with
arbitrary numbers for their identification.
Stage 2: The researcher then selects panel of judges.
Stage 3: Judges will rate each statement on 11 point rating scale where 1st is of most un-
favourable and 11th is of most favourable. If the judges will not agree with the statements or
their response varies from most un-favourable to most favourable then the statements will be
omitted.
Stage 4: The researcher will then calculate the mean or median value of each statement and
will plot graphically.
Stage 5: The researcher then makes the final scale selecting 15-20 statements preferably those
statements on which Judges have least dis-agreement. This leads to the final construction of
Questionnaire or Interview Schedule.
Advantage: It is more reliable measure of attitude.
Dis-advantage: It is difficult to construct and requires much cost and time.
30. (E) Guttman Scale (Ratio Scale)
Guttman Scale is difficult to construct and is rarely used by the researcher. It consists of small
number of statements with uni-dimensionality i.e. concerning one variable only.
Like Statement 1: Consists of children should not be allowed to watch indecent programmes.
Statement 2: Consists of government should ban indecent programmes.
Statement 3: Consist of channels not airing the indecent programmes.
They all are related to one variable.
Every response showing agree is given 1 score and is represented by cross (x).
Every response showing dis-agree is given 0 score and is represented by blank space.
Then the total score of every individual is obtained.
Example Statements
Respondents I II III IV V Score
A X X X X X 5
B X X X X 4
C X X X 3
D X X 2
E X 1
F 0
The score 3 means that
the respondent agrees
with I,II & III but do not
agrees with the
statement IV & V.
31. Forced Ranking – Concept and Application
Forced ranking is a controversial workforce management tool that uses intense yearly evaluations to
identify a company's best and worst performing employees, using person-to-person comparisons. In
theory, each ranking will improve the quality of the workforce.
There are benefits to a force ranking system. It forces organizations to articulate the criteria for
success and differentiate talent which can, in turn, inspire high performing individuals. For everyone
else, it triggers the Survive channel and can create a self-fulfilling prophesy.
Forced ranking became popular in the 1980s and 1990s, and many companies, such as GE,
Honeywell, Ford, Microsoft, Texas Instruments, Goodyear and Hewlett Packard used it.
What do you look in your shampoo?
Not important Slightly important Moderatelty
Important
Important Very important
Fragrance
Conditioning
Herbal constitute
Foaming
Economy
32. Conclusion
There are four
levels of
measurements:
nominal, ordinal,
interval, and ratio.
The measurement
scales, commonly used
in marketing research,
can be divided into two
types; comparative and
non-comparative
scales.
A number of
scaling
techniques are
available for
measurement of
attitudes.
There is no unique
way that you can
use to select a
particular scaling
technique for your
research study.
01 02 03 04