Z Score,T Score, Percential Rank and Box Plot Graph
UNIT - 1principlea of radar information.pptx
1. RADAR
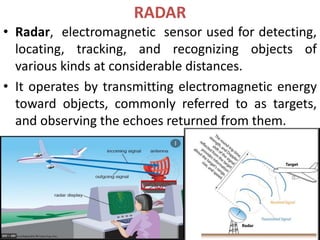
• Radar, electromagnetic sensor used for detecting,
locating, tracking, and recognizing objects of
various kinds at considerable distances.
• It operates by transmitting electromagnetic energy
toward objects, commonly referred to as targets,
and observing the echoes returned from them.
2. :: History ::
• Heinrich Hertz, in 1886, experimentally tested
the theories of Maxwell and demonstrated
the similarity between radio and light waves.
Hertz showed that radio waves could be
reflected by metallic and dielectric bodies.
• Hertz’s experiments were performed with
relatively short wavelength radiation (66 cm),
later work in radio engineering was almost
entirely at longer wavelengths. The shorter
wavelengths were not actively used to any
great extent until the late thirties
3. • In 1903 a German engineer by the name of
Hulsmeyer experimented with the detection of
radio waves reflected from ships. He obtained a
patent in 1904 in several countries for an obstacle
detector and ship navigational device.
• The state of technology at that time was not
sufficiently adequate to obtain ranges of more
than about a mile, and his detection technique
was dismissed on the grounds that it was little
better than a visual observer
4. • Marconi recognized the potentialities of short
waves for radio detection and strongly urged their
use in 1922 for this application. In a speech
delivered before the Institute of Radio Engineers, he
said :
As was first shown by Hertz, electric waves can
be completely reflected by conducting bodies. In
some of my tests I have noticed the effects of
reflection and detection of these waves by metallic
objects miles away.
6. Abilities of Radar
• Radar is used to extend the capability of one's senses
for observing the environment, radar lies not in being a
substitute for the eye, but in doing what eye cannot do.
• Radar cannot resolve detail as well as the eye, nor is it
capable of recognizing the" colour' of objects to the
degree of sophistication of which the eye is capable.
• However, radar can be designed to see through those
conditions impervious to normal human vision, such as
darkness , haze, fog , rain , and snow.
• Radar has the advantage of being able to measure the
distance or range to the object.
7. • A portion of the transmitted signal is
intercepted by a reflecting object
(target) and is reradiated in all
directions.lt
• is the energy reradiated in the back
direction that is of prime interest to
the radar.
• The receiving antenna collects the
returned energy and delivers it to a
receiver, where it is processed to
detect the presence of the target and
to extract its location and relative
velocity.
8. Distance :-
• The distance to the target is determined by
measuring the time Tr taken by the pulse to
travel to the target and return. Since
electromagnetic energy propagates at the
speed of light c = 3 x 10⁸ m/s, the range R is
R=CTr /2
9. • The direction of the target may be determined from
the direction of arrival of the reflected wave front of
arrival is with narrow antenna beams.
• The shift in the carrier frequency of the reflected
wave (doppler effect)in radars which continuously
track the movement of a target, a continuous
indication of the rate of change of target position is
also available
10. maximum unambiguous range
• The unambiguous range of a radar is the maximum range at
which a target can be located so as to guarantee that the
reflected signal/pulse from that target corresponds to the
most recent transmitted pulse. The radar range is measured
by the time delay between pulse transmission and reception.
• Once the transmitted pulse is emitted by the radar, a
sufficient length of time must elapse to allow any echo signals
to return and be detected before the next pulse may be
transmitted. Therefore the rate at which the pulses may be
transmitted is determined by the longest range at which
targets are expected.
11. • If the pulse repetition frequency is too high, echo
signals from some targets might arrive after the
transmission of the next pulse, and ambiguities in
measuring range might result.
• Echoes that arrive after the transmission of the next
pulse are called second-time-around (or multiple-time-
around) echoes.
• Such an echo would appear to be at a much shorter
range than the actual and could be misleading if it were
not known to be a second-time-around echo.
12. • The range beyond which targets appear as second-
time-around echoes is called the maximum
unambiguous range and Unmodulated CW
waveforms do not measure range. Runamb=C/2fp
(1.2) where fp= pulse repetition frequency, in Hz.
15. RADAR EQUATION :-
• It is useful not just as a means for determining the
maximum distance from the radar to the target,
but it can serve both as a tool for understanding
radar operation and as a basis for radar design.
• If the power of the radar transmitter is Pt and if
an isotropic antenna is used the power density at
a distance R from the radar is equal to the
transmitter power divided by the surface area
• Power density from isotropic antenna = Pt /4 π r2
16. • Radars employ directive antennas to channel, or
direct, the radiated power Pt into some particular
direction. The gain G of an antenna is a measure of
the increased power radiated in the direction of the
target as compared with the power that would have
been radiated from an isotropic antenna.
• Power density from directive antenna = Pt G /4 π r2
17. • The target intercepts a portion of the incident
power and reradiates it in various directions. The
measure of the amount of incident power
intercepted by the target and reradiated back in the
direction of the radar is denoted as the radar cross
section σ , and is defined by the relation
18. • The radar cross section σ has units of area. It is a
characteristic of the particular target and is a
measure of its size as seen by the radar. The radar
antenna captures a portion of the echo power. If
the effective area of the receiving antenna is
denoted Ae, the power Pr, received by the radar is
29. •
Early Development of RADAR
frequencies , the letter code such
as S , X , L etc ... Was employed to
designate RADAR frequency bands .
Although its original purpose was
to guard military secrecy
41. • All the parameters are to some extent under
the control of the radar designer, except for
the target cross section .
• The radar equation states that if long ranges
are desired, the transmitted power must be
large, the radiated energy must be
concentrated into a narrow beam
• received echo energy must be collected with a
large antenna aperture and the receiver must
be sensitive to weak signals
42. • In practice, however, the simple radar
equation does not predict the range
performance of actual radar equipments to a
satisfactory degree of accuracy , In some
cases the actual range might be only half that
predicted
• Part of this discrepancy is due to the failure of
Eq. (2.1) to explicitly include the various losses
that can occur throughout the system or the
loss in performance usually experienced when
electronic equipment is operated in the field
rather than under laboratory-type conditions
43. • another important factor that must be
considered in the radar equation is the
statistical or unpredictable nature of several of
the parameters. The minimum detectable
signal and the, target cross section are both
statistical in nature and must be expressed in
statistical terms
• The statistical nature of these several
parameters does not allow the maximum
radar range to be described by a single
number
44. • I n this chapter, the simple radar equation will
be extended to include most of the important
factors that influence radar range
performance. If all those factors affecting
radar range were known, it. would be
possible, in principle, to make an accurate
predict ion of radar performance
• A compromise is always necessary between
what one would like to have and what one
can actually get with reasonable effort
45. MINIMUM DETECTABLE SIGNAL
minimum detectable signal
The weakest signal the receiver can detect is called
the minimum detectable signal
The ability of a radar receiver to detect a weak echo
signal is limited by the noise energy that occupies
the same portion of the frequency spectrum as
does the signal energy.
The specification of the minimum detectable signal is
sometimes difficult because of its statistical nature
and because the criterion for deciding whether a
target is present or not may not be too well defined
46. threshold detection
• Detection is based on establishing a threshold
level at the output of the receiver. If the
receiver output exceeds the threshold, a signal
is assumed to be present. This is called
threshold detection
47. • This might represent one sweep of the video output
displayed on an A-scope.
• The envelope has a fluctuating appearance caused by
the random nature of noise.
• If a large signal is present such as at A in Fig. 2.1, it is
greater than the surrounding noise peaks and can be
recognized on the basis of its amplitude.
• Thus, if the threshold level were set sufficiently high,
the envelope would not generally exceed the threshold
if noise alone were present, but would exceed it if a
strong signal were present.
48. • A matched filter for a radar transmitting a rectangular shaped pulse is
usually characterized by a bandwidth B approximately the reciprocal of
the pulse width
• A threshold level is established. as shown by the dashed line. A target is
said to be detected if the envelope crosses the threshold.
• If the signal is large such as at A, it is not difficult to decide that a target
is present. but consider the two signals at B and C, representing target
echoes of equal amplitude
49. • False Alarm
• Weak signals such as C would not be lost if the
threshold level were lower. But too low a
threshold increases the likelihood that noise
alone will rise above the threshold and be
taken for a real signal. Such an occurrence is
called a false alarm
50. • The selection of the proper threshold level is a compromise
that depends upon how important it is if a mistake is made
either by
(l ) failing to recognize a signal that is present
(2) falsely indicating the presence of a signal when none
exists
• When the target-decision process is made by an operator
viewing a cathode-ray-tube display, it would seem that t he
criterion used by the operator for detection ought to be
analogous to the setting of a threshold, either consciously
or subconsciously.
51. • The chief difference between the electronic
and the operator thresholds is that the
former may be determined with some logic
and can be expected to remain constant with
time, while the latter’s threshold might be
difficult to predict and may not remain
fixed. The individual’s performance as part of
the radar detection process depends upon t
he state of the operator’s fatigue and
motivation, as well as training.
52. RECEIVER NOISE
• noise is the chief factor limiting receiver sensitivity
• Noise is unwanted electromagnetic energy which interferes
with the ability of the receiver to detect the wanted signal.
It may originate within the receiver itself, or it may enter
via the receiving antenna along with the desired signal. If
the radar were to operate in a perfectly noise-free
environment so that no external sources of noise
accompanied the desired signal, and if the receiver itself
were so perfect that it did not generate any excess noise,
• Thermal Noise
• there would still exist an unavoidable component of noise
generated by the thermal motion of the conduction·
electrons in the ohmic portions of the receiver input stages
• directly proportional to the temperature of the ohmic
portions of the circuit and the receiver bandwidth
53.
54. • For radar receivers of the super heterodyne type (the type of
receiver used for most radar applications), the receiver
bandwidth is approximately that of the intermediate-
frequency stages. It should be cautioned that the bandwidth
Bn of Eq. (2.2) is not the 3-dB, or half-power, bandwidth
commonly employed by electronic engineers. It is an
integrated bandwidth and is given by
55. • noise bandwidth :- is the bandwidth of an equivalent
rectangular filter whose noise power output is the
same as the filter with characteristic H(f).
• The frequency-response characteristics of many
practical radar receivers are such that the 3-dB and the
noise bandwidths do not differ appreciably. Therefore
the 3-dB bandwidth may he used in many cases as an
approximation to the noise band width.
• The noise power in practical receivers is often greater
than can be accounted for by thermal noise alone.
The additional noise components are due to
mechanisms other than the thermal agitation of the
conduction electrons
56. • No matter whether the noise is generated by a thermal
mechanism or by some other mechanism. the total noise at
the output of the receiver may be considered to be equal to
the thermal-noise power obtained from an "ideal" receiver
multiplied by a factor called the noise figure . The noise figure
Fn of a receiver is defined by the equation
57. • Rearranging Eq. (2.4b,), the input signal may be expressed as
•
• If the minimum detectable signal Smin is that value of Si
corresponding to the minimum ratio of output(IF) signal-to-noise
ratio (S0 / N0 )min necessary for detection, then
Substituting Eq . (2.6) into Eq. (2.1) results in the following form of
the radar equation:
•
58. PDS and FALSE ALARAM
• Probability is a measure of the likelihood of occurrence
of an event
• Scale of Probability from 0 to 1 .
• Intermediate probabilities are assigned so that the
more likely an event
• Probability theory needed to analyze the detection of
signals in noise is the PDS .
• Noise is the random Phenomenon , Predictions
concerning the average performance of random
phenomena are possible by observing and classifying
occurrences , but one cannot predict exactly what will
occur for any particular event
59. • “x” is the typical measured value of a random
process .
• Imagine each “x” to define a point on a straight line
corresponding to the distance from reference point
• Distance of “x” from the reference point might
present the value of the noise .
• Divide he line into small equal segments length
“Δx”
Count the number of times that “x” falls in each
interval . Then the PDS defined as
60.
61. • Second Detector and Video Amplifier are assumed
to form an envelope detector , that is one which
rejects the carrier frequency but passed the
modulation envelope .
• To extract the modulation envelope the video
bandwidth must be wide enough to pass the low
frequency components generated by second
detector , but not so wide as to pass the high
frequency components .
62. • Where p(v)dv is the probability of the finding noise
between the values of v and v+dv
• If this noise is passing through the envelope
detector with the amplitude “R” then PDS will be
63.
64. • False Alarm Time : time interval between the
crossing s of the threshold by noise alone .
65. • False alarm probability may also be defined as the
ratio of the duration of the time the envelope
actually above the threshold to the total time it
could have been above the threshold .
• Pfa = (Duration of time the envelope is actually
above the threshold) / total time it could have been
above the threshold
66. Radar Cross Section of Targets
• Radar cross-section (RCS), also called radar signature, is a measure of how
detectable an object is by radar. A larger RCS indicates that an object is
more easily detected.
• RCS of a radar target is an effective area that intercepts the transmitted
radar power and then scatters that power isotropically back to the radar
receiver.
• An object reflects a limited amount of radar energy back to the source.
67. • The factors that influence this include:
-- the material with which the target is made;
-- the size of the target relative to the wavelength of
the illuminating radar signal;
-- the absolute size of the target;
-- the incident angle (angle at which the radar beam
hits a particular portion of the target, which depends
upon the shape of the target and its orientation to the
radar source);
-- the reflected angle (angle at which the reflected
beam leaves the part of the target hit; it depends upon
incident angle);
While important in detecting targets, strength of
emitter and distance are not factors that affect the
calculation of an RCS because RCS is a property of the
target's reflectivity.
68. • Radar cross-section is used to detect airplanes in a
wide variation of ranges. For example, a stealth
aircraft (which is designed to have low detectability
) will have design features that give it a low RCS
(such as absorbent paint, flat surfaces, surfaces
specifically angled to reflect the signal somewhere
other than towards the source),
• a passenger airliner that will have a high RCS (bare
metal, rounded surfaces effectively guaranteed to
reflect some signal back to the source, many
protrusions like the engines, antennas, etc .)
69. • More precisely, the RCS of a radar target is the
hypothetical area required to intercept the
transmitted power density at the target such that if
the total intercepted power were re-radiated
isotropically, the power density actually observed at
the receiver is produced. This statement can be
understood by examining the monostatic (radar
transmitter and receiver co-located) radar
equation one term at a time:
70. • A target's RCS depends on its
size, reflectivity of its surface, and the directivity of
the radar reflection caused by the target's
geometric shape.
• Size
As a rule, the larger an object, the stronger its radar
reflection and thus the greater its RCS. Also, radar
of one band may not even detect certain size
objects. For example, 10 cm (S-band radar) can
detect rain drops but not clouds whose droplets are
too small.
71. • Material
Materials such as metal are strongly radar reflective
and tend to produce strong signals. Wood and cloth
(such as portions of planes and balloons used to be
commonly made) or plastic and fibreglass are less
reflective or indeed transparent to radar making
them suitable for radomes. Even a very thin layer of
metal can make an object strongly radar reflective
• Radar absorbent paint
• Some planes were painted with a special "iron ball
paint" that consisted of small metallic-coated balls.
Radar energy received is converted to heat rather
than being reflected.
72. Measurement :-
• Quantitatively, RCS is calculated as
Where σ is the RCS, Si is the incident power
density measured at the target, and Ss is the scattered
power density seen at a distance r away from the
target.
In electromagnetic analysis this is also commonly written
as
In the design phase, it is often desirable to employ
a computer to predict what the RCS will look like before
fabricating an actual object. Many iterations of this
prediction process can be performed in a short time at
low cost .
73. • SPHERE
• radar cross section, can be determined by solving Maxwell's
equations with the proper boundary conditions applied.16
Unfortunately, the determination of the radar cross section
with Maxwell's equations can be accomplished only for the
most simple of shapes, and solutions valid over a large range
of frequencies are not easy to obtain. The radar cross section
of a simple sphere is shown in Fig. 2.9 as a function of its
circumference measured in wavelength
• Rayleigh region
The region where the size of the sphere is small compared
with the wavelength is called the Rayleigh region (2πa/λ )
<<1,
74.
75. • The Rayleigh scattering region is of interest to the
radar engineer because the cross sections of
raindrops and other meteorological particles fall
within this region at the usual radar frequencies
• The usual radar targets are much larger than
raindrops or cloud particles, and lowering the
radar frequency to the point where rain or cloud
echoes are negligibly small will not seriously
reduce the cross section of the larger desired
targets.
• On the other hand, if it were desired to actually
observe, rather than eliminate, raindrop echoes,
as in a meteorological or weather-observing
radar, the higher radar frequencies would be
preferred.
76. • optical region
• At the other extreme from the Rayleigh region
is the optical region, where the dimensions of
the sphere are large compared with the
wavelength . For large (2πa/ λ)>>1, the radar
cross section approaches the optical cross
section πa2
• Mie, or resonance, region
• The cross section is oscillatory with frequency
within this region
77. • The behaviour of the radar cross sections of other
simple reflecting objects as a function of frequency
is similar to that of the sphere .
• Since sphere is a sphere no matter from what
aspect it is viewed , its cross section will not be
aspect sensitive . The cross section of other objects
however will be depend upon the direction as
viewed by RADAR
78. Reduction :-
• RCS reduction is chiefly important in stealth technology
for aircraft, missiles, ships, and other military vehicles.
• Purpose shaping
With purpose shaping, the shape of the target's
reflecting surfaces is designed such that they reflect
energy away from the source.
• Active cancellation
With active cancellation, the target generates a radar
signal equal in intensity but opposite in phase to the
predicted reflection of an incident radar signal
(similarly to noise cancelling ear phones). This
creates destructive interference between the reflected
and generated signals, resulting in reduced RCS.
79. PULSE REPETITION FREQUENCY AND
RANGE AMBIGUITIES
• The pulse repetition frequency (prf) is determined primarily by the
maximum range at which targets are expected.
• If the prf is made too high, the likelihood of obtaining target echoes
from the wrong pulse transmission is increased.
• Echo signals received after an interval exceeding the pulse-
repetition period are called multiple-time-around echoes. They can
result in erroneous or confusing range measurements.
80. • Consider the three targets labeled A, B, and C in Fig. 2.26a. Target A is
located within the maximum unambiguous range Runamb [Eq. (1.2)] of
the radar, target B is at a distance greater than Runamb but less than
2Runamb, while target C is greater than 2Runamb but less than 3Runamb.
The appearance of the three targets on an A-scope is sketched in Fig.
2.26b
• One method of distinguishing multiple-time-around echoes from
unambiguous echoes is to operate with a varying pulse repetition
frequency. The echo signal from an unambiguous range target will appear
at the same place on the A-scope on each sweep no matter whether the
prf is modulated or not. However, echoes from multiple-time-around
targets will be spread over a finite range as shown in Fig. 2.26c.
81. • The number of separate pulse repetition
frequencies will depend upon the degree of
the multiple time targets
• Instead of modulating the prf, other schemes
that might he employed to “mark" successive
pulses so as to identify multiple-time-around
echos include changing the pulse amplitude,
pulse width, frequency, phase, or polarization
of transmission from pulse to pulse
82. SYSTEM LOSSES
• At the beginning of this chapter it was mentioned that one of
the important factors omitted from the simple radar
equation was the losses that occur throughout the radar
system.
• The losses reduce the signal-to-noise ratio at the receiver
output.
• They may be of two kinds,
• depending-upon whether or not they can be predicted with
any degree of precision beforehand.
• The antenna beam-shape loss, collapsing loss, and losses in
the microwave plumbing are examples or losses which can be
calculated if the system configuration is known.
• These losses are very real and cannot be ignored in any
serious prediction or radar performance. .
• Losses not readily subject to calculation and which are less
predictable include· those due- to field degradation and to
operator fatigue or lack of operator motivation.
83. 1 . Plumbing loss :- . There is always some finite loss
experienced in the transmission lines which connect the
output of the transmitter to the antenna.
• At the lower radar frequencies the transmission line
introduces little loss, unless its length is exceptionally long.
• At the higher radar frequencies, attenuation may not
always be small and may have to be taken into account.
• In addition to the losses in the transmission line itself,
an additional loss can occur at each connection or bend
in the line and al the antenna rotary joint if used.
• Connector losses are usually small, but if the connection is
poorly made, it can contribute significant attenuation.
• Since the same transmission line is generally used for
both receiving and transmission, the loss to be inserted
in the radar equation is twice the one-way loss.
84. • Nonideal Equipment :- The transmitter power
introduced into the radar equation was assumed
to be the output power (either peak or average).
However, transmitting tubes are not all uniform
in quality, nor should it be expected that any
individual tube will remain at the same level of
performance throughout its useful life.
• Also the power is usually not uniform over the
operating band of the device.
• Thus, for one reason or another, the transmitted
power may be other than the design value . To
allow for this, a loss factor may be introduced.
This factor can vary with the application, but
lacking a better number, a loss of about 2 dB
might be used as an approximation.
85. 2 .Limiting Loss :- Limiting in the radar receiver can lower the
probability or detection.
Although a well-designed and engineered receiver will not
limit the received signal under normal circum stances.
intensity modulated CRT displays such as the PPI or the
B-scope have limited dynamic range and may limit.
3. Collapsing Loss :- If the radar were to integrate additional
noise samples along with the wanted signal-to noise
pulses, the added noise results in a degradation called the
collapsing loss
A collapsing loss can occur when the output or a high
resolution radar is displayed on a device whose resolution
is coarser than that inherent in the radar. A collapsing loss
also results if the outputs of two (or more) radar receivers
are combined and only one contains signal while the other
contains noise
86. Operator loss : - An alert, motivated, and well-trained
operator should perform as well as described by theory.
However, when distracted, tired, overloaded, or not
properly trained, operator performance will decrease.
• It is also justified when automatic (electronic) detections
are made without the aid of an operator
Field degradation :- . When a radar system is operated
under laboratory conditions by engineering personnel and
experienced technicians, the inclusion of the above losses
into the radar equation should give a realistic description of
the performance of the radar under normal conditions
However, when a radar is operated under field
conditions. the performance usually deteriorates even
more than can be accounted for by the above losses,
especially when the equipment is operated and maintained
by inexperienced or unmotivated personnel.
87. • Factors which contribute to field degra dation arc poor tuning, weak
tubes, water in the transmission lines, incorrect mixer-crystal
current, deterioration of receiver noise figure, poor TR tube
recovery, loose cable connections, etc.
• To minimize field degradation, radars should be designed with built-
in automatic performance-monitoring equipment. Careful
observation of performance-monitoring instruments and timely
preventative maintenance can do much to keep radar performance
up to design level
• A good estimate of the field degradation is difficult to obtain since it
cannot be predicted and is dependent upon the particular radar
design and "the conditions under which it is operating
• Other Loss Factors :- The MTI discrimination technique results in
complete loss of sensitivity for certain values of target velocity
relative to the radar. These are called blind speeds.
The straddling loss accounts for the loss in signal-to-noise ratio
for targets not at the center of the range gate or at the center of
the filter in a multiple-filter-bank processor.
88. • There are many causes of loss and inefficiency
in a radar. Not all have been included here.
Although they may each be small, the sum
total can result in a significant reduction in
radar performance. It is important to
understand the origins of these losses, not
only for better predictions of radar range, but
also for the purpose of keeping them to a
minimum by careful radar design.