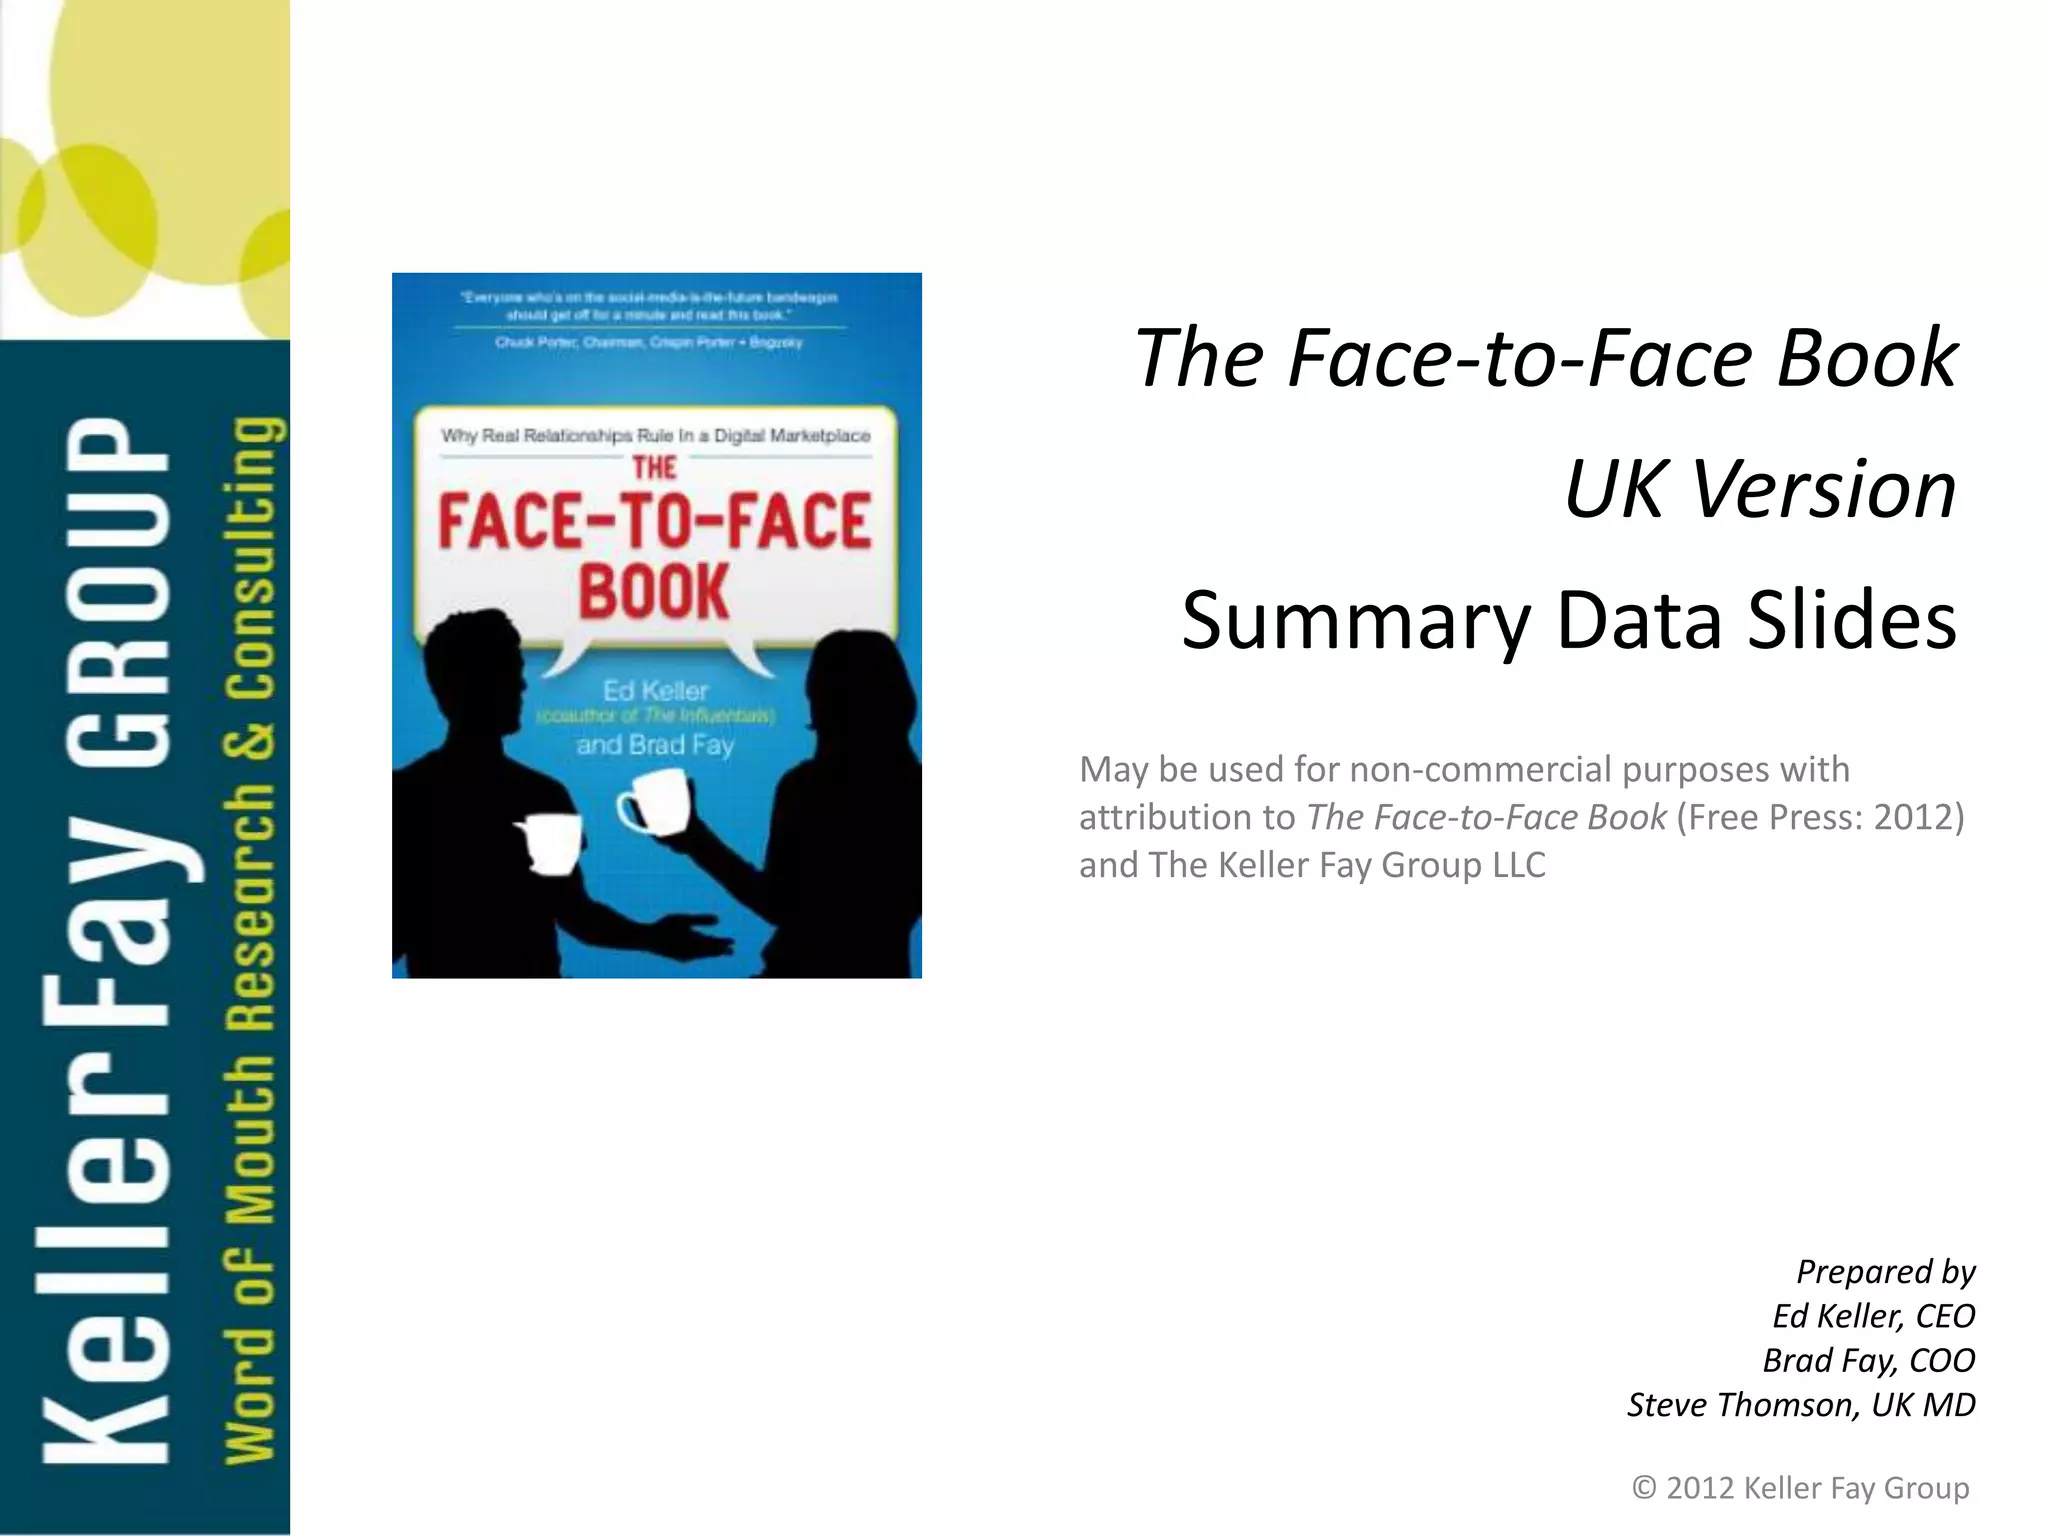
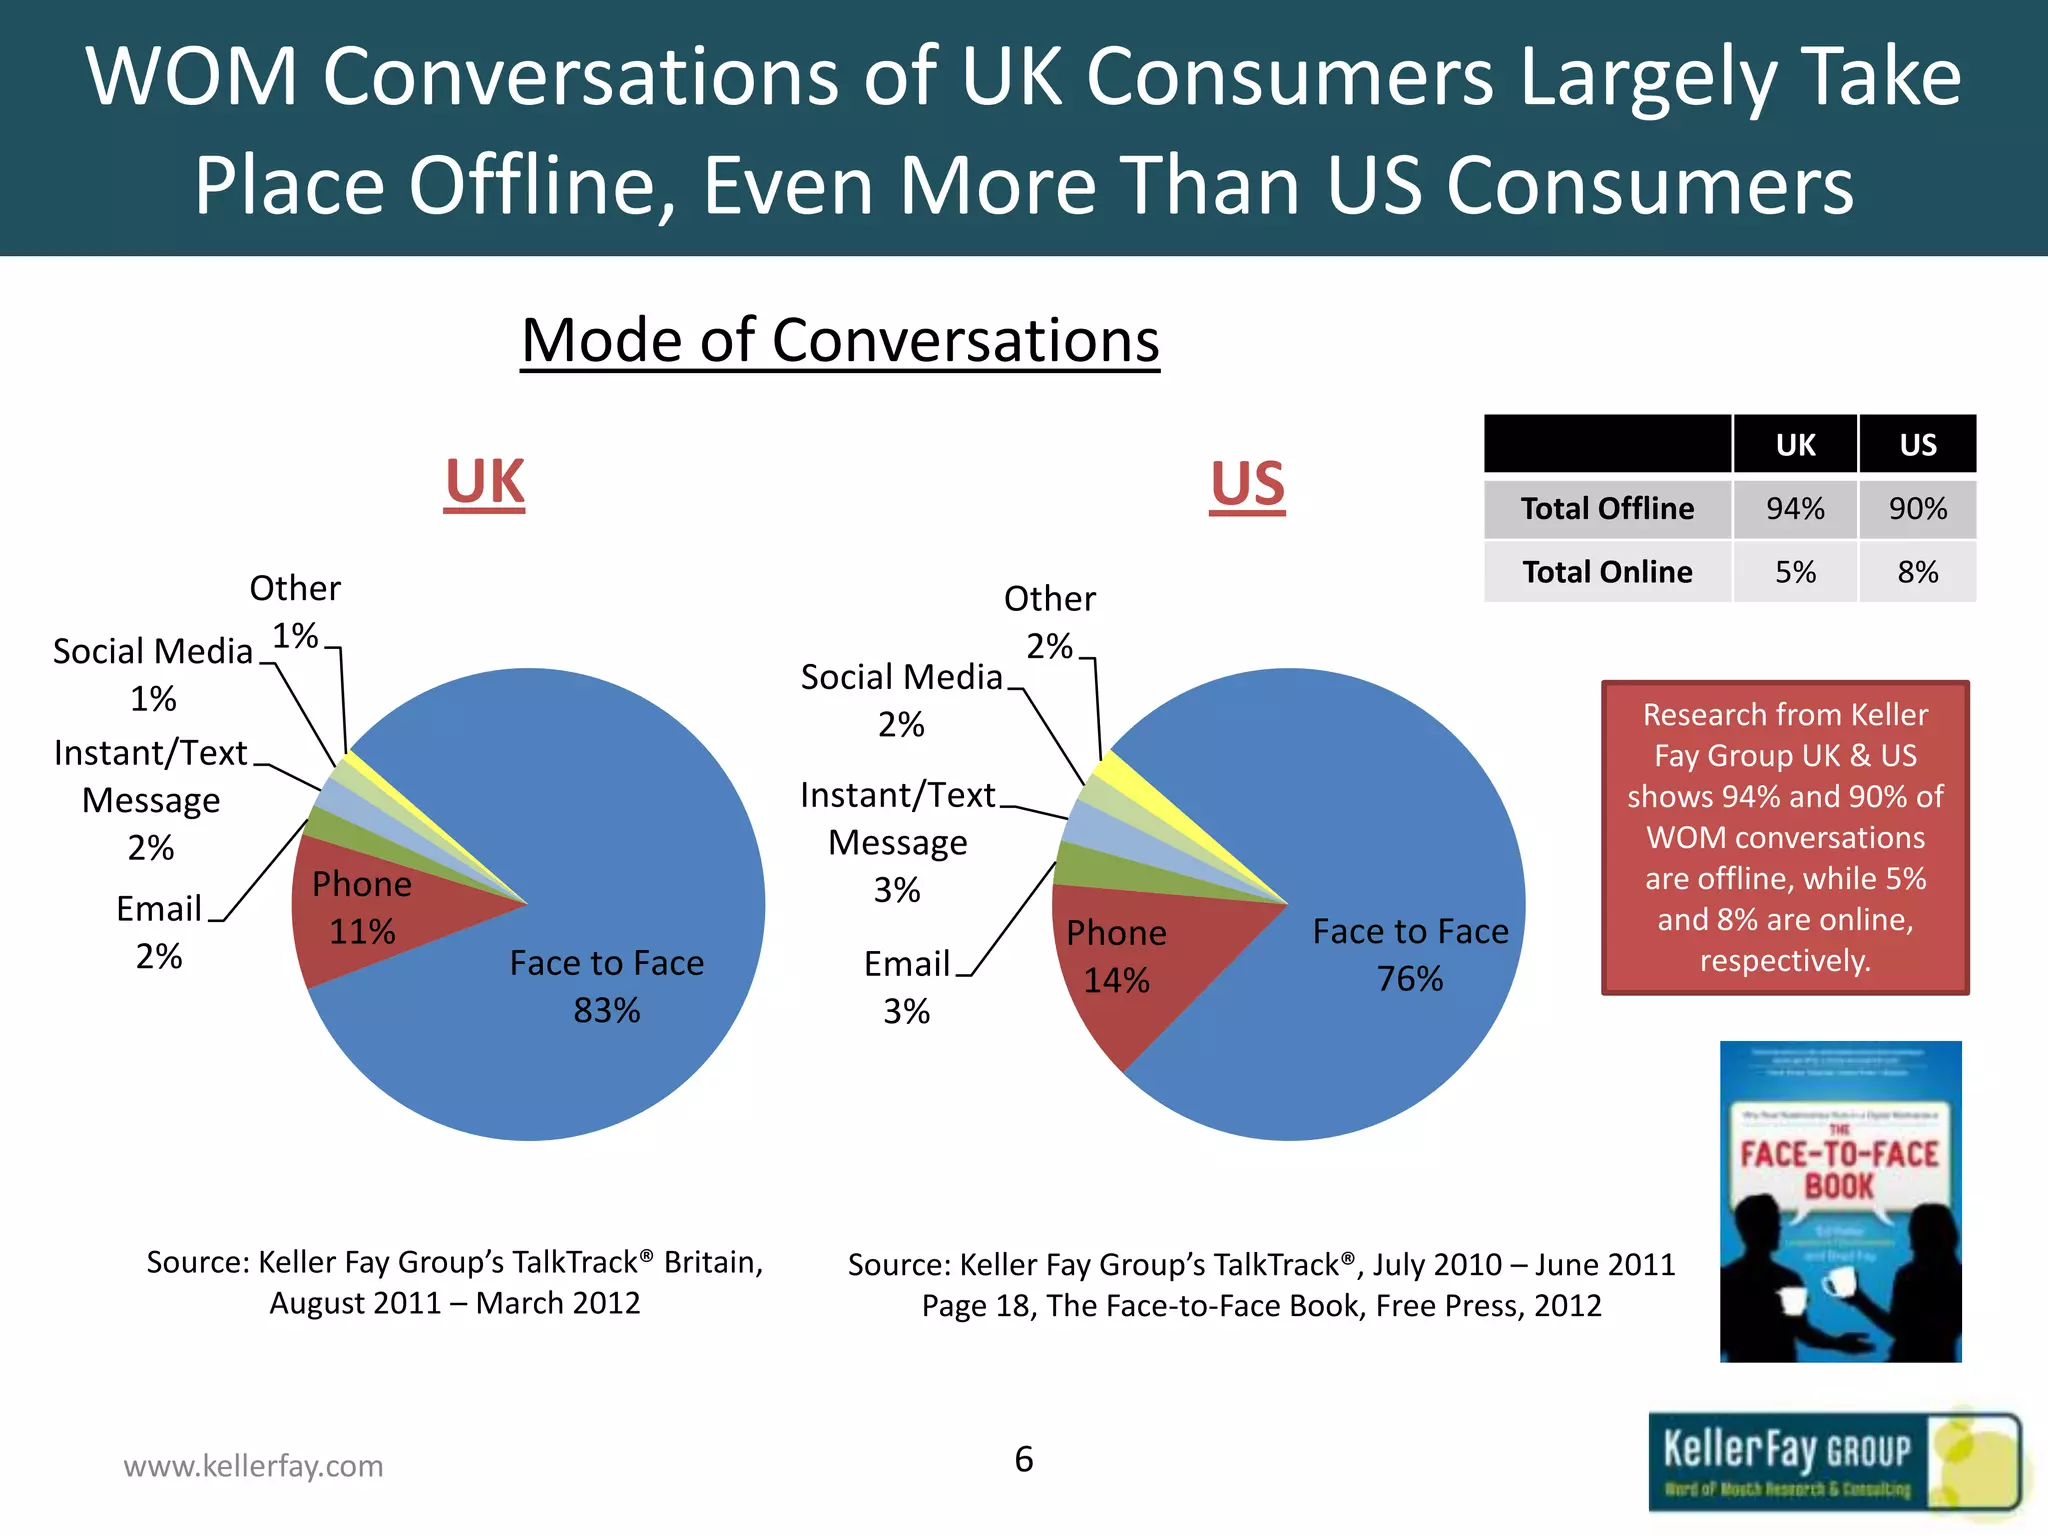
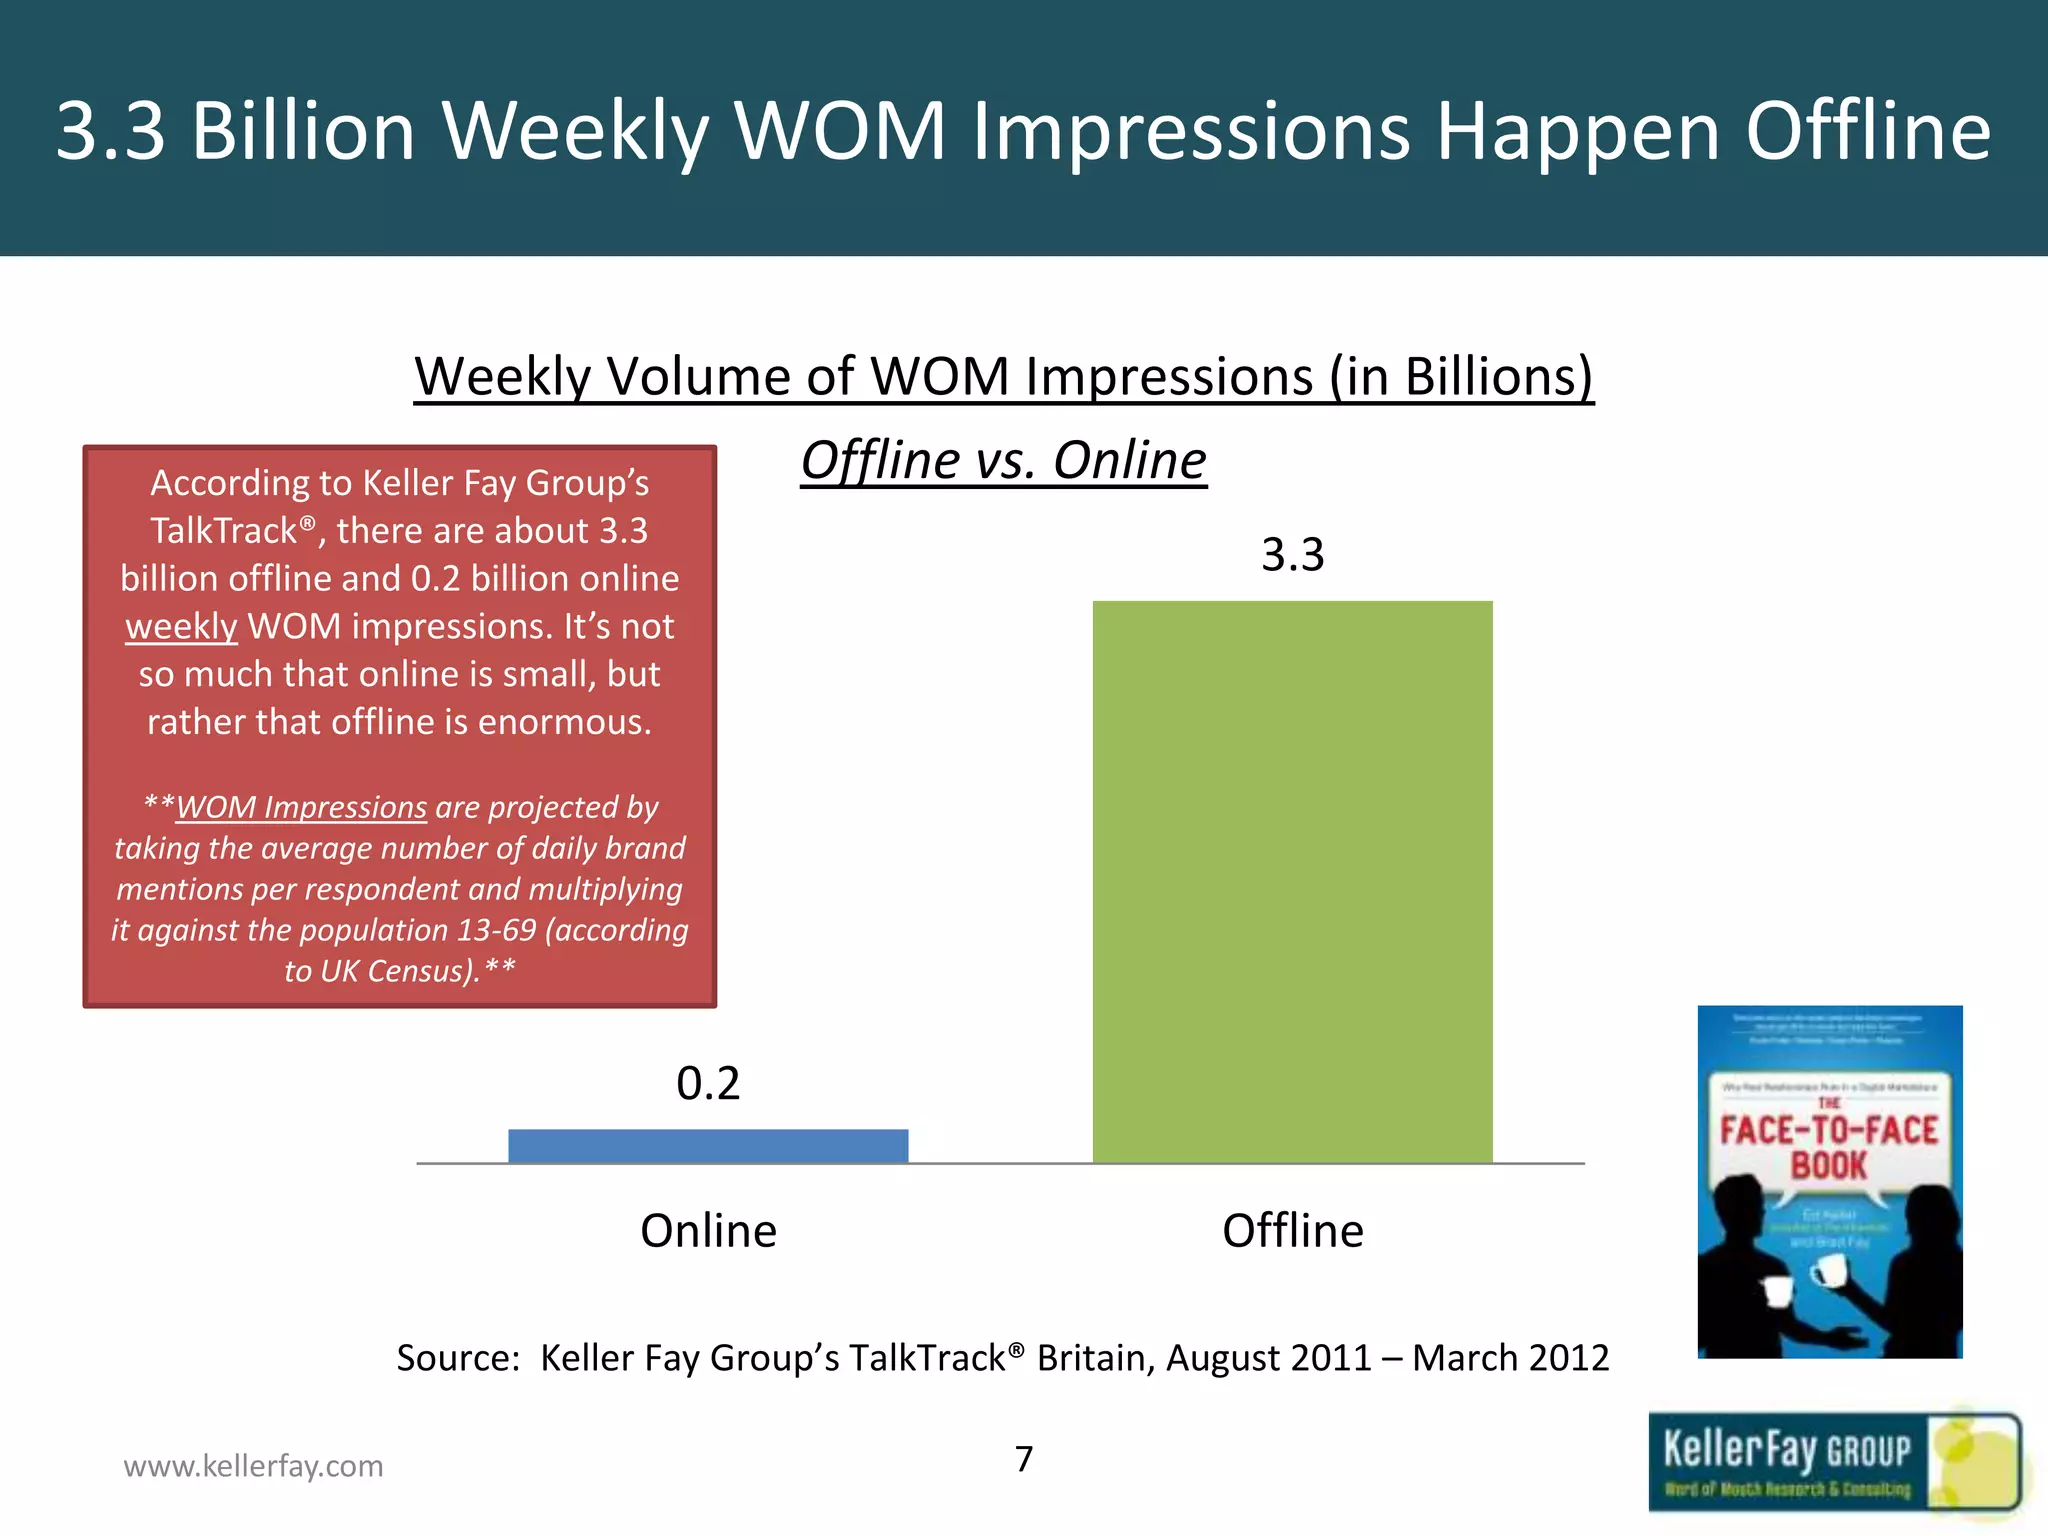
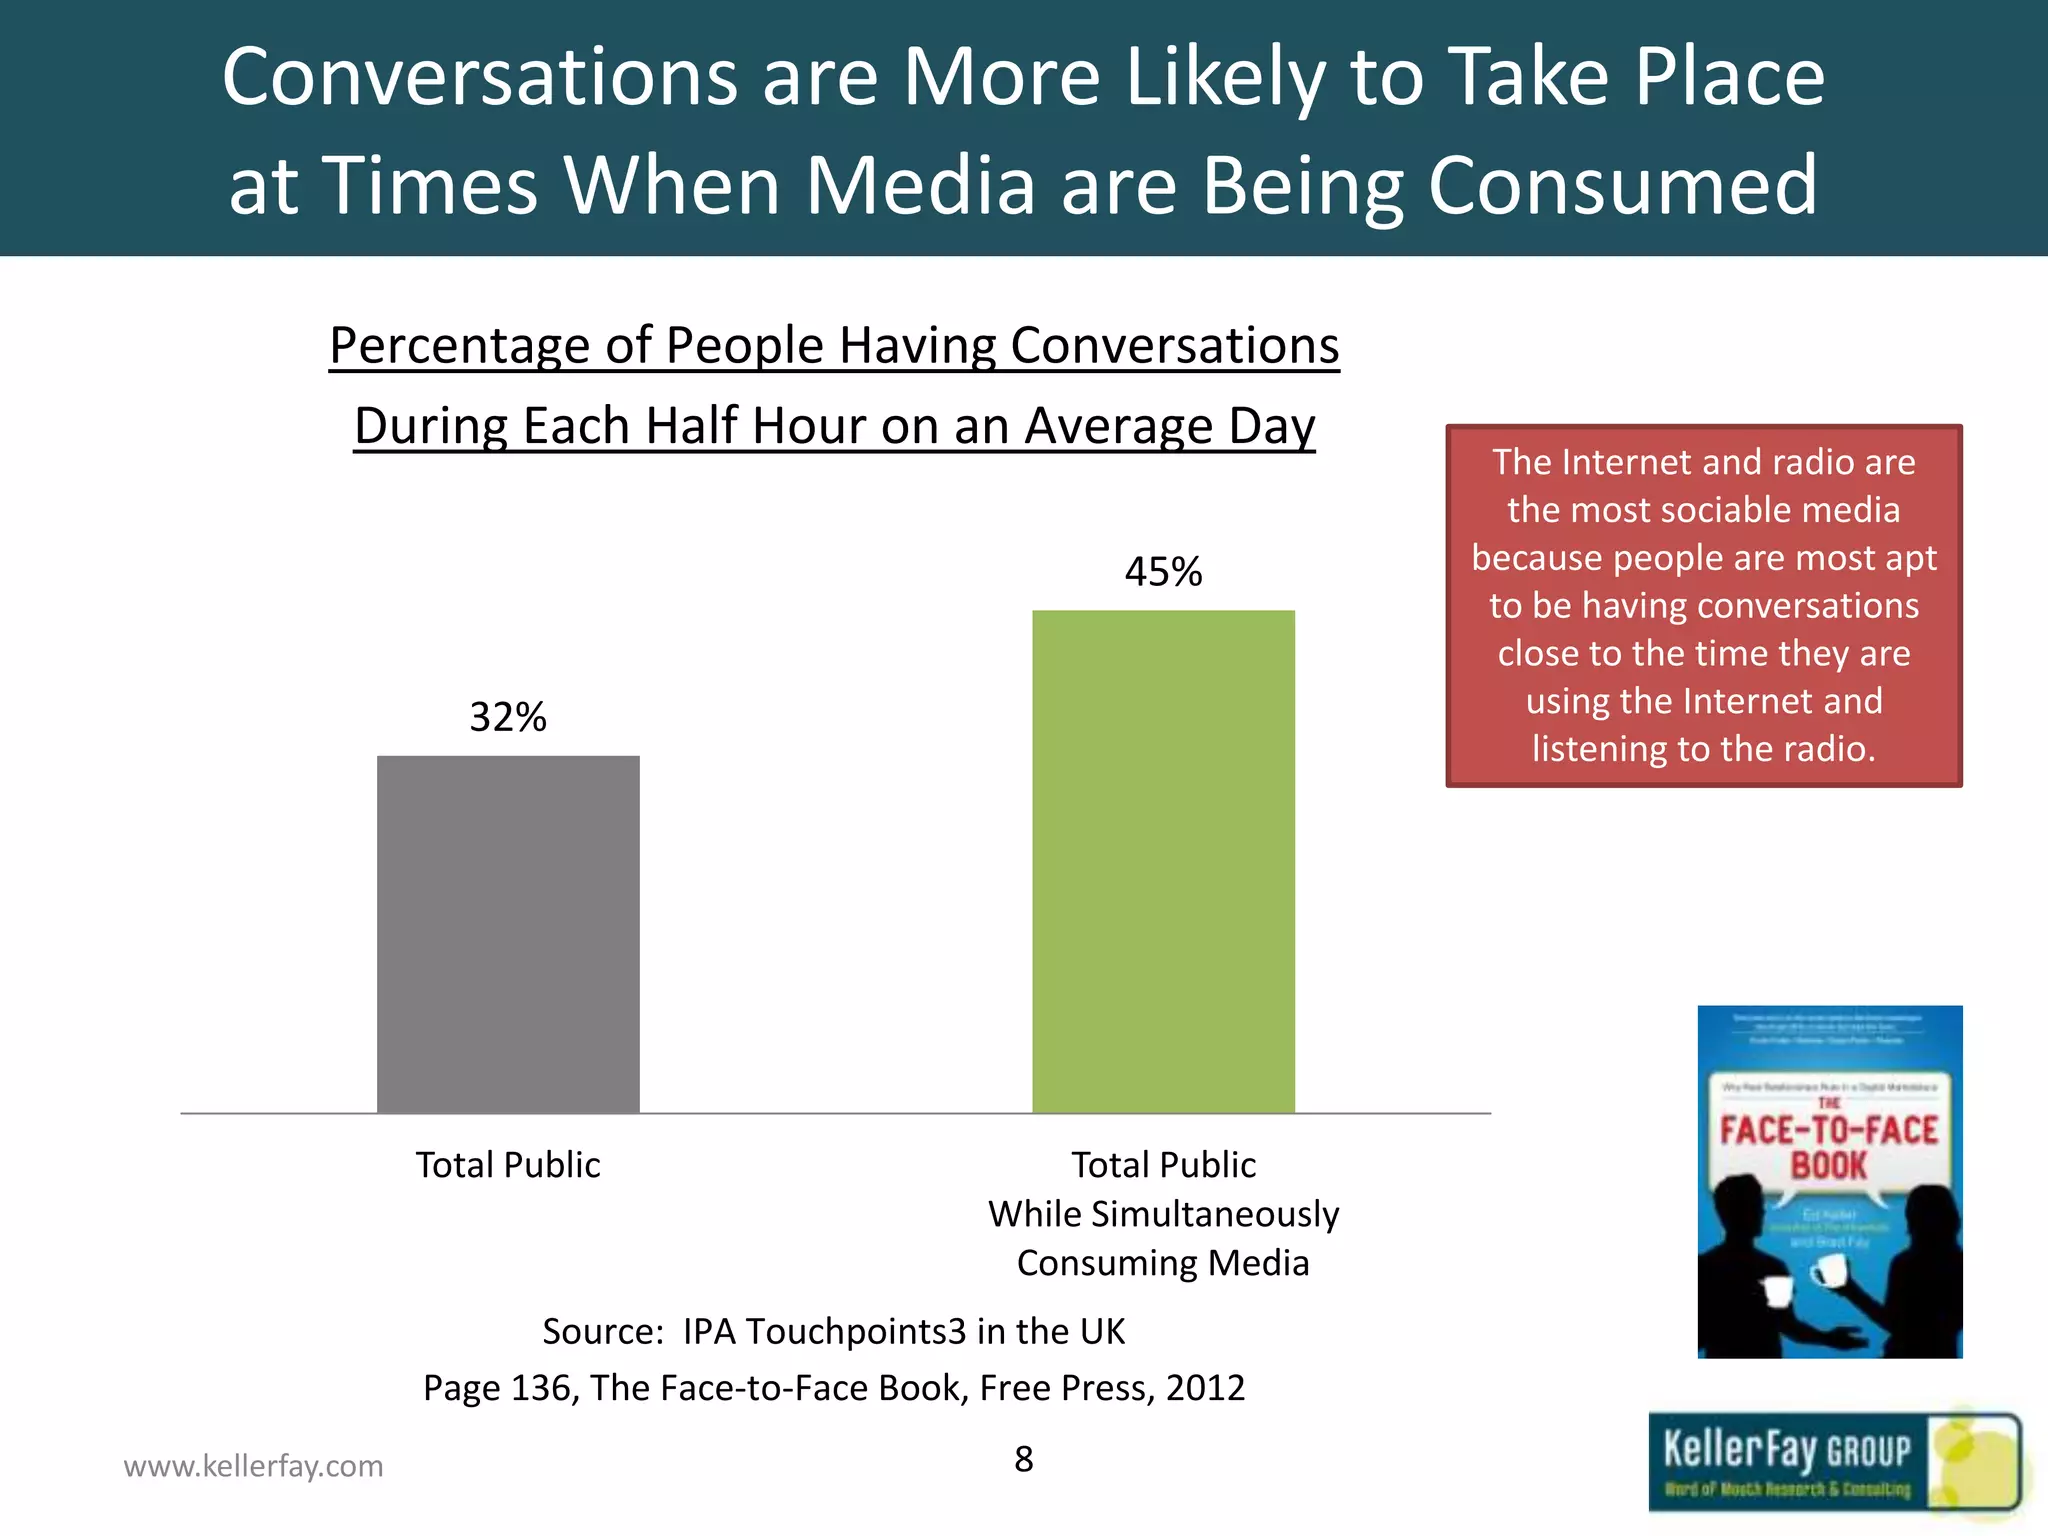
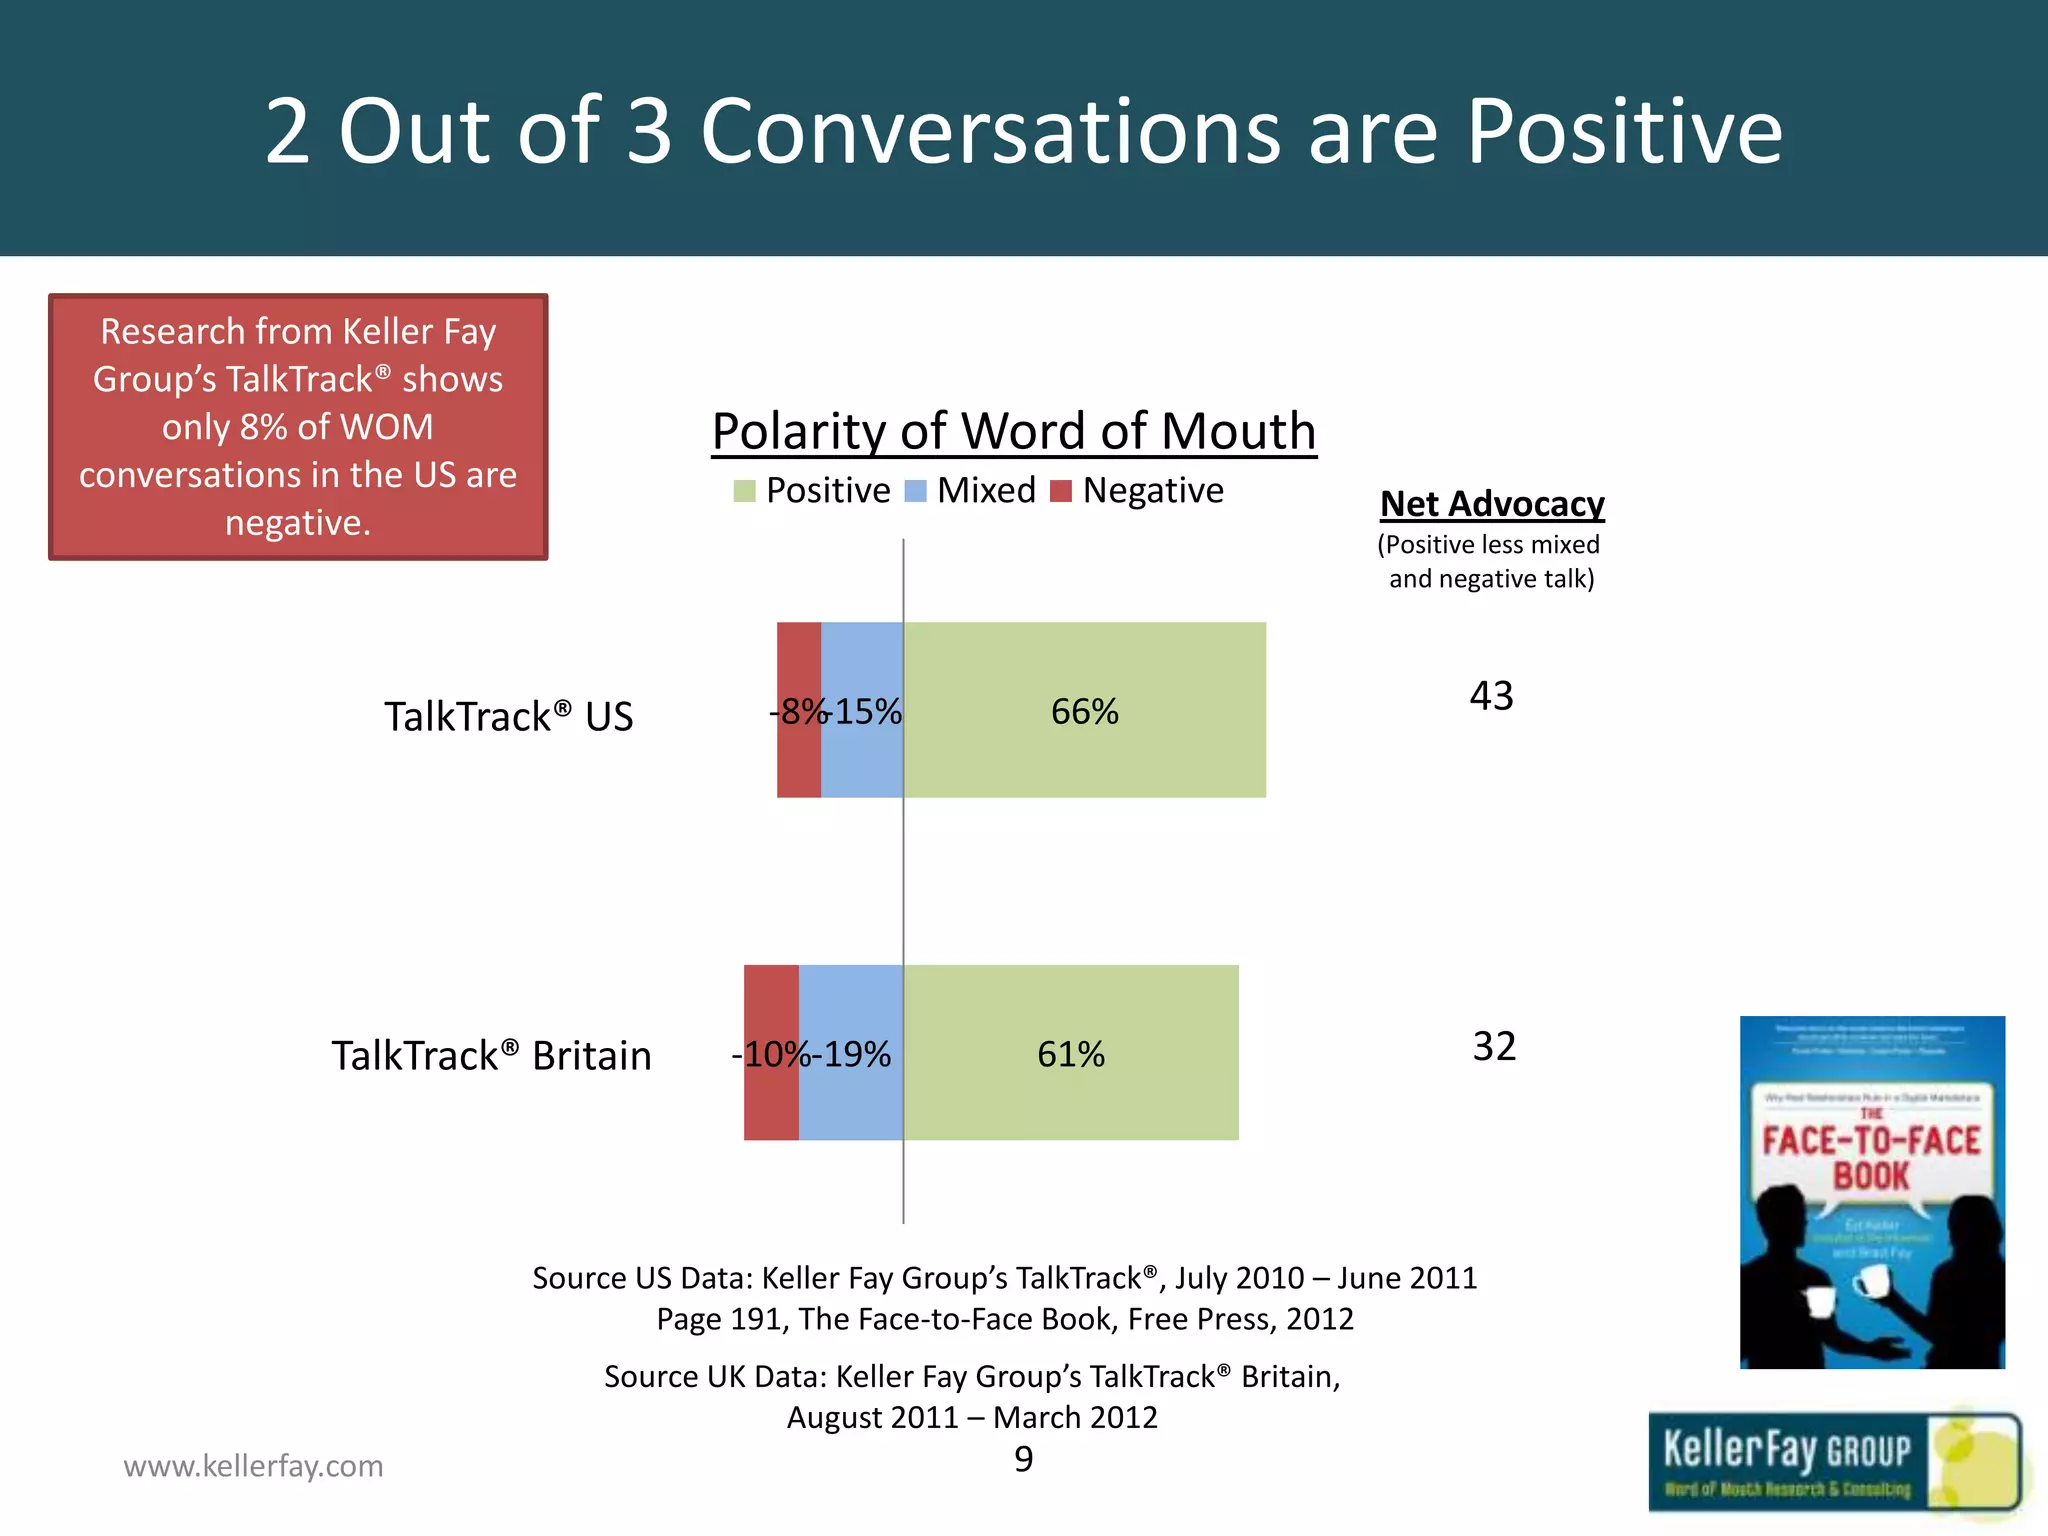
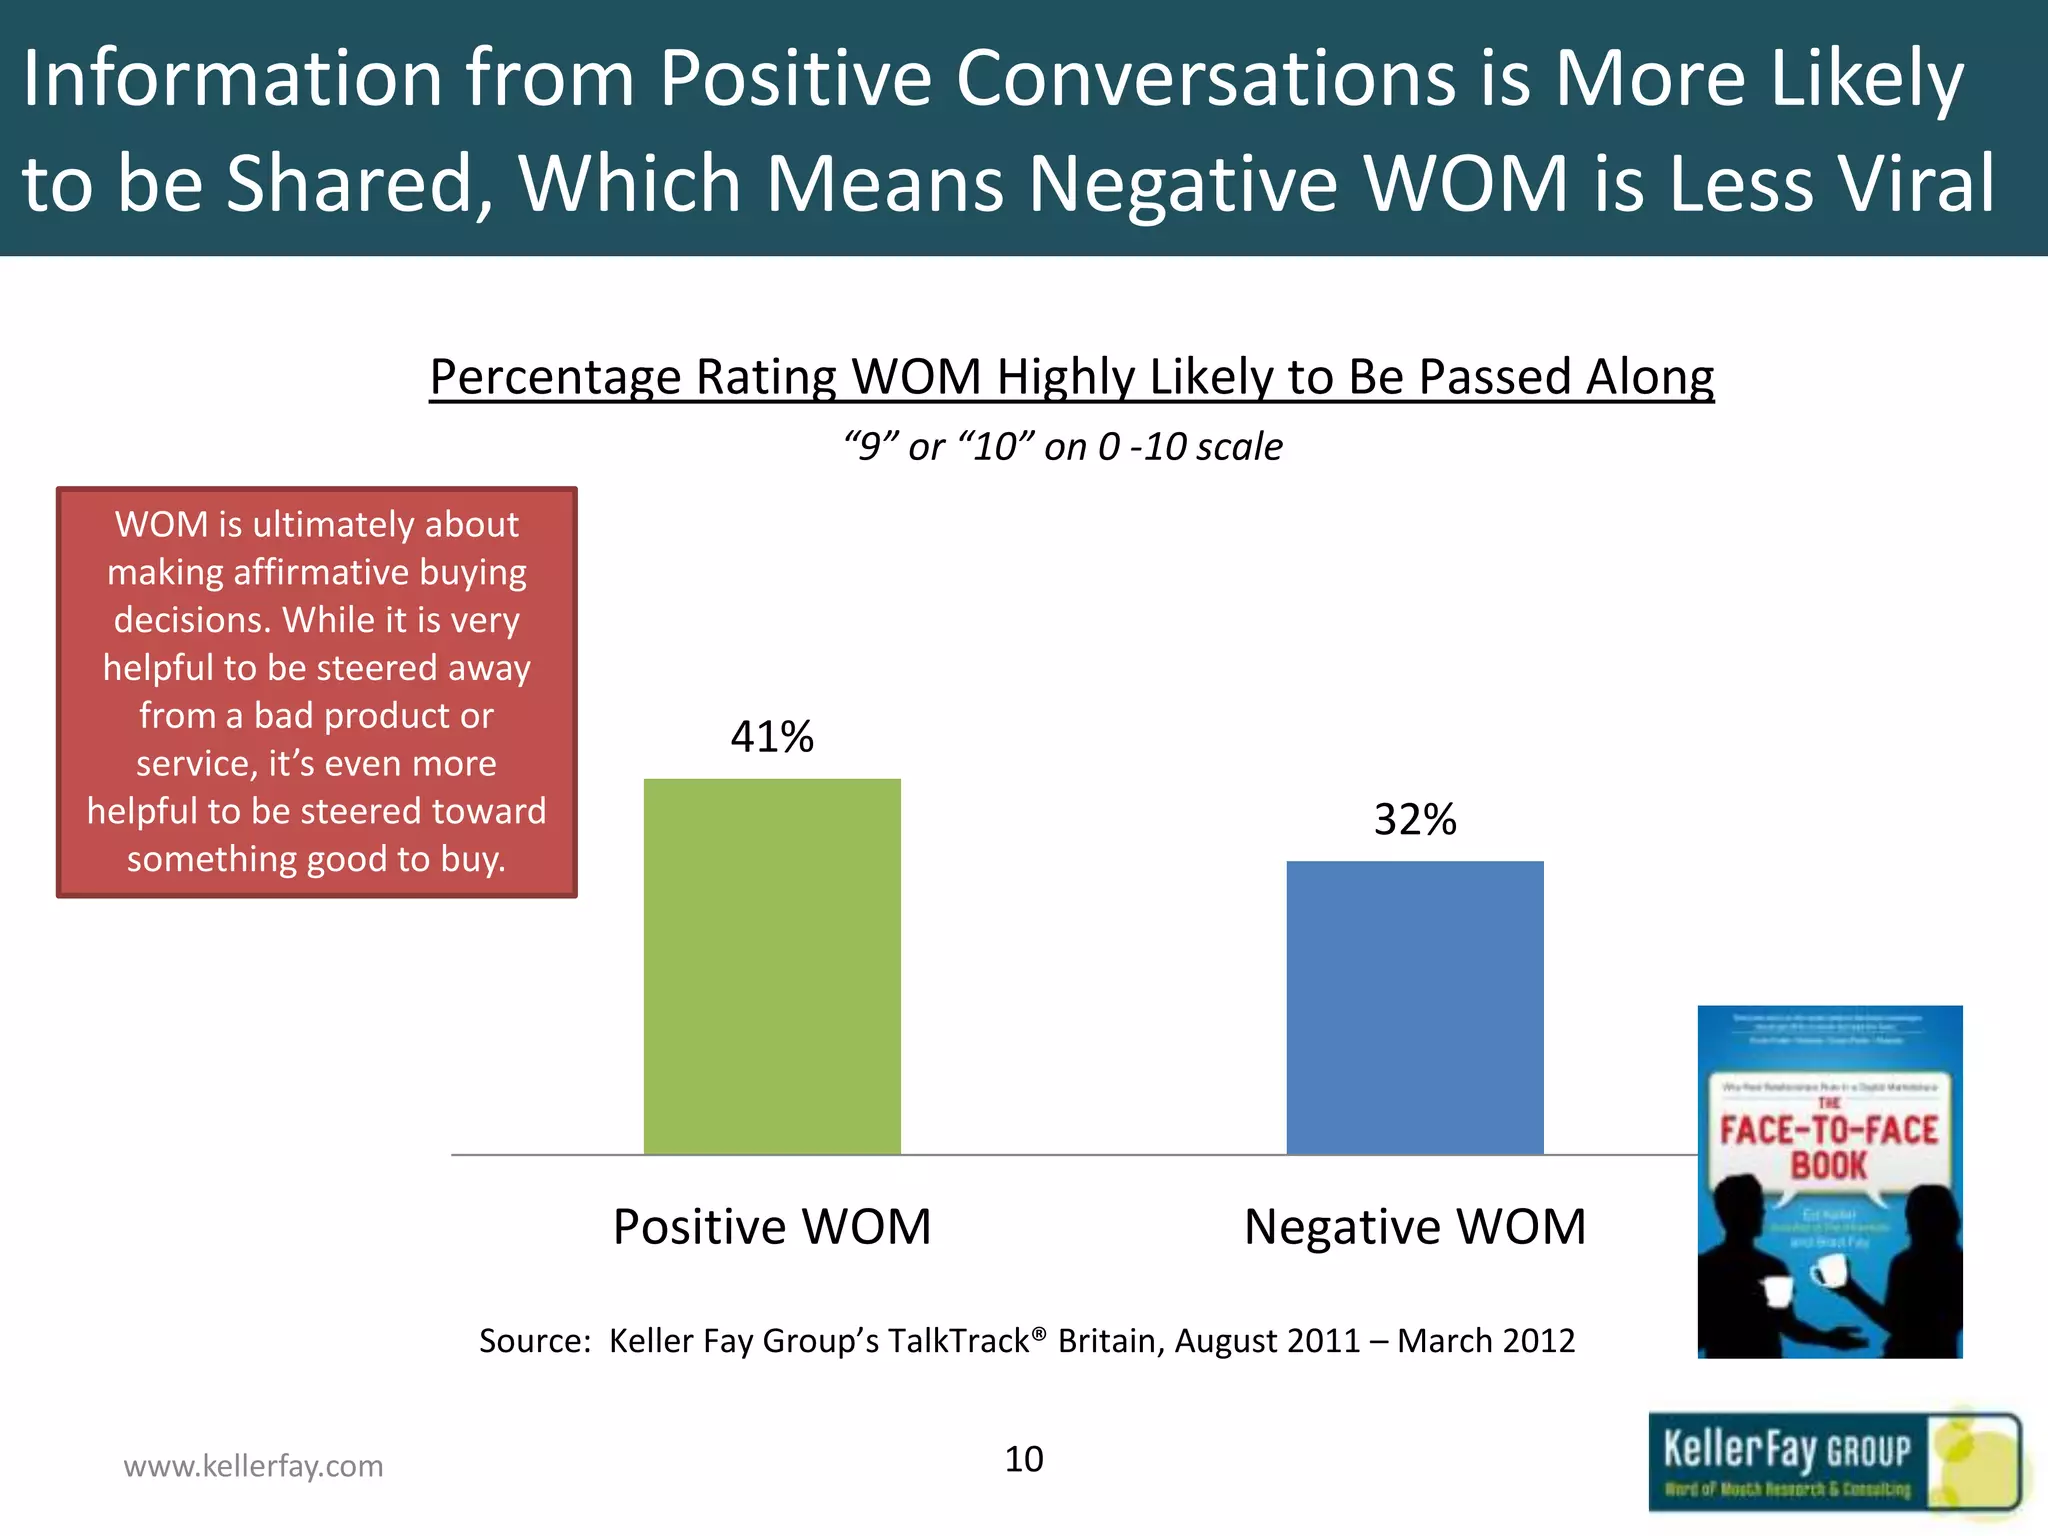
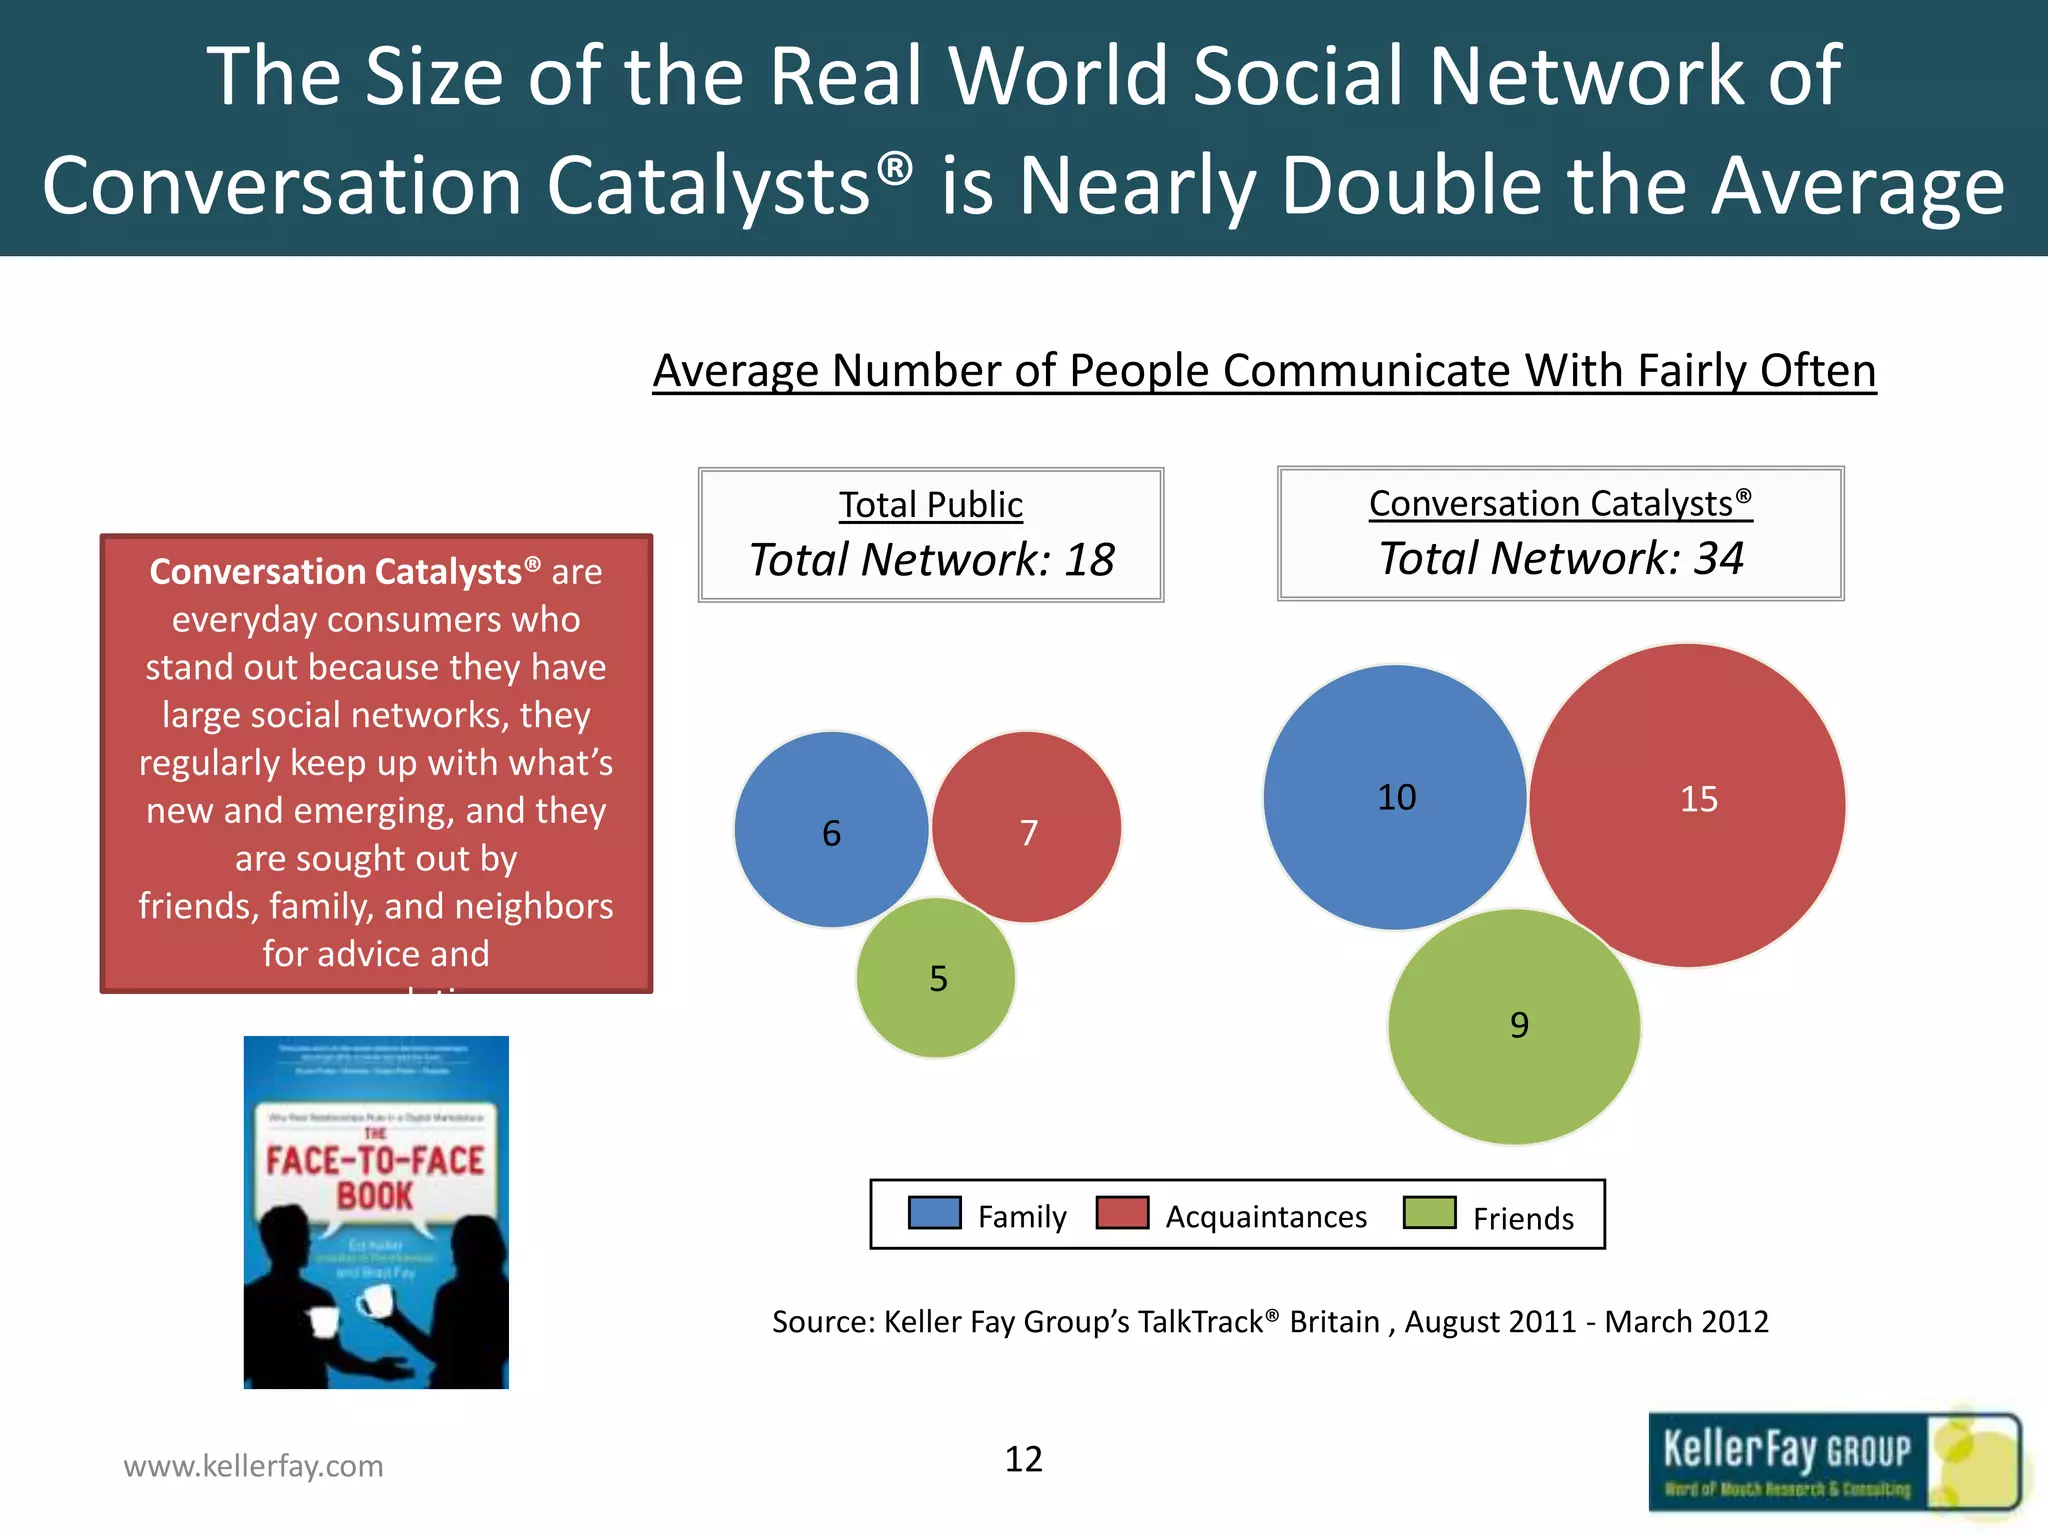
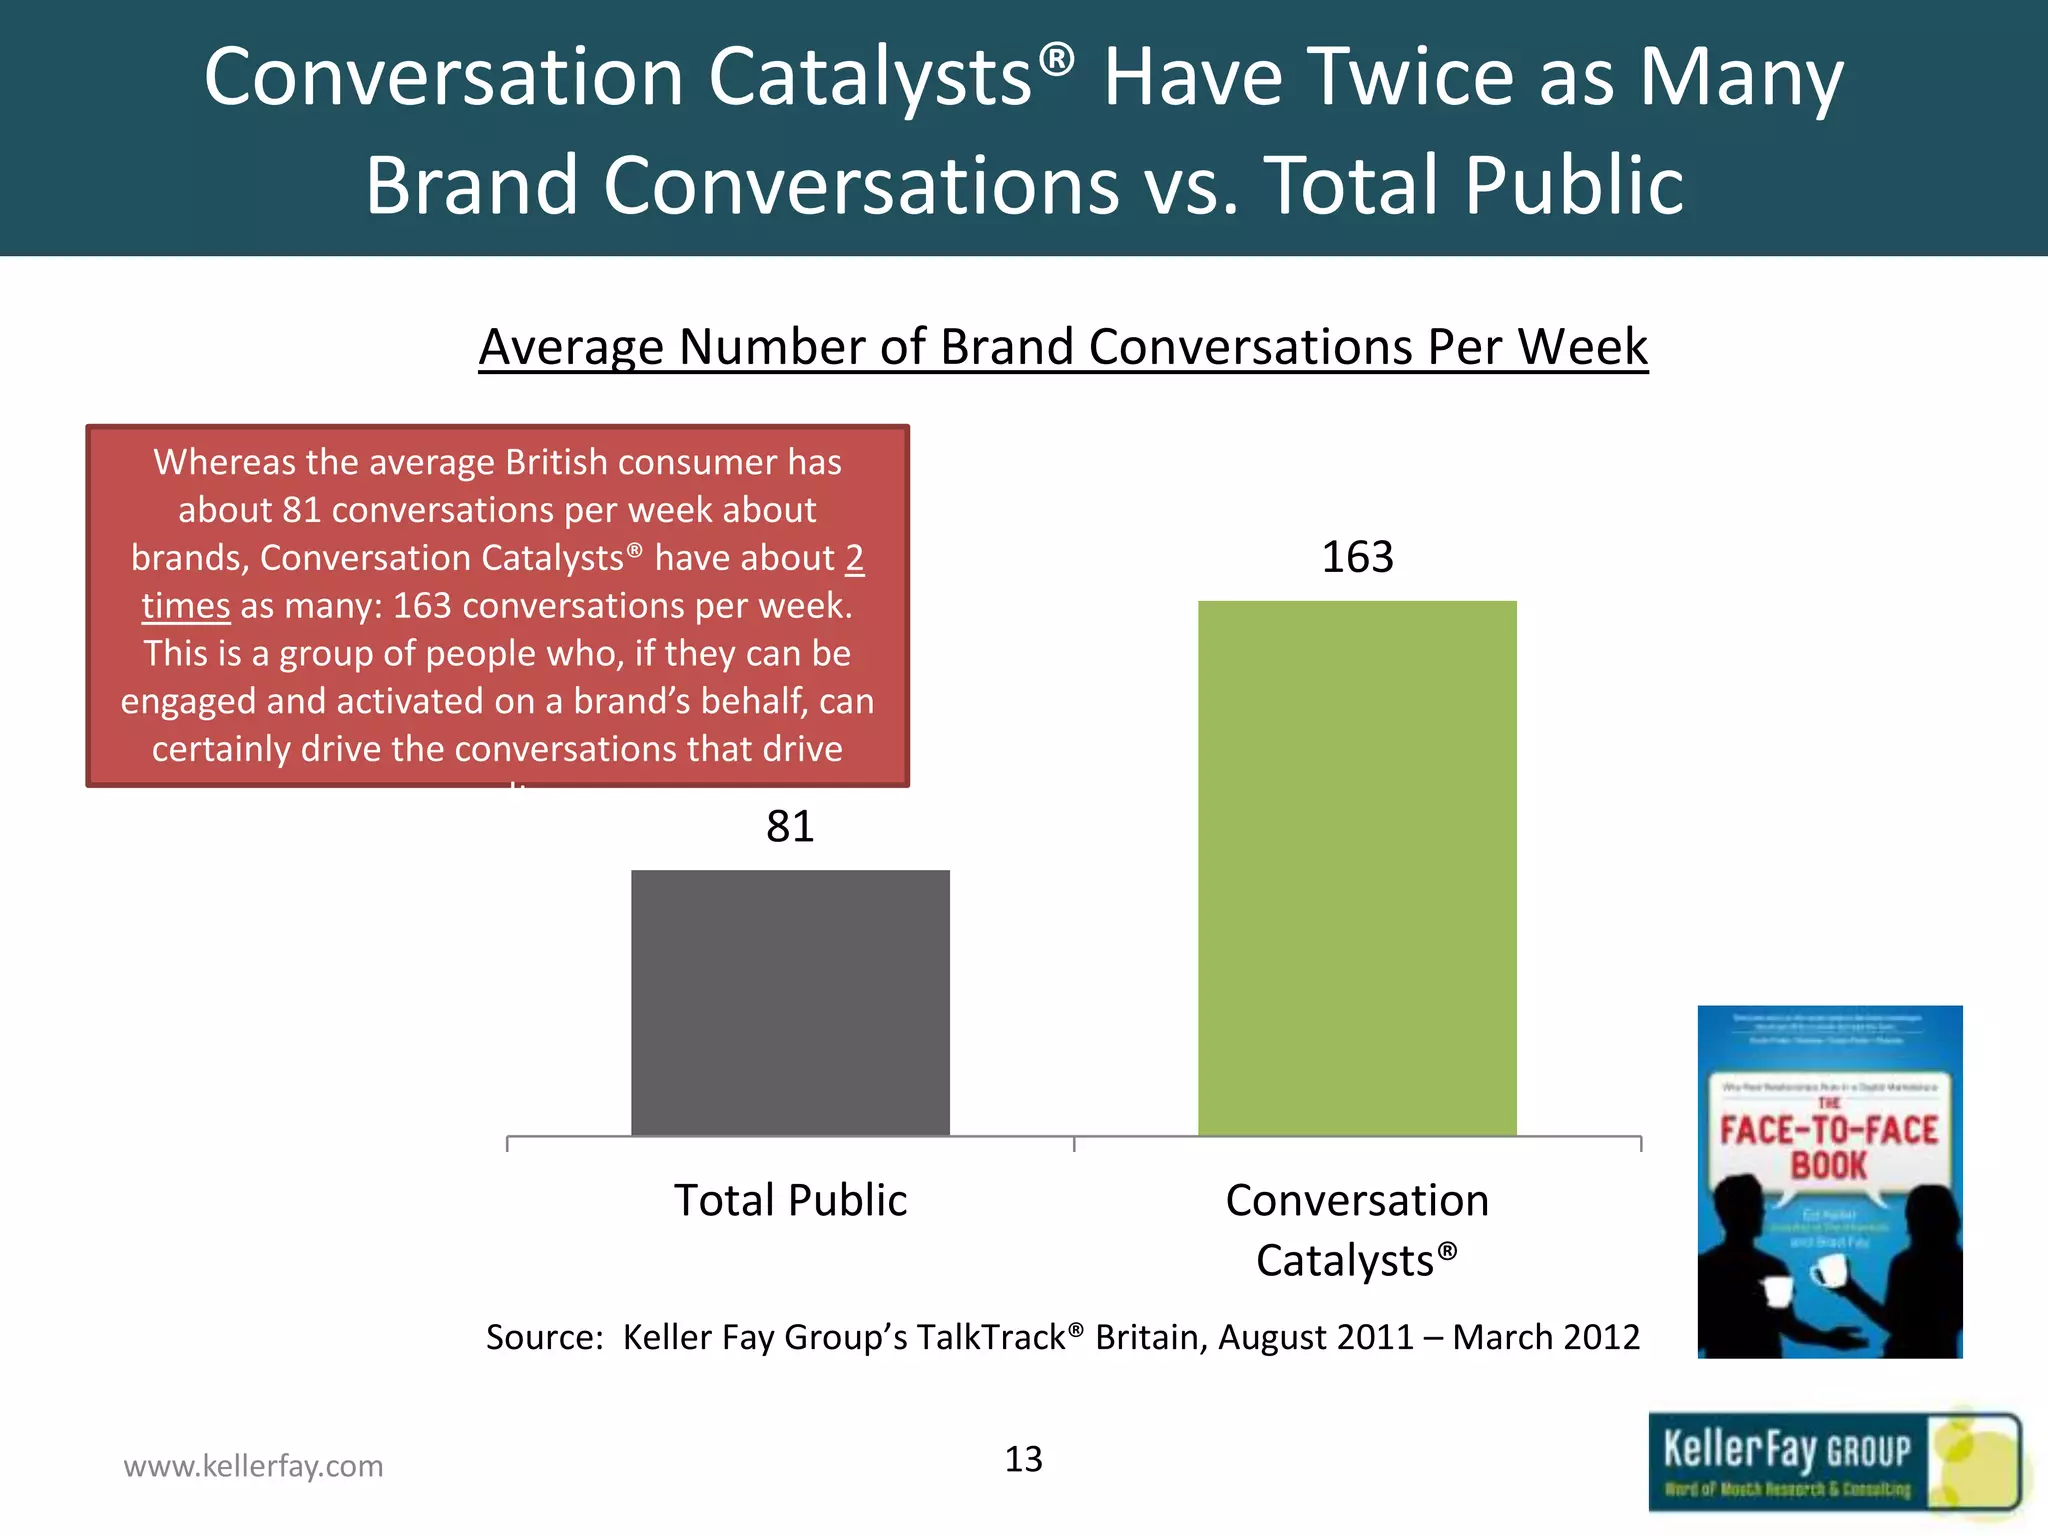
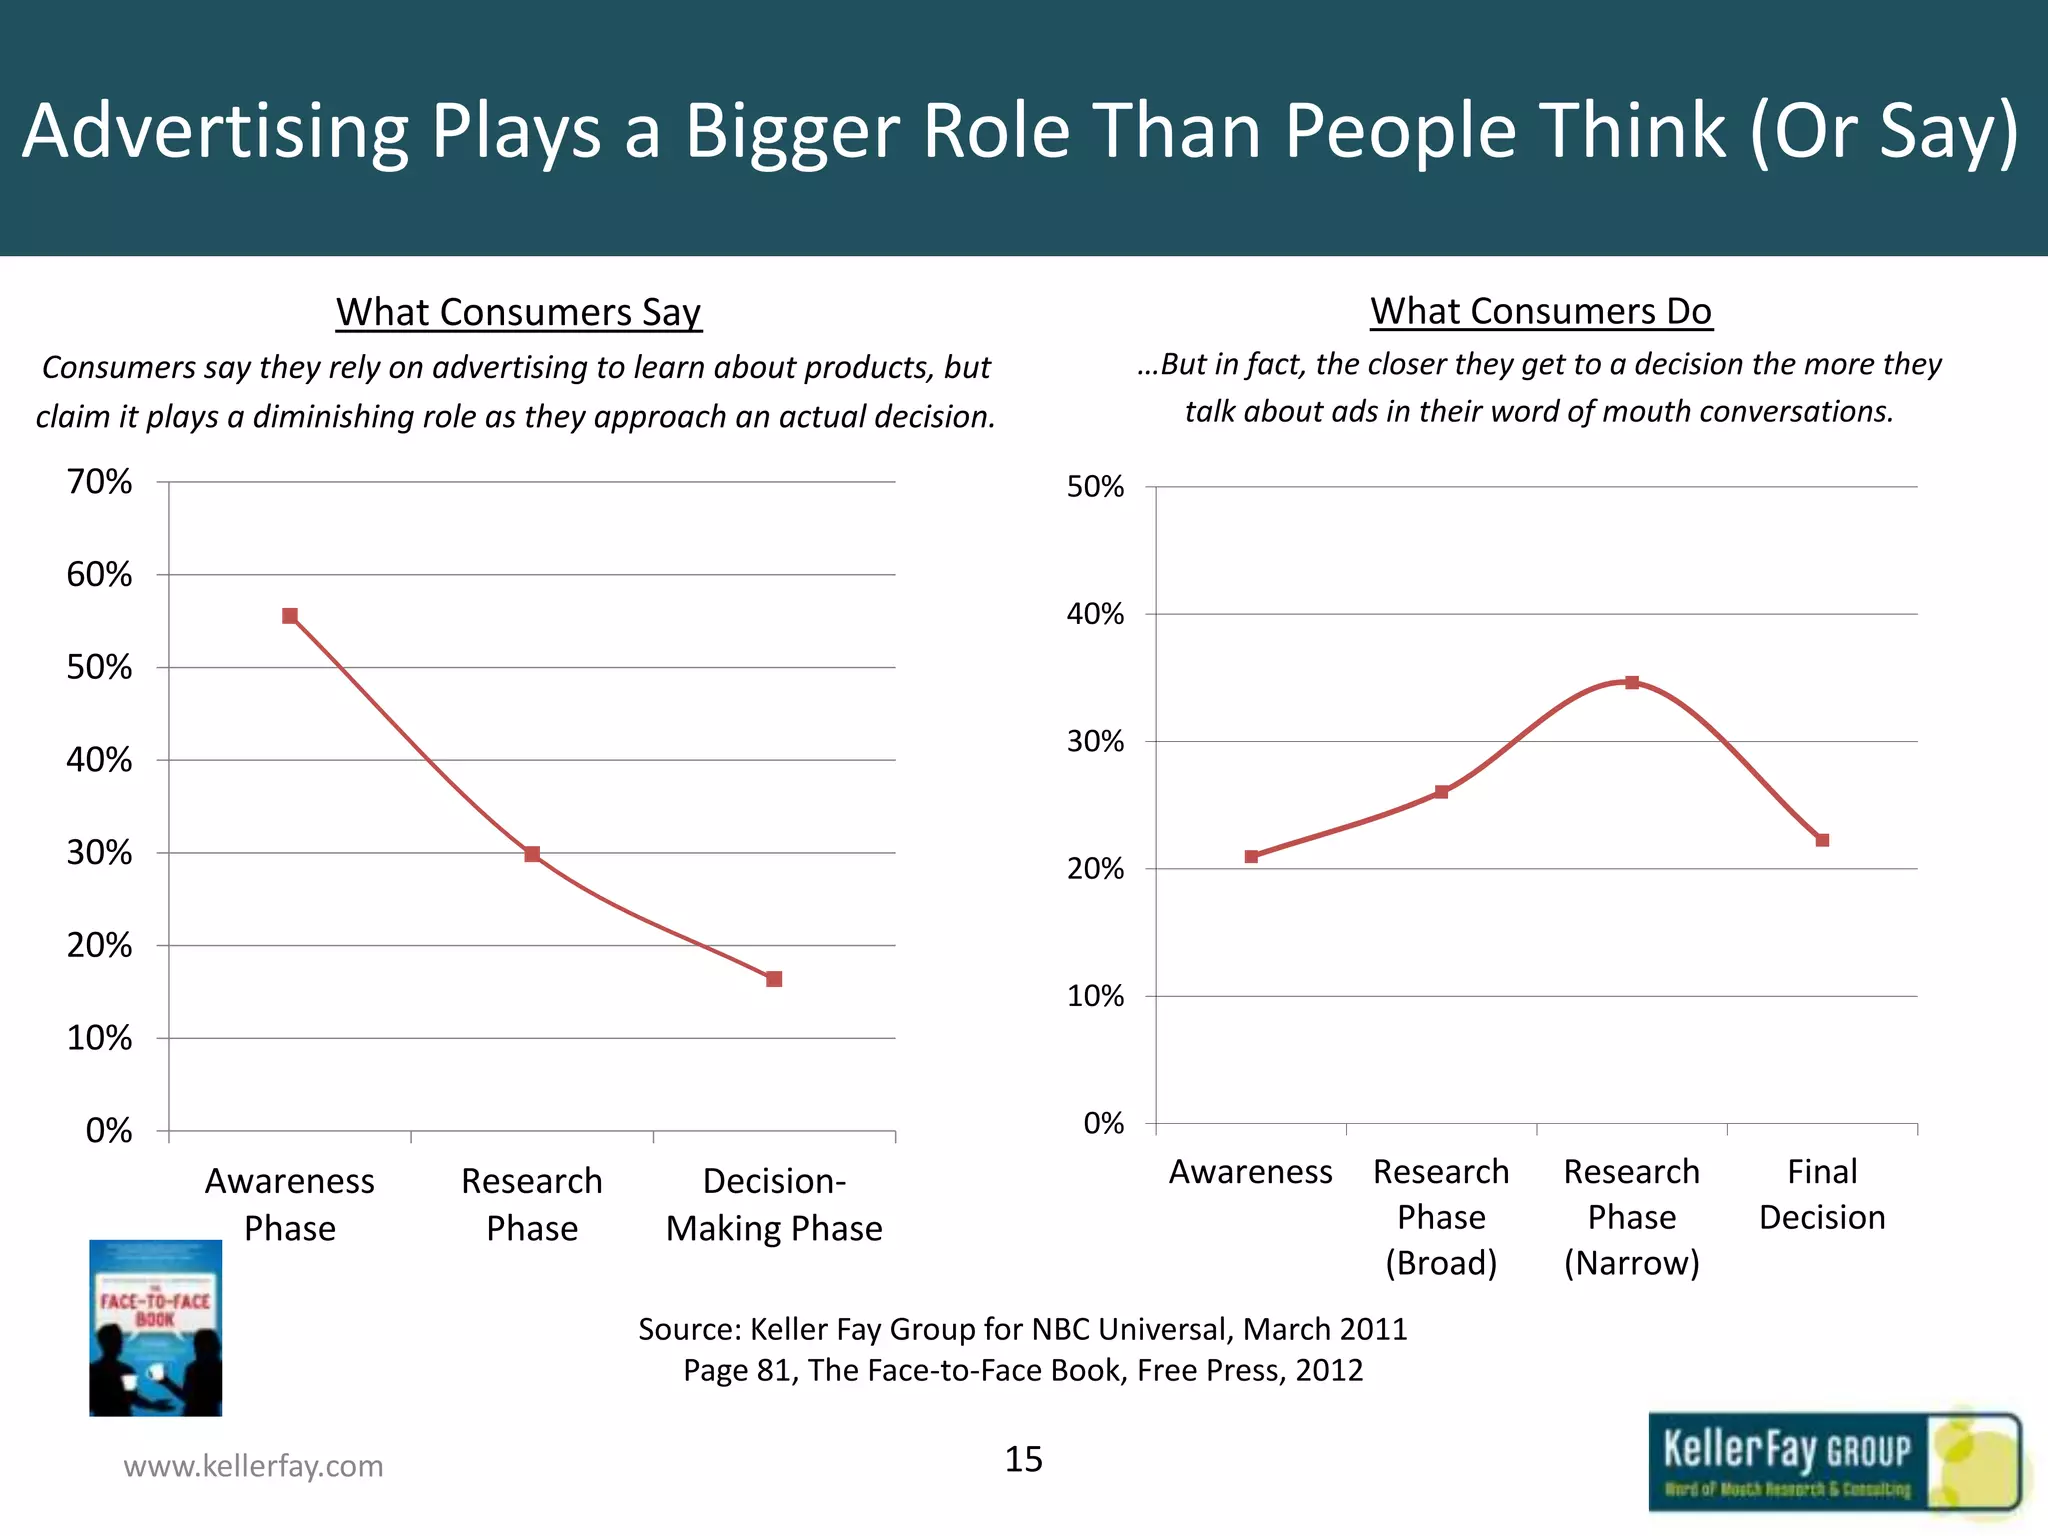
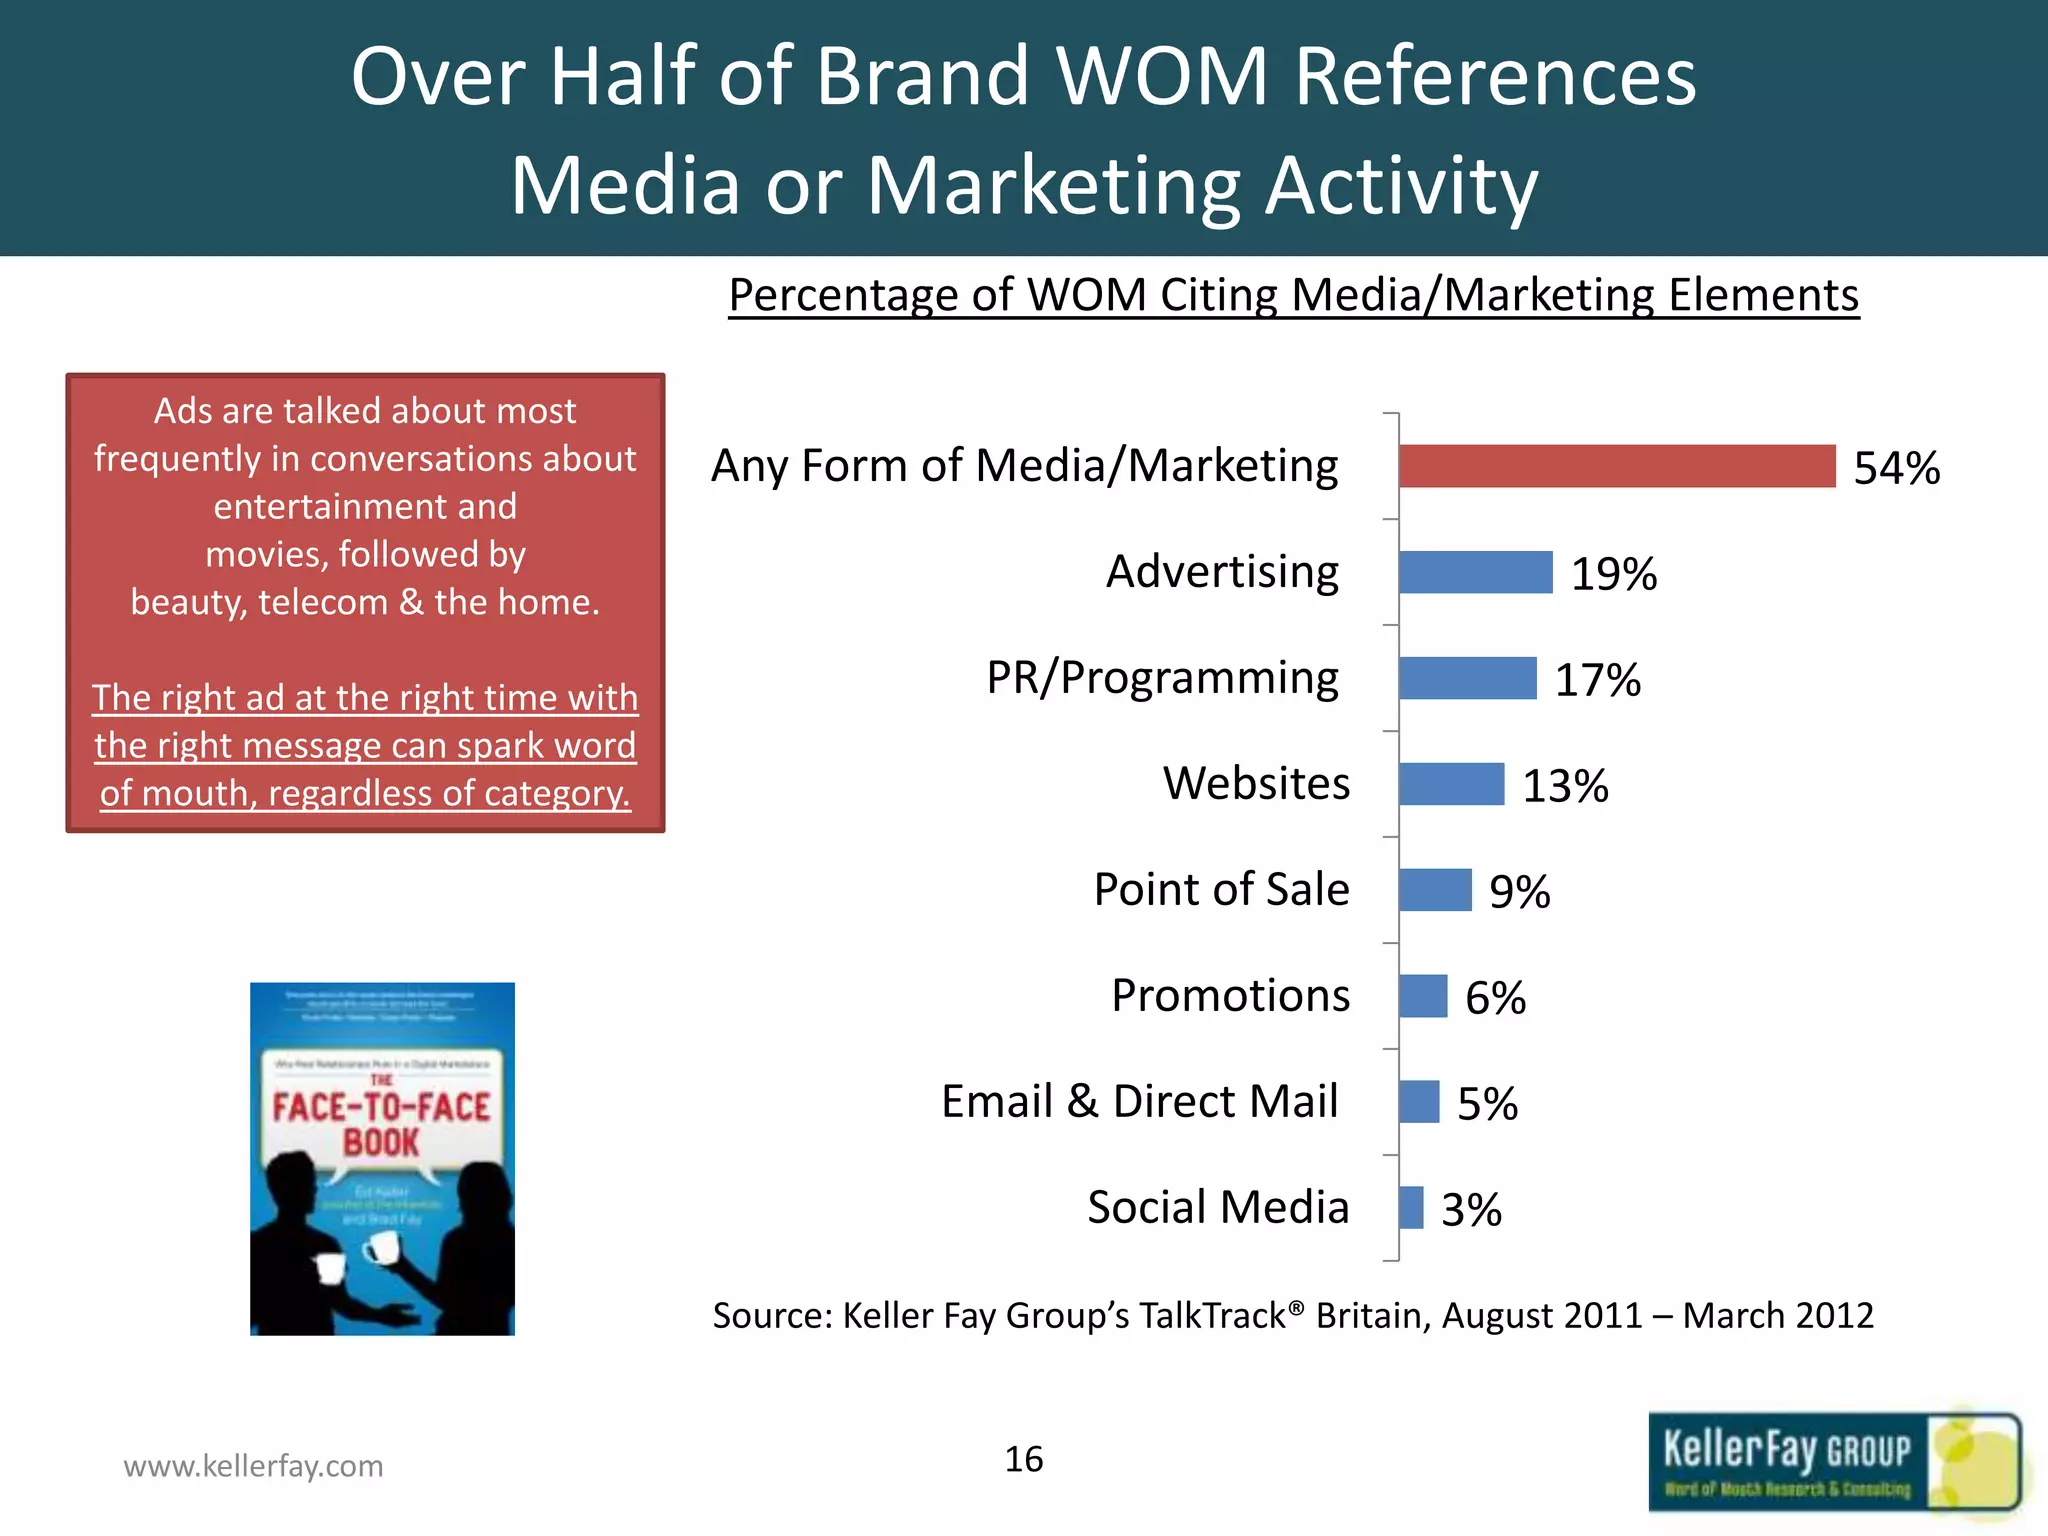
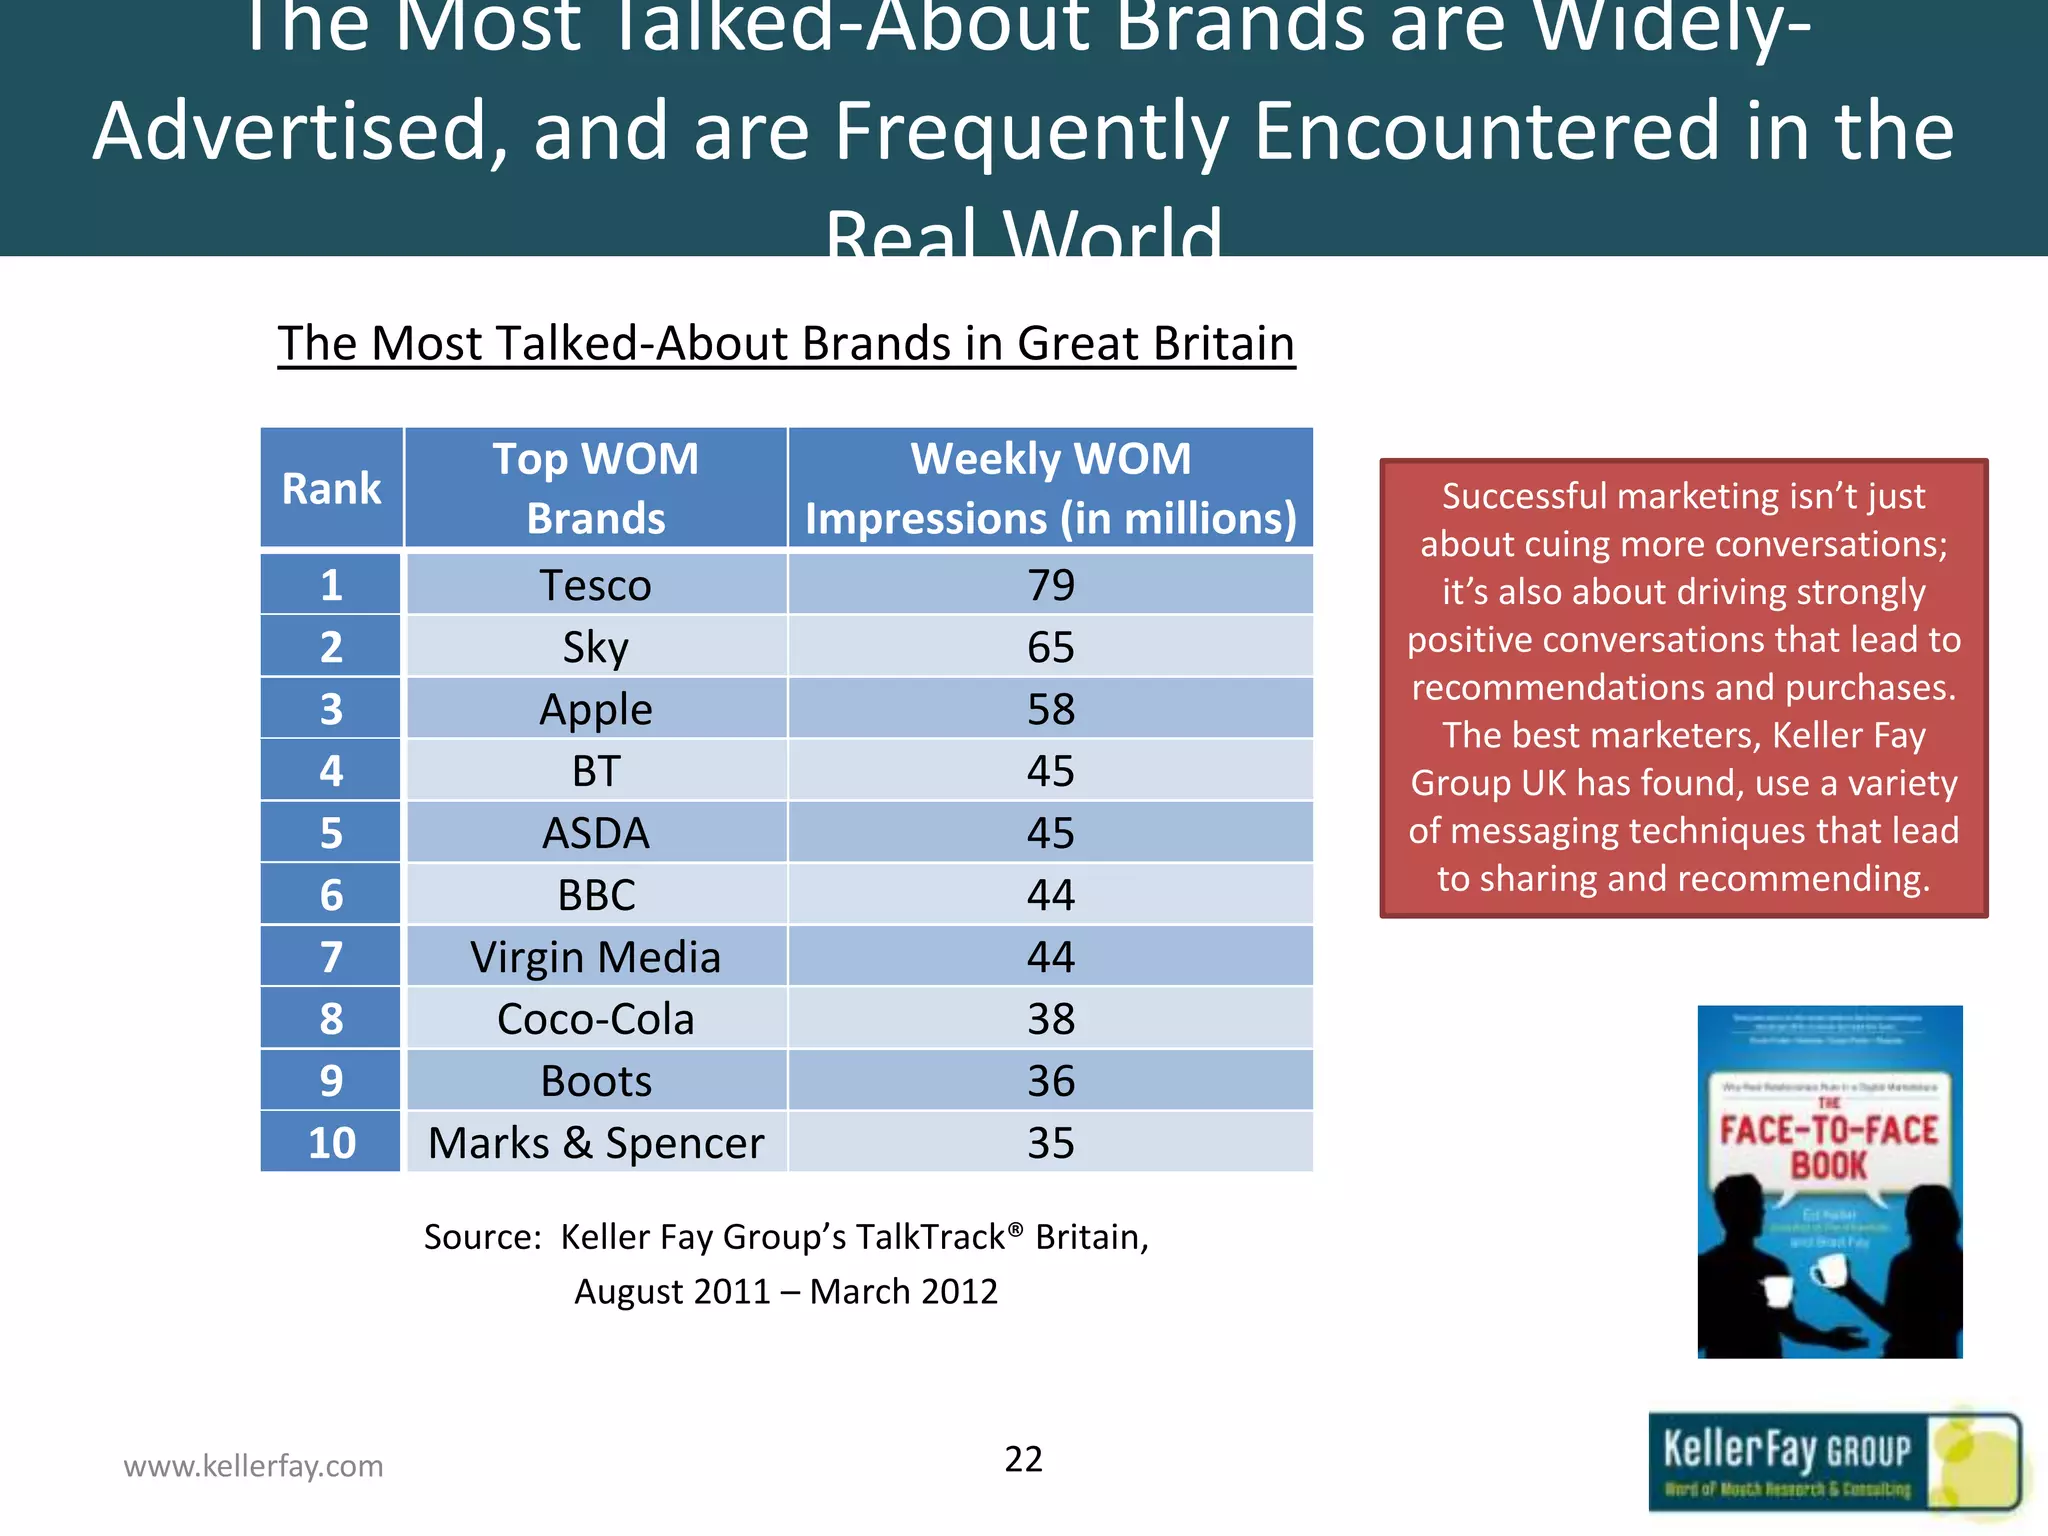
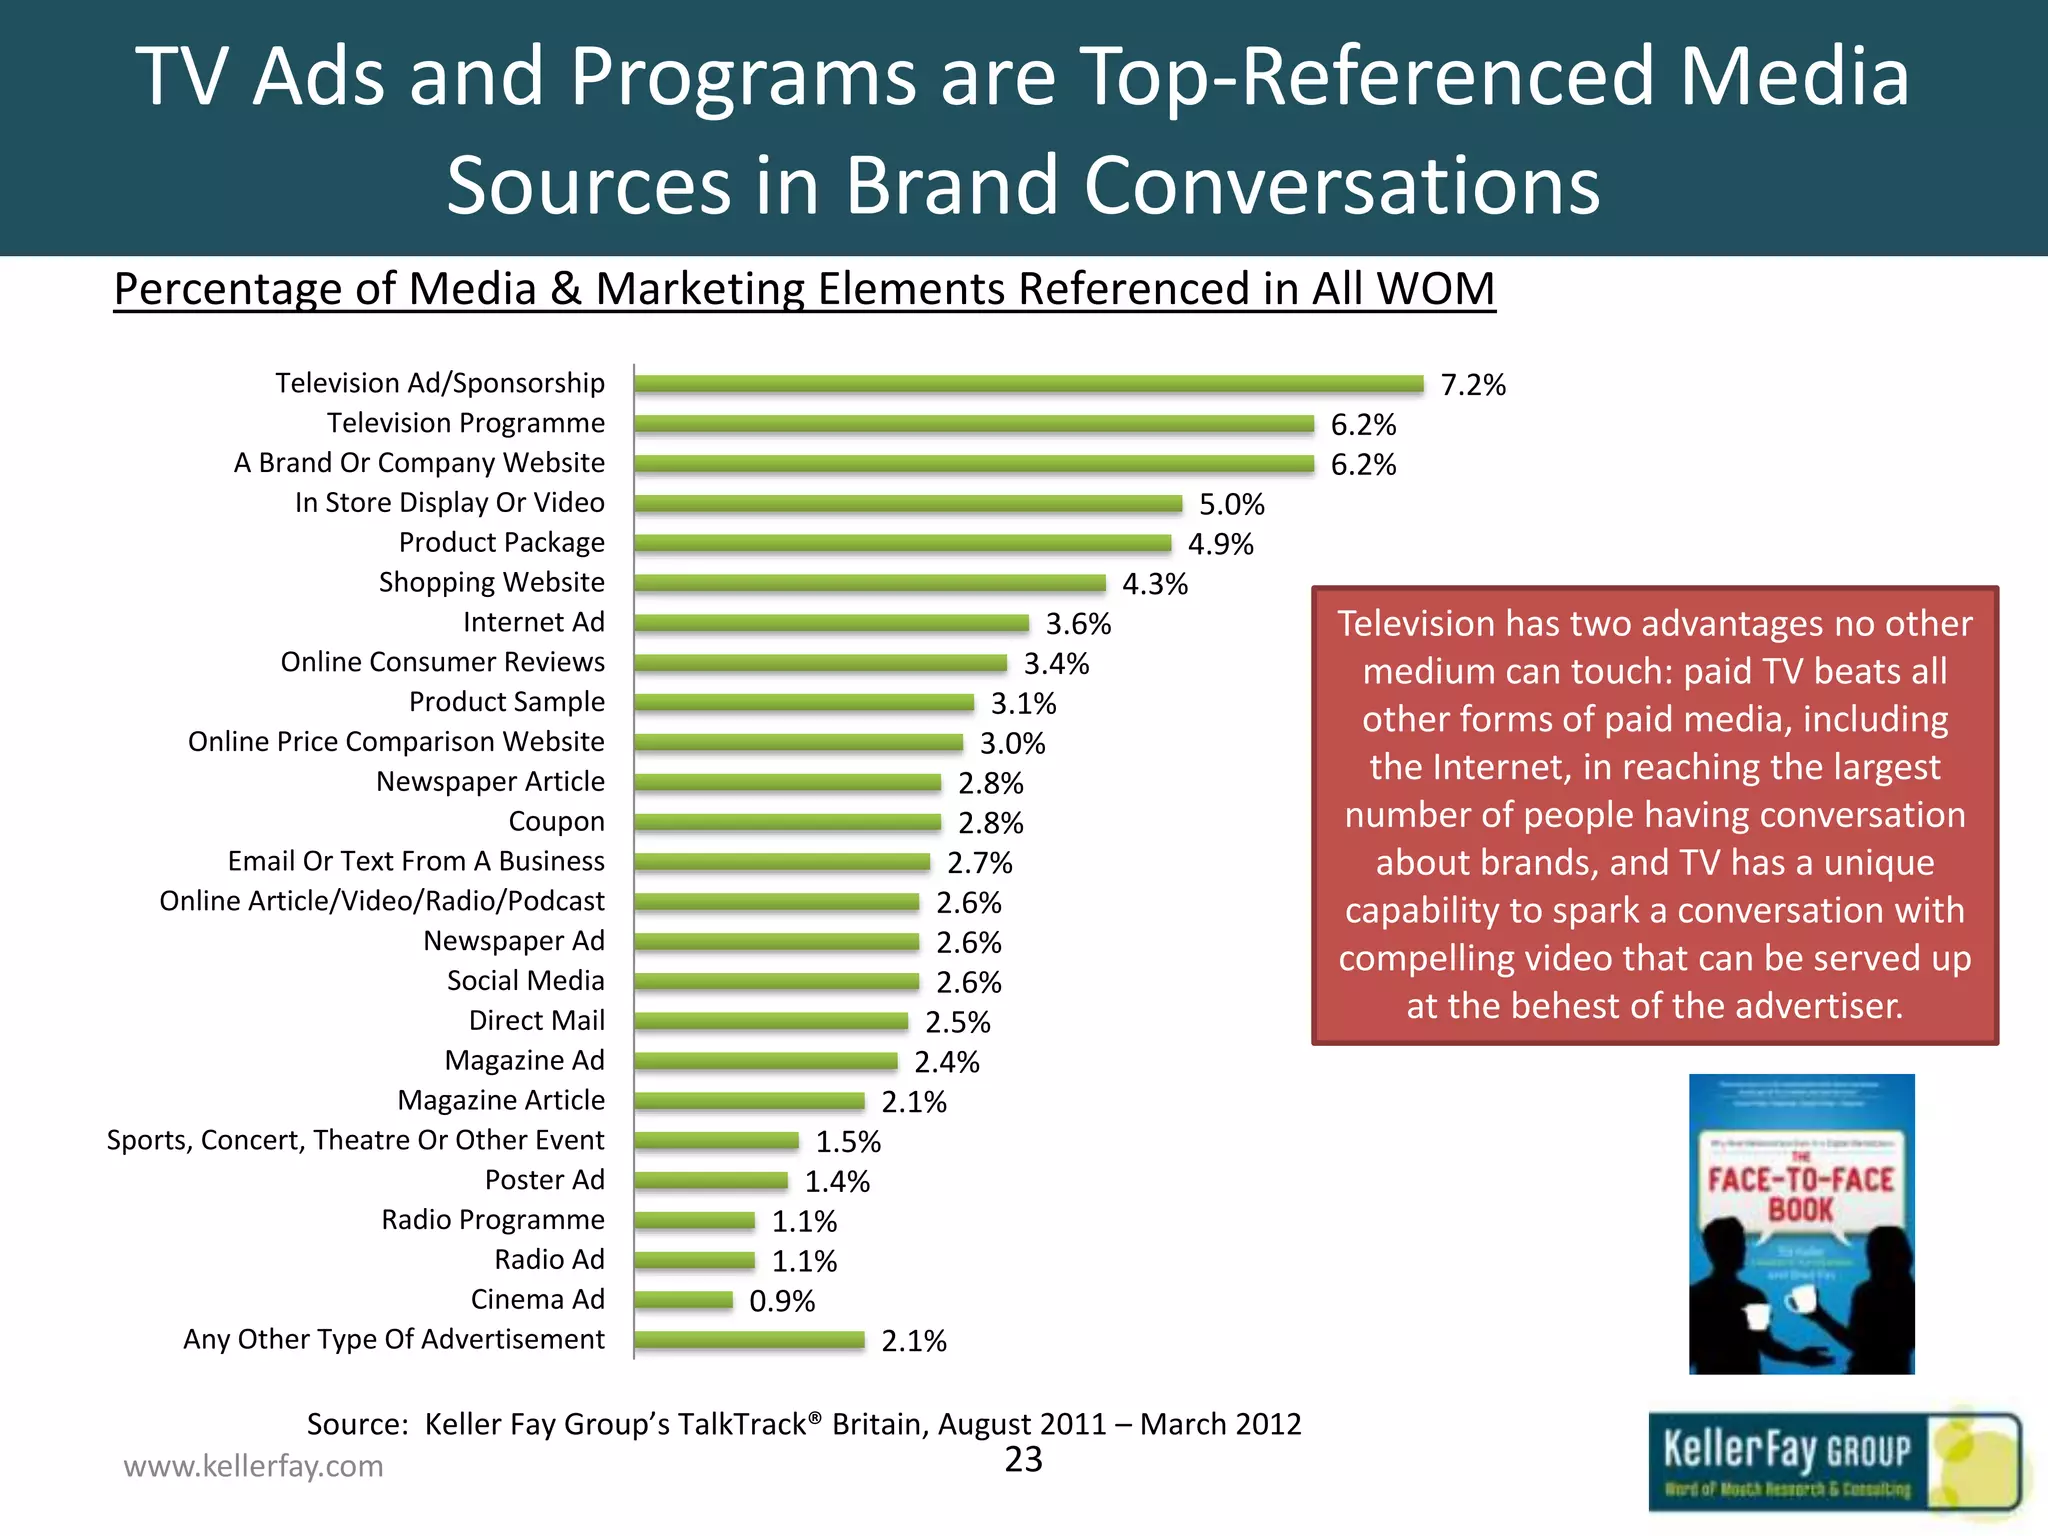
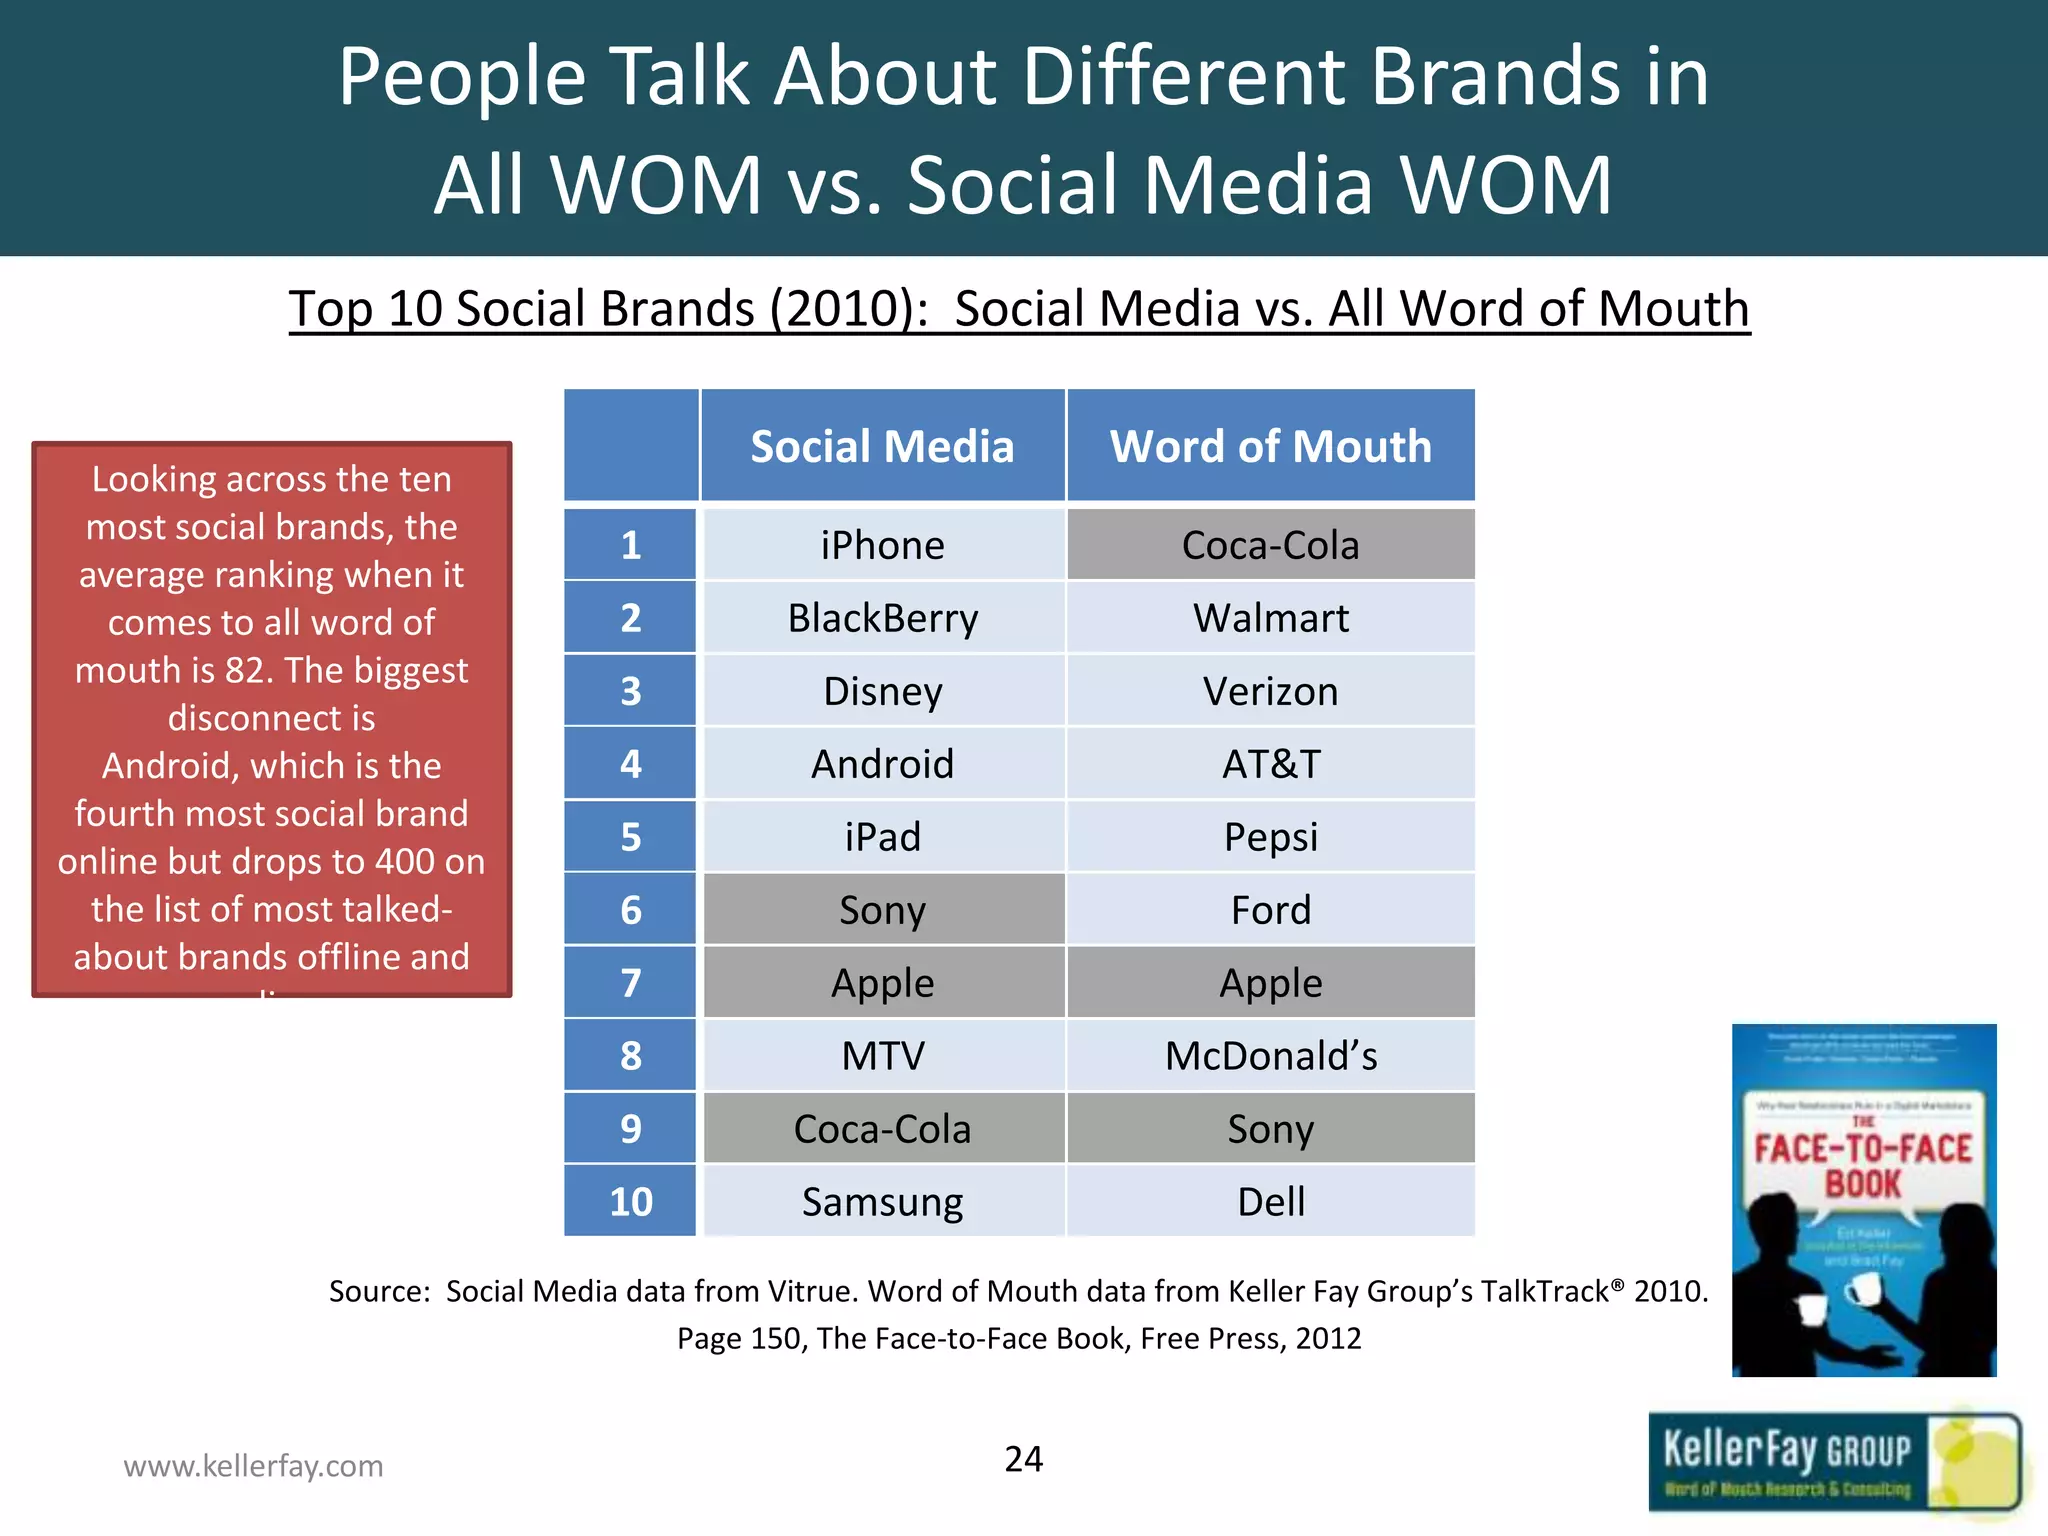
The Face-to-Face Book
              UK Version
    Summary Data Slides
May be used for non-commercial purposes with
attribution to The Face-to-Face Book and The Keller Fay
Group


                                           Prepared by
                                          Ed Keller, CEO
                                         Brad Fay, COO
                                 Steve Thomson, UK MD

                                  © 2012 Keller Fay Group
About The Face-to-Face Book

 The Face-to-Face Book presents a unique, research-backed point of view about the value of real
 relationships in a time when social media has taken center stage. Companies are pouring billions into
 Facebook and Twitter, hoping that they have finally found the holy grail of marketing. But, the fact
 remains that it is the in-person conversations that still matter most. Based on six years of research by
 the award-winning word of mouth research firm, the Keller Fay Group, the Face-to-Face Book
 presents a multitude of case studies and research studies that show that:
 •   Over 90% of conversations still take place offline, primarily face to face, with less than 8%
     occurring online
 •   Human beings are fundamentally wired to be social and are highly influenced by direct, in-person
     conversations
 •   Large companies, such as Apple, General Mills, Kimberly Clark and Toyota have been successful by
     integrating WOM into their advertising and marketing campaigns
 •   Consumers often reference other forms of media when they are talking about a brand, making the
     case that advertising can be designed to spark WOM conversation


 Although most of the data and case studies are from the US, all of the major themes we talk about
 apply to the UK – word of mouth dynamics are similar in both countries


www.kellerfay.com                                    2
About the Keller Fay Group

 About Keller Fay
 The Keller Fay Group is the first full-service market research company focused exclusively on
 word of mouth (WOM) and brand advocacy. The firm’s founders, Ed Keller and Brad Fay are
 authors of The Face-to-Face Book, “a celebration of the supremely social nature of all human
 beings and how that drives the consumer marketplace.” The book is based on research from
 Keller Fay’s TalkTrack® program is the only continuous study of WOM in all channels (online and
 offline) designed to closely monitor and measure the marketing-relevant attributes of actual
 consumer conversations. TalkTrack® was launched in the U.S. in 2006 and in the United
 Kingdom in 2011. For further information about the Keller Fay Group, visit our website
 www.kellerfay.com.

 Join our Network:

 www.facebook.com/kellerfay
 www.twitter.com/kellerfay
 www.slideshare.net/kellerfay/
 www.linkedin.com/company/keller-fay-group

 CONTACT: Steve Thomson, sthomson@kellerfay.com, +44 7769 289590

www.kellerfay.com                               3
Table of Contents


 Section I: Word of Mouth Overview Stats……….page 5
 Section II: Conversation Catalysts®…………………page 11
 Section III: Advertising and Word of Mouth……page 14
 Section IV: The Internet and Word of Mouth….page 18
 Section V: Brands and Word of Mouth…………...page 21


www.kellerfay.com          4
WOM Overview Stats

                          WOM Stats


www.kellerfay.com             5
WOM Conversations of UK Consumers Largely Take
  Place Offline, Even More Than US Consumers
                                Mode of Conversations
                                                                                                                          UK      US
                           UK                                                     US                    Total Offline    94%      90%
                                                                                                        Total Online      5%      8%
            Other                                                 Other
Social Media 1%                                                    2%
                                                      Social Media
     1%                                                                                                          Research from Keller
                                                           2%
Instant/Text                                                                                                      Fay Group UK & US
  Message                                             Instant/Text                                              shows 94% and 90% of
     2%                                                 Message                                                  WOM conversations
                 Phone                                     3%                                                    are offline, while 5%
   Email                                                                                                          and 8% are online,
                  11%                                                    Phone           Face to Face
    2%                          Face to Face             Email                                                       respectively.
                                                                          14%                76%
                                    83%                   3%


     Source: Keller Fay Group’s TalkTrack® Britain,     Source: Keller Fay Group’s TalkTrack®, July 2010 – June 2011
              August 2011 – March 2012                       Page 18, The Face-to-Face Book, Free Press, 2012


    www.kellerfay.com                                                6
3.3 Billion Weekly WOM Impressions Happen Offline

                   Weekly Volume of WOM Impressions (in Billions)
   According to Keller Fay Group’s Offline vs. Online
   TalkTrack®, there are about 3.3
 billion offline and 0.2 billion online
                                                                       3.3
 weekly WOM impressions. It’s not
  so much that online is small, but
   rather that offline is enormous.

    **WOM Impressions are projected by
 taking the average number of daily brand
  mentions per respondent and multiplying
 it against the population 13-69 (according
              to UK Census).**


                                          0.2

                                       Online                        Offline

                     Source: Keller Fay Group’s TalkTrack® Britain, August 2011 – March 2012

 www.kellerfay.com                                       7
Conversations are More Likely to Take Place
      at Times When Media are Being Consumed
             Percentage of People Having Conversations
              During Each Half Hour on an Average Day
                                                                             The Internet and radio are
                                                                               the most sociable media
                                                             45%            because people are most apt
                                                                             to be having conversations
                                                                              close to the time they are
                       32%                                                      using the Internet and
                                                                                 listening to the radio.


                    Total Public                         Total Public
                                                     While Simultaneously
                                                      Consuming Media
                           Source: IPA Touchpoints3 in the UK
                    Page 136, The Face-to-Face Book, Free Press, 2012
www.kellerfay.com                                      8
2 Out of 3 Conversations are Positive
 Research from Keller Fay
 Group’s TalkTrack® shows
    only 8% of WOM                        Polarity of Word of Mouth
conversations in the US are                   Positive     Mixed      Negative
         negative.                                                                          Net Advocacy
                                                                                            (Positive less mixed
                                                                                             and negative talk)


                  TalkTrack® US                -8%-15%               66%                            43


               TalkTrack® Britain           -10%-19%                 61%                            32


                              Source US Data: Keller Fay Group’s TalkTrack®, July 2010 – June 2011
                                      Page 191, The Face-to-Face Book, Free Press, 2012
                                   Source UK Data: Keller Fay Group’s TalkTrack® Britain,
                                               August 2011 – March 2012
  www.kellerfay.com                                              9
Information from Positive Conversations is More Likely
to be Shared, Which Means Negative WOM is Less Viral

                       Percentage Rating WOM Highly Likely to Be Passed Along
                                                “9” or “10” on 0 -10 scale
   WOM is ultimately about
  making affirmative buying
   decisions. While it is very
  helpful to be steered away
     from a bad product or
     service, it’s even more
                                         41%
 helpful to be steered toward                                                     32%
    something good to buy.


                                 Positive WOM                             Negative WOM
                         Source: Keller Fay Group’s TalkTrack® Britain, August 2011 – March 2012


   www.kellerfay.com                                      10
Conversation Catalysts®

                            WOM Stats


www.kellerfay.com              11
The Size of the Real World Social Network of
Conversation Catalysts® is Nearly Double the Average
                                   Average Number of People Communicate With Fairly Often

                                            Total Public                            Conversation Catalysts®
   Conversation Catalysts® are         Total Network: 18                            Total Network: 34
     everyday consumers who
   stand out because they have
    large social networks, they
  regularly keep up with what’s
   new and emerging, and they                                                       10                   15
                                           6             7
         are sought out by
  friends, family, and neighbors
           for advice and
                                                   5
        recommendations.
                                                                                             9


                                                       Family       Acquaintances         Friends


                                        Source: Keller Fay Group’s TalkTrack® Britain , August 2011 - March 2012


  www.kellerfay.com                                     12
Conversation Catalysts® Have Twice as Many
        Brand Conversations vs. Total Public
                      Average Number of Brand Conversations Per Week
   Whereas the average British consumer has
    about 81 conversations per week about
 brands, Conversation Catalysts® have about 2                            163
  times as many: 163 conversations per week.
  This is a group of people who, if they can be
engaged and activated on a brand’s behalf, can
   certainly drive the conversations that drive
                      results.
                                        81


                                  Total Public                     Conversation
                                                                    Catalysts®
                      Source: Keller Fay Group’s TalkTrack® Britain, August 2011 – March 2012


www.kellerfay.com                                    13
Advertising and WOM

                           WOM Stats


www.kellerfay.com             14
Advertising Plays a Bigger Role Than People Think (Or Say)
                     What Consumers Say                                                              What Consumers Do
Consumers say they rely on advertising to learn about products, but                 …But in fact, the closer they get to a decision the more they
claim it plays a diminishing role as they approach an actual decision.                talk about ads in their word of mouth conversations.

  70%                                                                         50%

  60%
                                                                              40%
  50%
                                                                              30%
  40%

  30%                                                                         20%

  20%
                                                                              10%
  10%

   0%                                                                         0%
            Awareness         Research        Decision-                               Awareness      Research       Research        Final
              Phase            Phase         Making Phase                                              Phase          Phase        Decision
                                                                                                      (Broad)       (Narrow)
                                           Source: Keller Fay Group for NBC Universal, March 2011
                                              Page 81, The Face-to-Face Book, Free Press, 2012

      www.kellerfay.com                                                  15
Over Half of Brand WOM References
                   Media or Marketing Activity
                                      Percentage of WOM Citing Media/Marketing Elements

    Ads are talked about most
frequently in conversations about     Any Form of Media/Marketing                                          54%
       entertainment and
       movies, followed by
                                                             Advertising                  19%
   beauty, telecom & the home.

The right ad at the right time with                   PR/Programming                      17%
the right message can spark word
of mouth, regardless of category.                                Websites               13%

                                                             Point of Sale           9%

                                                              Promotions           6%

                                                   Email & Direct Mail             5%

                                                            Social Media          3%
                                      Source: Keller Fay Group’s TalkTrack® Britain, August 2011 – March 2012


 www.kellerfay.com                                     16
TV Ads are the Most Prevalent
                      Type of Advertising Referenced
                            Percentage of All WOM Conversations Driven by Advertising
                                                 Ads that Spark WOM: By Medium

                                                                            % Referenced
                                               Type of Ad
                                                                              in WOM
      All media should be
    considered eligible for                    Television Ad                       7.2
 driving word of mouth; the
 key for marketers is to find                   Internet Ad                        3.6
  the right type of message                   Newspaper Ad                         2.6
that will reach the right type
   of consumer, at the right                   Magazine Ad                         2.4
 time, via the right channel.
                                                 Poster Ad                         1.4
                                                 Radio Ad                          1.1
                                                Cinema Ad                          0.9
                                               Any Other Ad                        2.1

                                 Source: Keller Fay Group’s TalkTrack® Britain, August 2011 – March 2012


www.kellerfay.com                                            17
The Internet and WOM


                           WOM Stats


www.kellerfay.com             18
The Internet is a Powerful Reference Source for Conversation

                      Percentage of Media & Marketing Elements Referenced in All WOM
                                         Online Sources Talked About in WOM
                                          Media/Marketing               % Referenced
        Across all                             Element                    in WOM
 categories, only 2.6%
  of all conversations         Internet (any reference)                                21.9
 involve a reference to
          social               Brand or Company Website                                 6.2
    media, including
    blogs and social           Shopping Website                                         4.3
   networking sites.           Internet Ad                                              3.6
                               Online Consumer Reviews                                  3.4
                               Online Price Comparison Website                          3.0
                               Social Media                                             2.6
                               Online Article/Video/Radio/Podcast                       2.6
                              Source: Keller Fay Group’s TalkTrack® Britain, August 2011 – March 2012


  www.kellerfay.com                                  19
Internet is Most Important Source of Content
Before, During, and Especially After a Conversation
Percentage of Brand Conversations Involving References to TV and to the Internet
 Before or During WOM Conversations, or Use of Source After Conversations for Seeking Out More Info

                                              Internet           TV                               The source of the
                                                                                             Internet’s big advantage
                                                                                                    for supporting
                21%     20%                                                                    conversations is that it
                                              18%                             19%             provides highly efficient
                                                                                              self-service information
                                                         15%                                     at the moment it is
                                                                                             required, which is crucial
                                                                                                 for conversational
                                                                                                      purposes.
                                                                                      8%


                   Before                       During                           After
                Conversation                 Conversation                     Conversation
                               Source: Keller Fay Group for Google, June 2011
                              Page 122, The Face-to-Face Book, Free Press, 2012

  www.kellerfay.com                                      20
Brands and WOM

                        WOM Stats


www.kellerfay.com          21
The Most Talked-About Brands are Widely-Advertised, and
are Frequently Encountered in the Real World
            The Most Talked-About Brands in Great Britain

                        Top WOM           Weekly WOM
            Rank                                                         Successful marketing isn’t just
                          Brands      Impressions (in millions)         about cuing more conversations;
             1             Tesco                79                       it’s also about driving strongly
             2              Sky                 65                     positive conversations that lead to
                                                                       recommendations and purchases.
             3             Apple                58                       The best marketers, Keller Fay
             4               BT                 45                     Group UK has found, use a variety
             5             ASDA                 45                     of messaging techniques that lead
             6              BBC                 44                       to sharing and recommending.

             7         Virgin Media             44
             8          Coco-Cola               38
             9             Boots                36
             10       Marks & Spencer           35
                      Source: Keller Fay Group’s TalkTrack® Britain,
                               August 2011 – March 2012


  www.kellerfay.com                                       22
TV Ads and Programs are Top-Referenced Media
          Sources in Brand Conversations
Percentage of Media & Marketing Elements Referenced in All WOM
             Television Ad/Sponsorship                                                        7.2%
                  Television Programme                                                 6.2%
          A Brand Or Company Website                                                   6.2%
               In Store Display Or Video                                       5.0%
                        Product Package                                       4.9%
                      Shopping Website                                    4.3%
                             Internet Ad                           3.6%                Television has two advantages no other
             Online Consumer Reviews                             3.4%                   medium can touch: paid TV beats all
                         Product Sample                        3.1%
      Online Price Comparison Website
                                                                                        other forms of paid media, including
                                                              3.0%
                      Newspaper Article                     2.8%                         the Internet, in reaching the largest
                                 Coupon                     2.8%                       number of people having conversation
          Email Or Text From A Business                    2.7%                          about brands, and TV has a unique
    Online Article/Video/Radio/Podcast                    2.6%                         capability to spark a conversation with
                          Newspaper Ad                    2.6%
                            Social Media
                                                                                       compelling video that can be served up
                                                          2.6%
                              Direct Mail                2.5%                              at the behest of the advertiser.
                            Magazine Ad                 2.4%
                        Magazine Article              2.1%
Sports, Concert, Theatre Or Other Event           1.5%
                               Poster Ad         1.4%
                      Radio Programme          1.1%
                                Radio Ad       1.1%
                              Cinema Ad      0.9%
      Any Other Type Of Advertisement                 2.1%

             Source: Keller Fay Group’s TalkTrack® Britain, August 2011 – March 2012
 www.kellerfay.com                                              23
People Talk About Different Brands in
                  All WOM vs. Social Media WOM
              Top 10 Social Brands (2010): Social Media vs. All Word of Mouth

                                             Social Media              Word of Mouth
  Looking across the ten
  most social brands, the           1             iPhone                    Coca-Cola
 average ranking when it
   comes to all word of             2           BlackBerry                   Walmart
 mouth is 82. The biggest
                                    3              Disney                     Verizon
       disconnect is
   Android, which is the            4             Android                      AT&T
 fourth most social brand
                                    5               iPad                       Pepsi
online but drops to 400 on
  the list of most talked-          6               Sony                       Ford
 about brands offline and
           online.
                                    7              Apple                       Apple
                                    8               MTV                    McDonald’s
                                    9           Coca-Cola                      Sony
                                   10            Samsung                        Dell
                Source: Social Media data from Vitrue. Word of Mouth data from Keller Fay Group’s TalkTrack® 2010.
                                        Page 150, The Face-to-Face Book, Free Press, 2012


   www.kellerfay.com                                           24

UK Face-to-Face Book Summary Slides

  • 1.
    The Face-to-Face Book UK Version Summary Data Slides May be used for non-commercial purposes with attribution to The Face-to-Face Book and The Keller Fay Group Prepared by Ed Keller, CEO Brad Fay, COO Steve Thomson, UK MD © 2012 Keller Fay Group
  • 2.
    About The Face-to-FaceBook The Face-to-Face Book presents a unique, research-backed point of view about the value of real relationships in a time when social media has taken center stage. Companies are pouring billions into Facebook and Twitter, hoping that they have finally found the holy grail of marketing. But, the fact remains that it is the in-person conversations that still matter most. Based on six years of research by the award-winning word of mouth research firm, the Keller Fay Group, the Face-to-Face Book presents a multitude of case studies and research studies that show that: • Over 90% of conversations still take place offline, primarily face to face, with less than 8% occurring online • Human beings are fundamentally wired to be social and are highly influenced by direct, in-person conversations • Large companies, such as Apple, General Mills, Kimberly Clark and Toyota have been successful by integrating WOM into their advertising and marketing campaigns • Consumers often reference other forms of media when they are talking about a brand, making the case that advertising can be designed to spark WOM conversation Although most of the data and case studies are from the US, all of the major themes we talk about apply to the UK – word of mouth dynamics are similar in both countries www.kellerfay.com 2
  • 3.
    About the KellerFay Group About Keller Fay The Keller Fay Group is the first full-service market research company focused exclusively on word of mouth (WOM) and brand advocacy. The firm’s founders, Ed Keller and Brad Fay are authors of The Face-to-Face Book, “a celebration of the supremely social nature of all human beings and how that drives the consumer marketplace.” The book is based on research from Keller Fay’s TalkTrack® program is the only continuous study of WOM in all channels (online and offline) designed to closely monitor and measure the marketing-relevant attributes of actual consumer conversations. TalkTrack® was launched in the U.S. in 2006 and in the United Kingdom in 2011. For further information about the Keller Fay Group, visit our website www.kellerfay.com. Join our Network: www.facebook.com/kellerfay www.twitter.com/kellerfay www.slideshare.net/kellerfay/ www.linkedin.com/company/keller-fay-group CONTACT: Steve Thomson, sthomson@kellerfay.com, +44 7769 289590 www.kellerfay.com 3
  • 4.
    Table of Contents Section I: Word of Mouth Overview Stats……….page 5 Section II: Conversation Catalysts®…………………page 11 Section III: Advertising and Word of Mouth……page 14 Section IV: The Internet and Word of Mouth….page 18 Section V: Brands and Word of Mouth…………...page 21 www.kellerfay.com 4
  • 5.
    WOM Overview Stats WOM Stats www.kellerfay.com 5
  • 6.
    WOM Conversations ofUK Consumers Largely Take Place Offline, Even More Than US Consumers Mode of Conversations UK US UK US Total Offline 94% 90% Total Online 5% 8% Other Other Social Media 1% 2% Social Media 1% Research from Keller 2% Instant/Text Fay Group UK & US Message Instant/Text shows 94% and 90% of 2% Message WOM conversations Phone 3% are offline, while 5% Email and 8% are online, 11% Phone Face to Face 2% Face to Face Email respectively. 14% 76% 83% 3% Source: Keller Fay Group’s TalkTrack® Britain, Source: Keller Fay Group’s TalkTrack®, July 2010 – June 2011 August 2011 – March 2012 Page 18, The Face-to-Face Book, Free Press, 2012 www.kellerfay.com 6
  • 7.
    3.3 Billion WeeklyWOM Impressions Happen Offline Weekly Volume of WOM Impressions (in Billions) According to Keller Fay Group’s Offline vs. Online TalkTrack®, there are about 3.3 billion offline and 0.2 billion online 3.3 weekly WOM impressions. It’s not so much that online is small, but rather that offline is enormous. **WOM Impressions are projected by taking the average number of daily brand mentions per respondent and multiplying it against the population 13-69 (according to UK Census).** 0.2 Online Offline Source: Keller Fay Group’s TalkTrack® Britain, August 2011 – March 2012 www.kellerfay.com 7
  • 8.
    Conversations are MoreLikely to Take Place at Times When Media are Being Consumed Percentage of People Having Conversations During Each Half Hour on an Average Day The Internet and radio are the most sociable media 45% because people are most apt to be having conversations close to the time they are 32% using the Internet and listening to the radio. Total Public Total Public While Simultaneously Consuming Media Source: IPA Touchpoints3 in the UK Page 136, The Face-to-Face Book, Free Press, 2012 www.kellerfay.com 8
  • 9.
    2 Out of3 Conversations are Positive Research from Keller Fay Group’s TalkTrack® shows only 8% of WOM Polarity of Word of Mouth conversations in the US are Positive Mixed Negative negative. Net Advocacy (Positive less mixed and negative talk) TalkTrack® US -8%-15% 66% 43 TalkTrack® Britain -10%-19% 61% 32 Source US Data: Keller Fay Group’s TalkTrack®, July 2010 – June 2011 Page 191, The Face-to-Face Book, Free Press, 2012 Source UK Data: Keller Fay Group’s TalkTrack® Britain, August 2011 – March 2012 www.kellerfay.com 9
  • 10.
    Information from PositiveConversations is More Likely to be Shared, Which Means Negative WOM is Less Viral Percentage Rating WOM Highly Likely to Be Passed Along “9” or “10” on 0 -10 scale WOM is ultimately about making affirmative buying decisions. While it is very helpful to be steered away from a bad product or service, it’s even more 41% helpful to be steered toward 32% something good to buy. Positive WOM Negative WOM Source: Keller Fay Group’s TalkTrack® Britain, August 2011 – March 2012 www.kellerfay.com 10
  • 11.
    Conversation Catalysts® WOM Stats www.kellerfay.com 11
  • 12.
    The Size ofthe Real World Social Network of Conversation Catalysts® is Nearly Double the Average Average Number of People Communicate With Fairly Often Total Public Conversation Catalysts® Conversation Catalysts® are Total Network: 18 Total Network: 34 everyday consumers who stand out because they have large social networks, they regularly keep up with what’s new and emerging, and they 10 15 6 7 are sought out by friends, family, and neighbors for advice and 5 recommendations. 9 Family Acquaintances Friends Source: Keller Fay Group’s TalkTrack® Britain , August 2011 - March 2012 www.kellerfay.com 12
  • 13.
    Conversation Catalysts® HaveTwice as Many Brand Conversations vs. Total Public Average Number of Brand Conversations Per Week Whereas the average British consumer has about 81 conversations per week about brands, Conversation Catalysts® have about 2 163 times as many: 163 conversations per week. This is a group of people who, if they can be engaged and activated on a brand’s behalf, can certainly drive the conversations that drive results. 81 Total Public Conversation Catalysts® Source: Keller Fay Group’s TalkTrack® Britain, August 2011 – March 2012 www.kellerfay.com 13
  • 14.
    Advertising and WOM WOM Stats www.kellerfay.com 14
  • 15.
    Advertising Plays aBigger Role Than People Think (Or Say) What Consumers Say What Consumers Do Consumers say they rely on advertising to learn about products, but …But in fact, the closer they get to a decision the more they claim it plays a diminishing role as they approach an actual decision. talk about ads in their word of mouth conversations. 70% 50% 60% 40% 50% 30% 40% 30% 20% 20% 10% 10% 0% 0% Awareness Research Decision- Awareness Research Research Final Phase Phase Making Phase Phase Phase Decision (Broad) (Narrow) Source: Keller Fay Group for NBC Universal, March 2011 Page 81, The Face-to-Face Book, Free Press, 2012 www.kellerfay.com 15
  • 16.
    Over Half ofBrand WOM References Media or Marketing Activity Percentage of WOM Citing Media/Marketing Elements Ads are talked about most frequently in conversations about Any Form of Media/Marketing 54% entertainment and movies, followed by Advertising 19% beauty, telecom & the home. The right ad at the right time with PR/Programming 17% the right message can spark word of mouth, regardless of category. Websites 13% Point of Sale 9% Promotions 6% Email & Direct Mail 5% Social Media 3% Source: Keller Fay Group’s TalkTrack® Britain, August 2011 – March 2012 www.kellerfay.com 16
  • 17.
    TV Ads arethe Most Prevalent Type of Advertising Referenced Percentage of All WOM Conversations Driven by Advertising Ads that Spark WOM: By Medium % Referenced Type of Ad in WOM All media should be considered eligible for Television Ad 7.2 driving word of mouth; the key for marketers is to find Internet Ad 3.6 the right type of message Newspaper Ad 2.6 that will reach the right type of consumer, at the right Magazine Ad 2.4 time, via the right channel. Poster Ad 1.4 Radio Ad 1.1 Cinema Ad 0.9 Any Other Ad 2.1 Source: Keller Fay Group’s TalkTrack® Britain, August 2011 – March 2012 www.kellerfay.com 17
  • 18.
    The Internet andWOM WOM Stats www.kellerfay.com 18
  • 19.
    The Internet isa Powerful Reference Source for Conversation Percentage of Media & Marketing Elements Referenced in All WOM Online Sources Talked About in WOM Media/Marketing % Referenced Across all Element in WOM categories, only 2.6% of all conversations Internet (any reference) 21.9 involve a reference to social Brand or Company Website 6.2 media, including blogs and social Shopping Website 4.3 networking sites. Internet Ad 3.6 Online Consumer Reviews 3.4 Online Price Comparison Website 3.0 Social Media 2.6 Online Article/Video/Radio/Podcast 2.6 Source: Keller Fay Group’s TalkTrack® Britain, August 2011 – March 2012 www.kellerfay.com 19
  • 20.
    Internet is MostImportant Source of Content Before, During, and Especially After a Conversation Percentage of Brand Conversations Involving References to TV and to the Internet Before or During WOM Conversations, or Use of Source After Conversations for Seeking Out More Info Internet TV The source of the Internet’s big advantage for supporting 21% 20% conversations is that it 18% 19% provides highly efficient self-service information 15% at the moment it is required, which is crucial for conversational purposes. 8% Before During After Conversation Conversation Conversation Source: Keller Fay Group for Google, June 2011 Page 122, The Face-to-Face Book, Free Press, 2012 www.kellerfay.com 20
  • 21.
    Brands and WOM WOM Stats www.kellerfay.com 21
  • 22.
    The Most Talked-AboutBrands are Widely-Advertised, and are Frequently Encountered in the Real World The Most Talked-About Brands in Great Britain Top WOM Weekly WOM Rank Successful marketing isn’t just Brands Impressions (in millions) about cuing more conversations; 1 Tesco 79 it’s also about driving strongly 2 Sky 65 positive conversations that lead to recommendations and purchases. 3 Apple 58 The best marketers, Keller Fay 4 BT 45 Group UK has found, use a variety 5 ASDA 45 of messaging techniques that lead 6 BBC 44 to sharing and recommending. 7 Virgin Media 44 8 Coco-Cola 38 9 Boots 36 10 Marks & Spencer 35 Source: Keller Fay Group’s TalkTrack® Britain, August 2011 – March 2012 www.kellerfay.com 22
  • 23.
    TV Ads andPrograms are Top-Referenced Media Sources in Brand Conversations Percentage of Media & Marketing Elements Referenced in All WOM Television Ad/Sponsorship 7.2% Television Programme 6.2% A Brand Or Company Website 6.2% In Store Display Or Video 5.0% Product Package 4.9% Shopping Website 4.3% Internet Ad 3.6% Television has two advantages no other Online Consumer Reviews 3.4% medium can touch: paid TV beats all Product Sample 3.1% Online Price Comparison Website other forms of paid media, including 3.0% Newspaper Article 2.8% the Internet, in reaching the largest Coupon 2.8% number of people having conversation Email Or Text From A Business 2.7% about brands, and TV has a unique Online Article/Video/Radio/Podcast 2.6% capability to spark a conversation with Newspaper Ad 2.6% Social Media compelling video that can be served up 2.6% Direct Mail 2.5% at the behest of the advertiser. Magazine Ad 2.4% Magazine Article 2.1% Sports, Concert, Theatre Or Other Event 1.5% Poster Ad 1.4% Radio Programme 1.1% Radio Ad 1.1% Cinema Ad 0.9% Any Other Type Of Advertisement 2.1% Source: Keller Fay Group’s TalkTrack® Britain, August 2011 – March 2012 www.kellerfay.com 23
  • 24.
    People Talk AboutDifferent Brands in All WOM vs. Social Media WOM Top 10 Social Brands (2010): Social Media vs. All Word of Mouth Social Media Word of Mouth Looking across the ten most social brands, the 1 iPhone Coca-Cola average ranking when it comes to all word of 2 BlackBerry Walmart mouth is 82. The biggest 3 Disney Verizon disconnect is Android, which is the 4 Android AT&T fourth most social brand 5 iPad Pepsi online but drops to 400 on the list of most talked- 6 Sony Ford about brands offline and online. 7 Apple Apple 8 MTV McDonald’s 9 Coca-Cola Sony 10 Samsung Dell Source: Social Media data from Vitrue. Word of Mouth data from Keller Fay Group’s TalkTrack® 2010. Page 150, The Face-to-Face Book, Free Press, 2012 www.kellerfay.com 24