Download to read offline
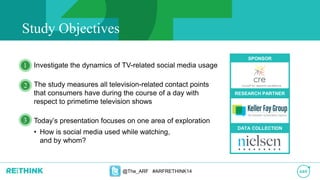
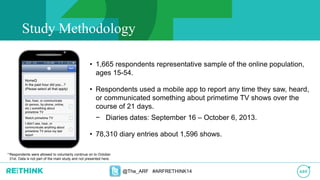
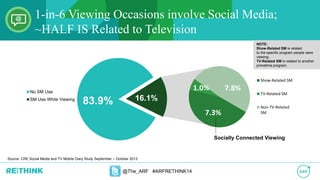
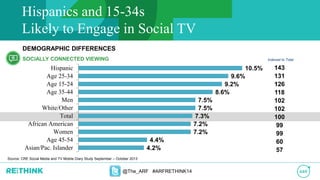

The document presents findings from a study on the dynamics of social media usage related to television viewing, involving 1,665 respondents aged 15-54. Key insights reveal that social media engagement during primetime shows is significant, with 1-in-6 viewing occasions including social media interaction, particularly among younger and Hispanic demographics. The study also explores how promotional activities influence viewership decisions, underscoring social media's growing impact on television consumption behavior.


![Second sync white paper february 2014[3]](https://cdn.slidesharecdn.com/ss_thumbnails/secondsyncwhitepaperfebruary20143-140211111829-phpapp02-thumbnail.jpg?width=640&height=640&fit=bounds)


