Download to read offline

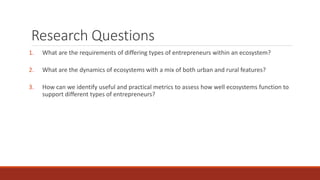
![Entrepreneurial Ecosystem
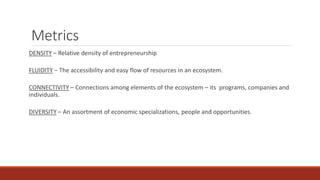
[...] a set of interconnected entrepreneurial actors
(both potential and existing), entrepreneurial
organizations, institutions and entrepreneurial
processes which formally and informally coalesce to
connect, mediate and govern the performance within
the local entrepreneurial environment (OECD, 2014)](https://image.slidesharecdn.com/virginiatechentrepreneurialecosystemspresentation-170307175252/85/UEDA-Annual-Summit-2016-Virginia-Tech-Same-Ecosystem-Different-Entrepreneurs-2-320.jpg)
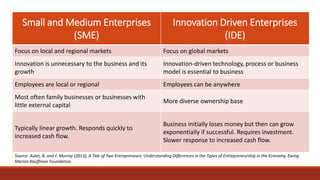
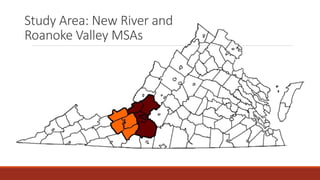
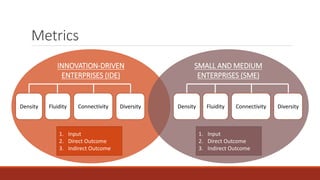
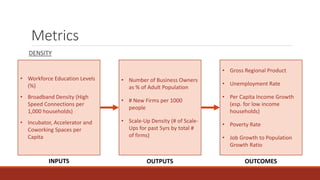
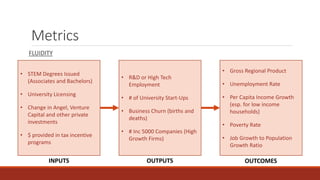
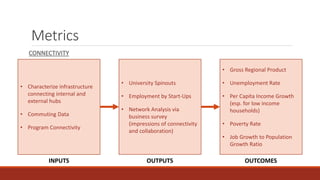
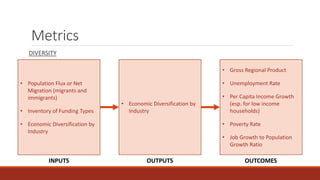
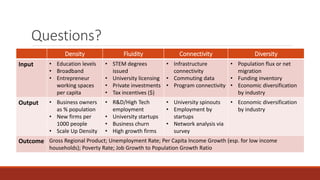

The document discusses measuring the vitality of entrepreneurial ecosystems to support different types of entrepreneurs. It analyzes ecosystems with a mix of urban and rural areas. Small and medium enterprises (SMEs) focus on local markets with linear growth, while innovation-driven enterprises (IDEs) focus on global markets requiring investment. The study examines New River and Roanoke Valley regions, finding strengths in quality of life and resources but challenges in collaboration across regions and supporting IDEs' needs. Metrics are proposed to measure ecosystem density, fluidity, connectivity, and diversity as inputs, outputs, and outcomes for SMEs and IDEs.


![[PREMONEY 2014] Innovation Works >> Chris Evdemon, "The Global VC: China"](https://cdn.slidesharecdn.com/ss_thumbnails/02chrisevdemoninnovationworksfinal-140626184731-phpapp01-thumbnail.jpg?width=640&height=640&fit=bounds)