Download to read offline
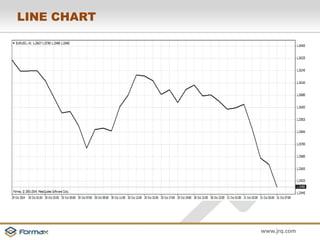
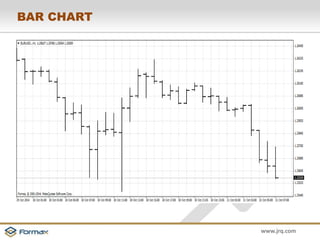
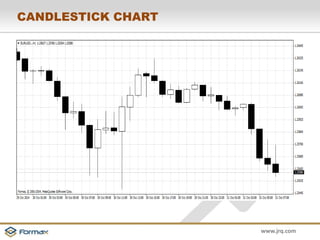
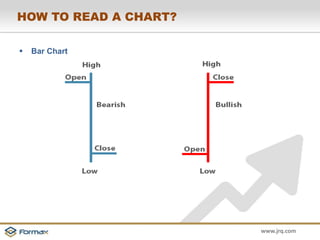
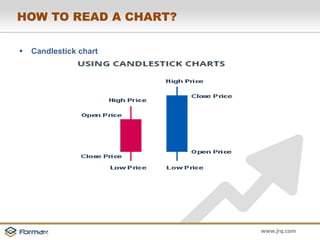


The document discusses different types of charts used to represent the movement of financial instruments over time. It describes line charts, bar charts, and candlestick charts as the main types and notes that charts provide a graphical representation of historical price performance within a given time period. Charts are used to analyze the prices of particular investments and compare their behavior across different time frames.


