Download to read offline


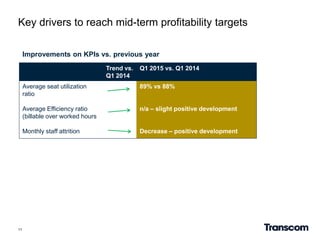


This document provides an overview of Transcom's first quarter 2015 results presentation. Some key points: - Transcom is a global customer experience specialist with over 30,000 employees in 23 countries serving over 400 clients. - In Q1 2015, revenue increased 2.4% on a like-for-like basis compared to Q1 2014. EBIT margin improved to 3.7% from 3.4% driven by higher profitability in certain regions. - Key performance indicators such as seat utilization and efficiency ratios improved compared to the previous year, and staff attrition decreased. - Transcom's strategic priorities going forward include delivering outstanding customer experiences to drive revenue and loyalty, capital


