Download to read offline


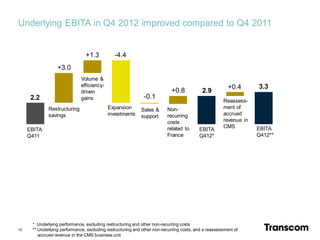


Transcom reported its fourth quarter and full-year 2012 results. Revenue increased 14.1% in Q4 2012 and 9.3% for the full year 2012 driven by growth in all regions. Underlying EBITA improved in Q4 2012 and for the full year compared to prior year periods due to volume and efficiency gains, though some regions faced challenges. Key priorities going forward include continuous focus on underperforming areas, revenue expansion, efficiency improvements, and improving quality to support new volume ramp-ups, as well as growing revenue in line with markets and improving profitability over the medium to long term.


