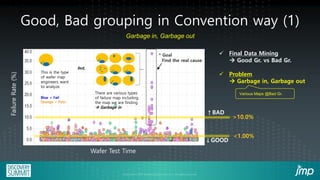
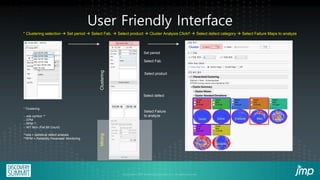
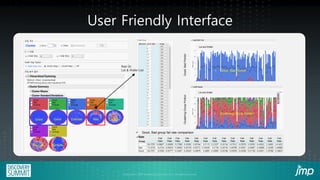
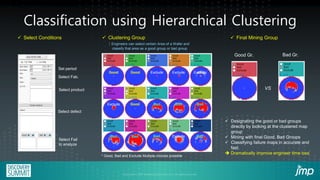
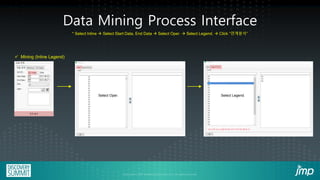
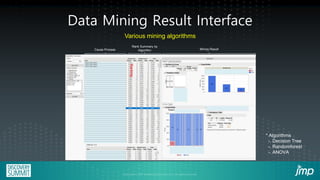
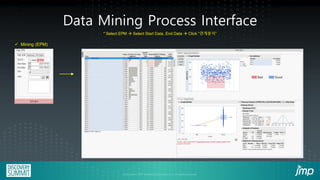
Copyright © JMP Statistical Discovery LLC. All Rights Reserved.
KOREA
Semiconductor Wafer Test
Fail Map Clustering and Data Mining
using JMP Add-In
곽병훈, SK하이닉스
✓ Semiconductor Wafer Test Failure Map Clustering and
Data Mining using JMP Add-In
1. Semiconductor Process
2. Good, Bad Grouping in conventional way
3. User Friendly Interface
4. Data Mining Process & Result
5. Example
6. Summary
Over 99% of the defects in wafer test are within fabrication
Wafer Test
Failure
Good, Bad grouping in Convention way (1)
Failure
Rate
(%)
Wafer Test Time
>10.0%
↑BAD
↓GOOD
<1.00%
✓ Final Data Mining
→ Good Gr. vs Bad Gr.
✓ Problem
→ Garbage in, Garbage out
Various Maps @Bad Gr.
Blue = Fail
Orange = Pass
This is the type
of wafer map
engineers want
to analyze.
* Goal
Find the real cause
✓ .
✓ .
✓ .
✓ .
✓ .
but,
Garbage in, Garbage out
There are various types
of failure map including
the map we are finding
→ Garbage in
Good, Bad grouping in Convention way (2)
A large loss of time = Inefficient
✓ Advantage
: an accurate classification
✓ Disadvantage
: Time Consumption
✓ Engineer finds and classifies map.
We suggest the solutions with this
problems in this presentation.
User Friendly Interface
* Clustering
-. sda symbol
-. EPM
-. RPM
-. WT Item (Fail Bit Count)
*sda = statistical defect analysis
User Friendly Interface
Set period
Select Fab.
Select product
Select defect
Select Failure
to analyze
Clustering
Mining
* Clustering
-. sda symbol **
-. EPM
-. RPM **
-. WT Item (Fail Bit Count)
**sda = statistical defect analysis
**RPM = Reliability Parameter Monitoring
* Clustering selection → Set period → Select Fab. → Select product → Cluster Analysis Click!! → Select defect category → Select Failure Maps to analyze
Bad
Good Good Exclude Exclude
Exclude Exclude
User Friendly Interface
Bad
Good Good Exclude Exclude
Exclude Exclude
Bad Gr.
Lot & Wafer List ✓ Good, Bad Portion
Lot and Wafer
Lot and Wafer
✓ Clustering Group Portion
Clustering
Group
Portion
Good,
Bad
Portion
Fail
Rate
Fail
Rate
Fail
Rate
Fail
Rate
Fail
Rate
Fail
Rate
Fail
Rate
Fail
Rate
Fail
Rate
Fail
Rate
Fail
Rate
Fail
Rate
Fail
Rate
Fail
Rate
✓ Good, Bad group fail rate comparison
Classification using Hierarchical Clustering
Set period
Select Fab.
Select product
Select defect
Select Fail
to analyze
Good Good Exclude Exclude Exclude
Exclude
Exclude Bad
Bad
Bad
Bad
Bad Bad Bad
Good
✓ Clustering Group
: Engineers can select certain Area of a Wafer and
classify that area as a good group or bad group
Good Gr. Bad Gr.
VS
✓ Select Conditions ✓ Final Mining Group
* Good, Bad and Exclude Multiple choices possible
✓ Designating the good or bad groups
directly by looking at the clustered map
group
✓ Mining with final Good, Bad Groups
✓ Classifying failure maps in accurate and
fast.
➔ Dramatically improve engineer time loss
✓ Mining (Inline Legend)
Select Oper. Select Legend.
Data Mining Process Interface
* Select Inline → Select Start Data, End Data → Select Oper. → Select Legend. → Click “연계분석”
Data Mining Result Interface
Rank Summary by
Algorithm Mining Result
Cause Process
Ranking
Various mining algorithms
OOOO Step Legend
OOOO Step Legend
OOOO Step Legend
* Algorithms
-. Decision Tree
-. Randomforest
-. ANOVA
✓ Mining (EPM)
Data Mining Process Interface
aaa para.
aaa
para.
* Select EPM → Select Start Data, End Data → Click “연계분석”
Clustering & Data Mining Example (1)
✓ Select Conditions
Good Good Exclude Bad Bad
Bad
✓ Clustering Result ✓ Mining Result
Cause Process Rank Summary by Algorithm
OOOO Step Legend
OOOO Step Legend
OOOO Step Legend
OOOO Step Legend
OOOO Step Legend
OOOO Step Legend
A
EQ.
B
EQ.
C
EQ.
D
EQ.
D
EQ.
C
EQ.
B
EQ.
A
EQ.
OOOO Step Process Run Time
✓ Result
Click!!
Focused on specific EQ (D EQ) and process run time.
→ These could be most likely the causes.
Clustering & Data Mining Example (2)
✓ Mining Result (Data Visualization : Parallel Plot)
OOO
Step
OOO
Step
OOO
Step
OOO
Step
OOO
Step
OOO
Step
OOO
Step
OOO
Step
OOO
Step
OOO
Step
OOO
Step
OOO
Step
OOO
Step
By
Process
Step
Legend
Good group scattered.
Bad group scattered.
The path of Bad group overlapped with one equipment. →This could be most likely the cause.
a EQ
b EQ
c EQ
d EQ
* Association Analysis is also possible.
Data Visualization Analysis
Clustering & Data Mining Example (3)
○ Delayed step process detection between Good and Bad group using multivariate.
Dual axis occurrence
Good
Bad
Shift
Bad Gr.
Good Gr.
A Step
Process run time
B Step
Process run time
C Step
Process run time
D Step
Process run time
Process
Flow
Process
Flow
Good
Gr.
Bad
Gr.
+1 Day +1 Day +1 Day
+1 Day +8 Day +1 Day
↙Cause of defect
A Step
Process run time
B Step
Process run time
C Step
Process run time
D Step
Process run time
A
Step
Process
run
time
B Step
Process run time
A
Step
Process
run
time
C Step
Process run time
D Step
Process run time
A
Step
Process
run
time
A
Step
Process
run
time
A
Step
Process
run
time
B Step
Process run time
B Step
Process run time
Process run time
Process
run
time
○ Delay step detection between Good and Bad group using multivariate.
If there is a problem with
delay in B step
Data Visualization Analysis
WF Count Human [min] AI [min]
100 6 0.03
1000 60 0.16
3000 180 5
Clustering Process Time [ Human vs AI ]
Human
[min]
AI
[min]
AI
180min
5min
Human
Wafer Count
✓ Dramatically reduces time consumption for engineer
Summary
1. Classifying failure maps in faster and more accurate way
2. User Friendly Interface.
3. Reducing engineer’s time spends on repetitive work tasks dramatically
4. Anyone can use JMP Add-In.
Copyright © JMP Statistical Discovery LLC. All rights reserved.
KOREA
Thank you

3-1: Semiconductor Wafer Test Fail Map Clustering and Data Mining Using JMP Add-in (SK Hynix 곽병훈TL)

  • 1.
    Copyright © JMPStatistical Discovery LLC. All Rights Reserved. KOREA
  • 2.
    Semiconductor Wafer Test FailMap Clustering and Data Mining using JMP Add-In 곽병훈, SK하이닉스
  • 3.
    ✓ Semiconductor WaferTest Failure Map Clustering and Data Mining using JMP Add-In 1. Semiconductor Process 2. Good, Bad Grouping in conventional way 3. User Friendly Interface 4. Data Mining Process & Result 5. Example 6. Summary
  • 4.
    Over 99% ofthe defects in wafer test are within fabrication Wafer Test Failure
  • 5.
    Good, Bad groupingin Convention way (1) Failure Rate (%) Wafer Test Time >10.0% ↑BAD ↓GOOD <1.00% ✓ Final Data Mining → Good Gr. vs Bad Gr. ✓ Problem → Garbage in, Garbage out Various Maps @Bad Gr. Blue = Fail Orange = Pass This is the type of wafer map engineers want to analyze. * Goal Find the real cause ✓ . ✓ . ✓ . ✓ . ✓ . but, Garbage in, Garbage out There are various types of failure map including the map we are finding → Garbage in
  • 6.
    Good, Bad groupingin Convention way (2) A large loss of time = Inefficient ✓ Advantage : an accurate classification ✓ Disadvantage : Time Consumption ✓ Engineer finds and classifies map. We suggest the solutions with this problems in this presentation.
  • 7.
    User Friendly Interface *Clustering -. sda symbol -. EPM -. RPM -. WT Item (Fail Bit Count) *sda = statistical defect analysis
  • 8.
    User Friendly Interface Setperiod Select Fab. Select product Select defect Select Failure to analyze Clustering Mining * Clustering -. sda symbol ** -. EPM -. RPM ** -. WT Item (Fail Bit Count) **sda = statistical defect analysis **RPM = Reliability Parameter Monitoring * Clustering selection → Set period → Select Fab. → Select product → Cluster Analysis Click!! → Select defect category → Select Failure Maps to analyze Bad Good Good Exclude Exclude Exclude Exclude
  • 9.
    User Friendly Interface Bad GoodGood Exclude Exclude Exclude Exclude Bad Gr. Lot & Wafer List ✓ Good, Bad Portion Lot and Wafer Lot and Wafer ✓ Clustering Group Portion Clustering Group Portion Good, Bad Portion Fail Rate Fail Rate Fail Rate Fail Rate Fail Rate Fail Rate Fail Rate Fail Rate Fail Rate Fail Rate Fail Rate Fail Rate Fail Rate Fail Rate ✓ Good, Bad group fail rate comparison
  • 10.
    Classification using HierarchicalClustering Set period Select Fab. Select product Select defect Select Fail to analyze Good Good Exclude Exclude Exclude Exclude Exclude Bad Bad Bad Bad Bad Bad Bad Good ✓ Clustering Group : Engineers can select certain Area of a Wafer and classify that area as a good group or bad group Good Gr. Bad Gr. VS ✓ Select Conditions ✓ Final Mining Group * Good, Bad and Exclude Multiple choices possible ✓ Designating the good or bad groups directly by looking at the clustered map group ✓ Mining with final Good, Bad Groups ✓ Classifying failure maps in accurate and fast. ➔ Dramatically improve engineer time loss
  • 11.
    ✓ Mining (InlineLegend) Select Oper. Select Legend. Data Mining Process Interface * Select Inline → Select Start Data, End Data → Select Oper. → Select Legend. → Click “연계분석”
  • 12.
    Data Mining ResultInterface Rank Summary by Algorithm Mining Result Cause Process Ranking Various mining algorithms OOOO Step Legend OOOO Step Legend OOOO Step Legend * Algorithms -. Decision Tree -. Randomforest -. ANOVA
  • 13.
    ✓ Mining (EPM) DataMining Process Interface aaa para. aaa para. * Select EPM → Select Start Data, End Data → Click “연계분석”
  • 14.
    Clustering & DataMining Example (1) ✓ Select Conditions Good Good Exclude Bad Bad Bad ✓ Clustering Result ✓ Mining Result Cause Process Rank Summary by Algorithm OOOO Step Legend OOOO Step Legend OOOO Step Legend OOOO Step Legend OOOO Step Legend OOOO Step Legend A EQ. B EQ. C EQ. D EQ. D EQ. C EQ. B EQ. A EQ. OOOO Step Process Run Time ✓ Result Click!! Focused on specific EQ (D EQ) and process run time. → These could be most likely the causes.
  • 15.
    Clustering & DataMining Example (2) ✓ Mining Result (Data Visualization : Parallel Plot) OOO Step OOO Step OOO Step OOO Step OOO Step OOO Step OOO Step OOO Step OOO Step OOO Step OOO Step OOO Step OOO Step By Process Step Legend Good group scattered. Bad group scattered. The path of Bad group overlapped with one equipment. →This could be most likely the cause. a EQ b EQ c EQ d EQ * Association Analysis is also possible. Data Visualization Analysis
  • 16.
    Clustering & DataMining Example (3) ○ Delayed step process detection between Good and Bad group using multivariate. Dual axis occurrence Good Bad Shift Bad Gr. Good Gr. A Step Process run time B Step Process run time C Step Process run time D Step Process run time Process Flow Process Flow Good Gr. Bad Gr. +1 Day +1 Day +1 Day +1 Day +8 Day +1 Day ↙Cause of defect A Step Process run time B Step Process run time C Step Process run time D Step Process run time A Step Process run time B Step Process run time A Step Process run time C Step Process run time D Step Process run time A Step Process run time A Step Process run time A Step Process run time B Step Process run time B Step Process run time Process run time Process run time ○ Delay step detection between Good and Bad group using multivariate. If there is a problem with delay in B step Data Visualization Analysis
  • 17.
    WF Count Human[min] AI [min] 100 6 0.03 1000 60 0.16 3000 180 5 Clustering Process Time [ Human vs AI ] Human [min] AI [min] AI 180min 5min Human Wafer Count ✓ Dramatically reduces time consumption for engineer
  • 18.
    Summary 1. Classifying failuremaps in faster and more accurate way 2. User Friendly Interface. 3. Reducing engineer’s time spends on repetitive work tasks dramatically 4. Anyone can use JMP Add-In.
  • 19.
    Copyright © JMPStatistical Discovery LLC. All rights reserved. KOREA Thank you