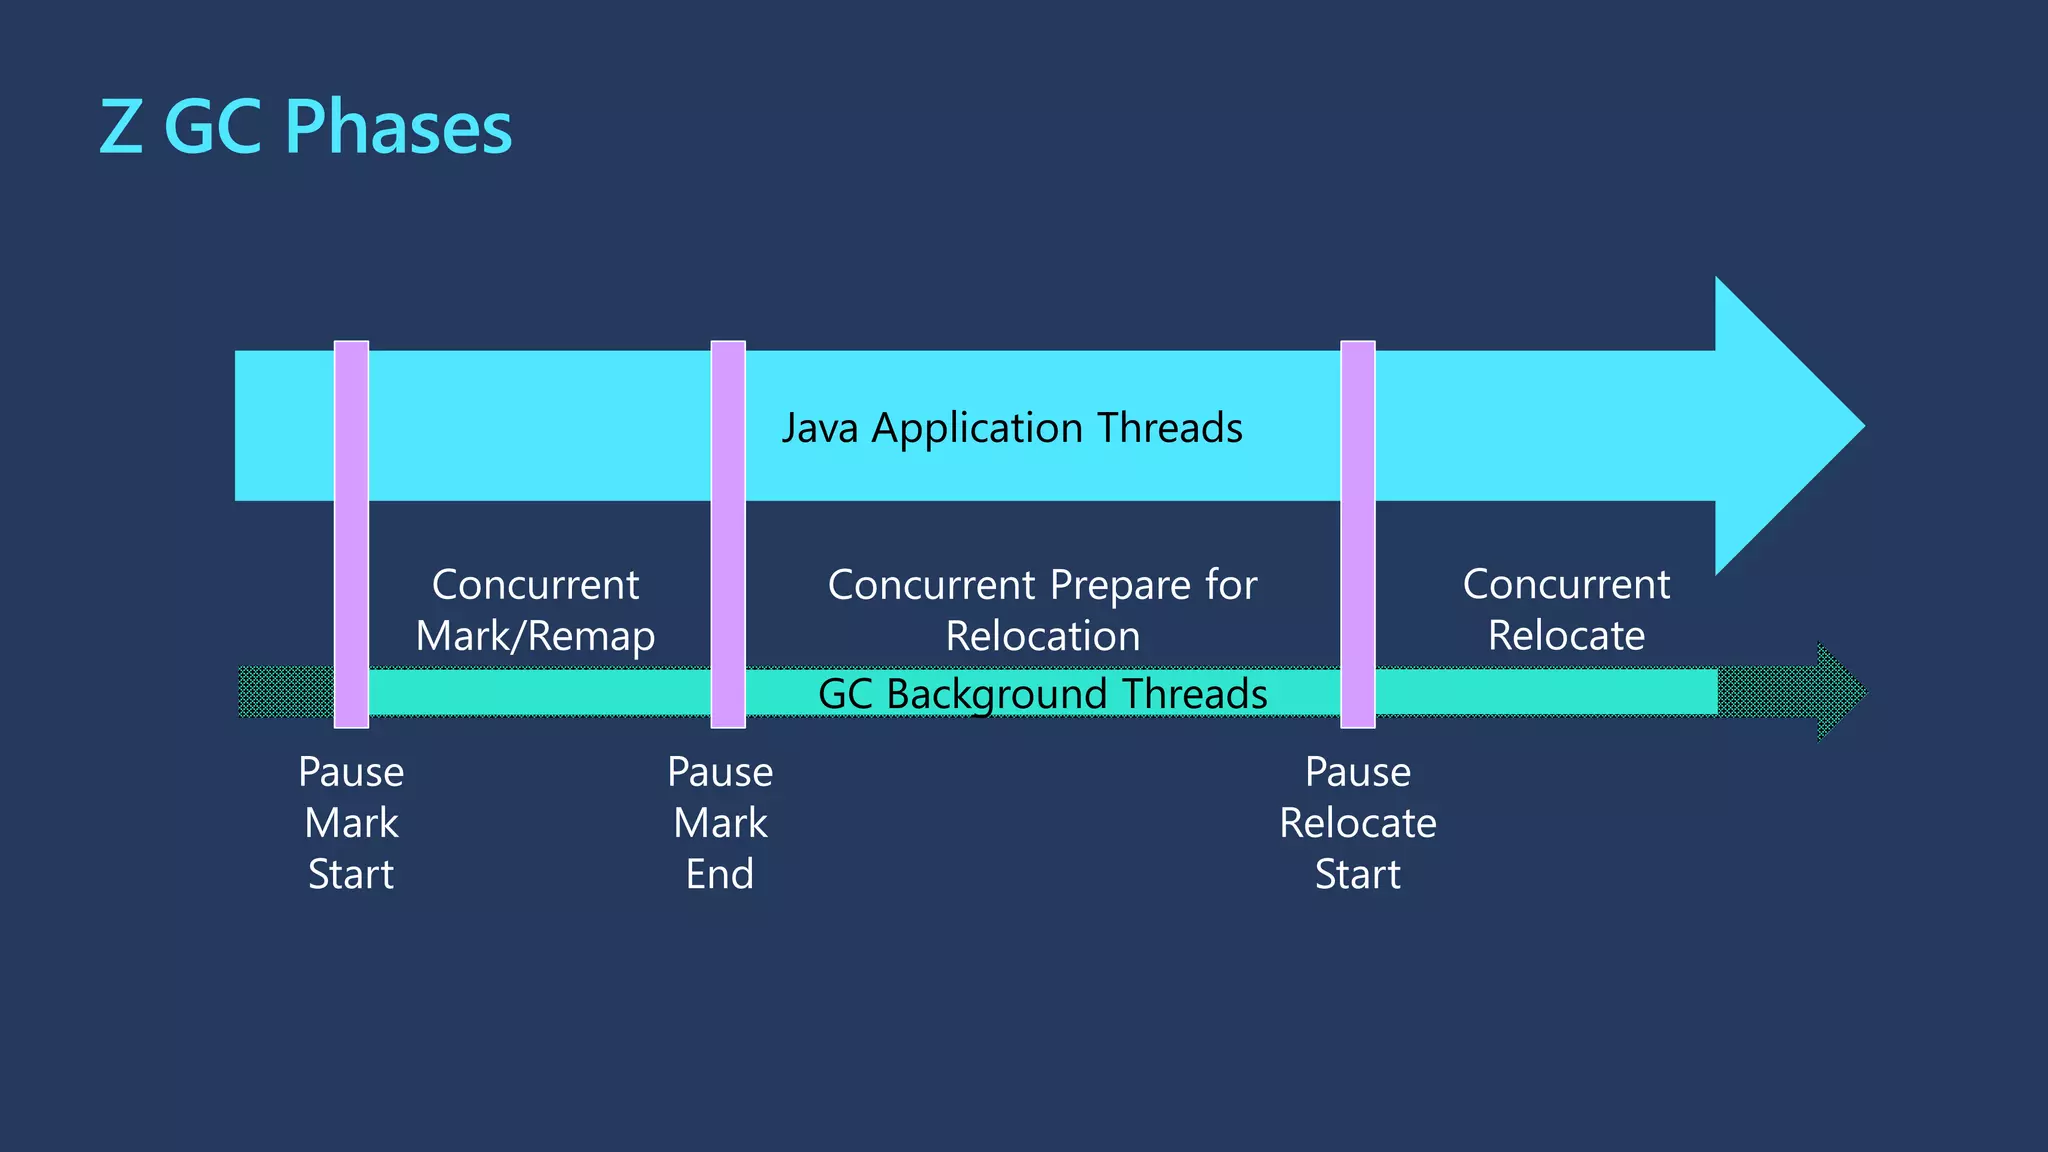
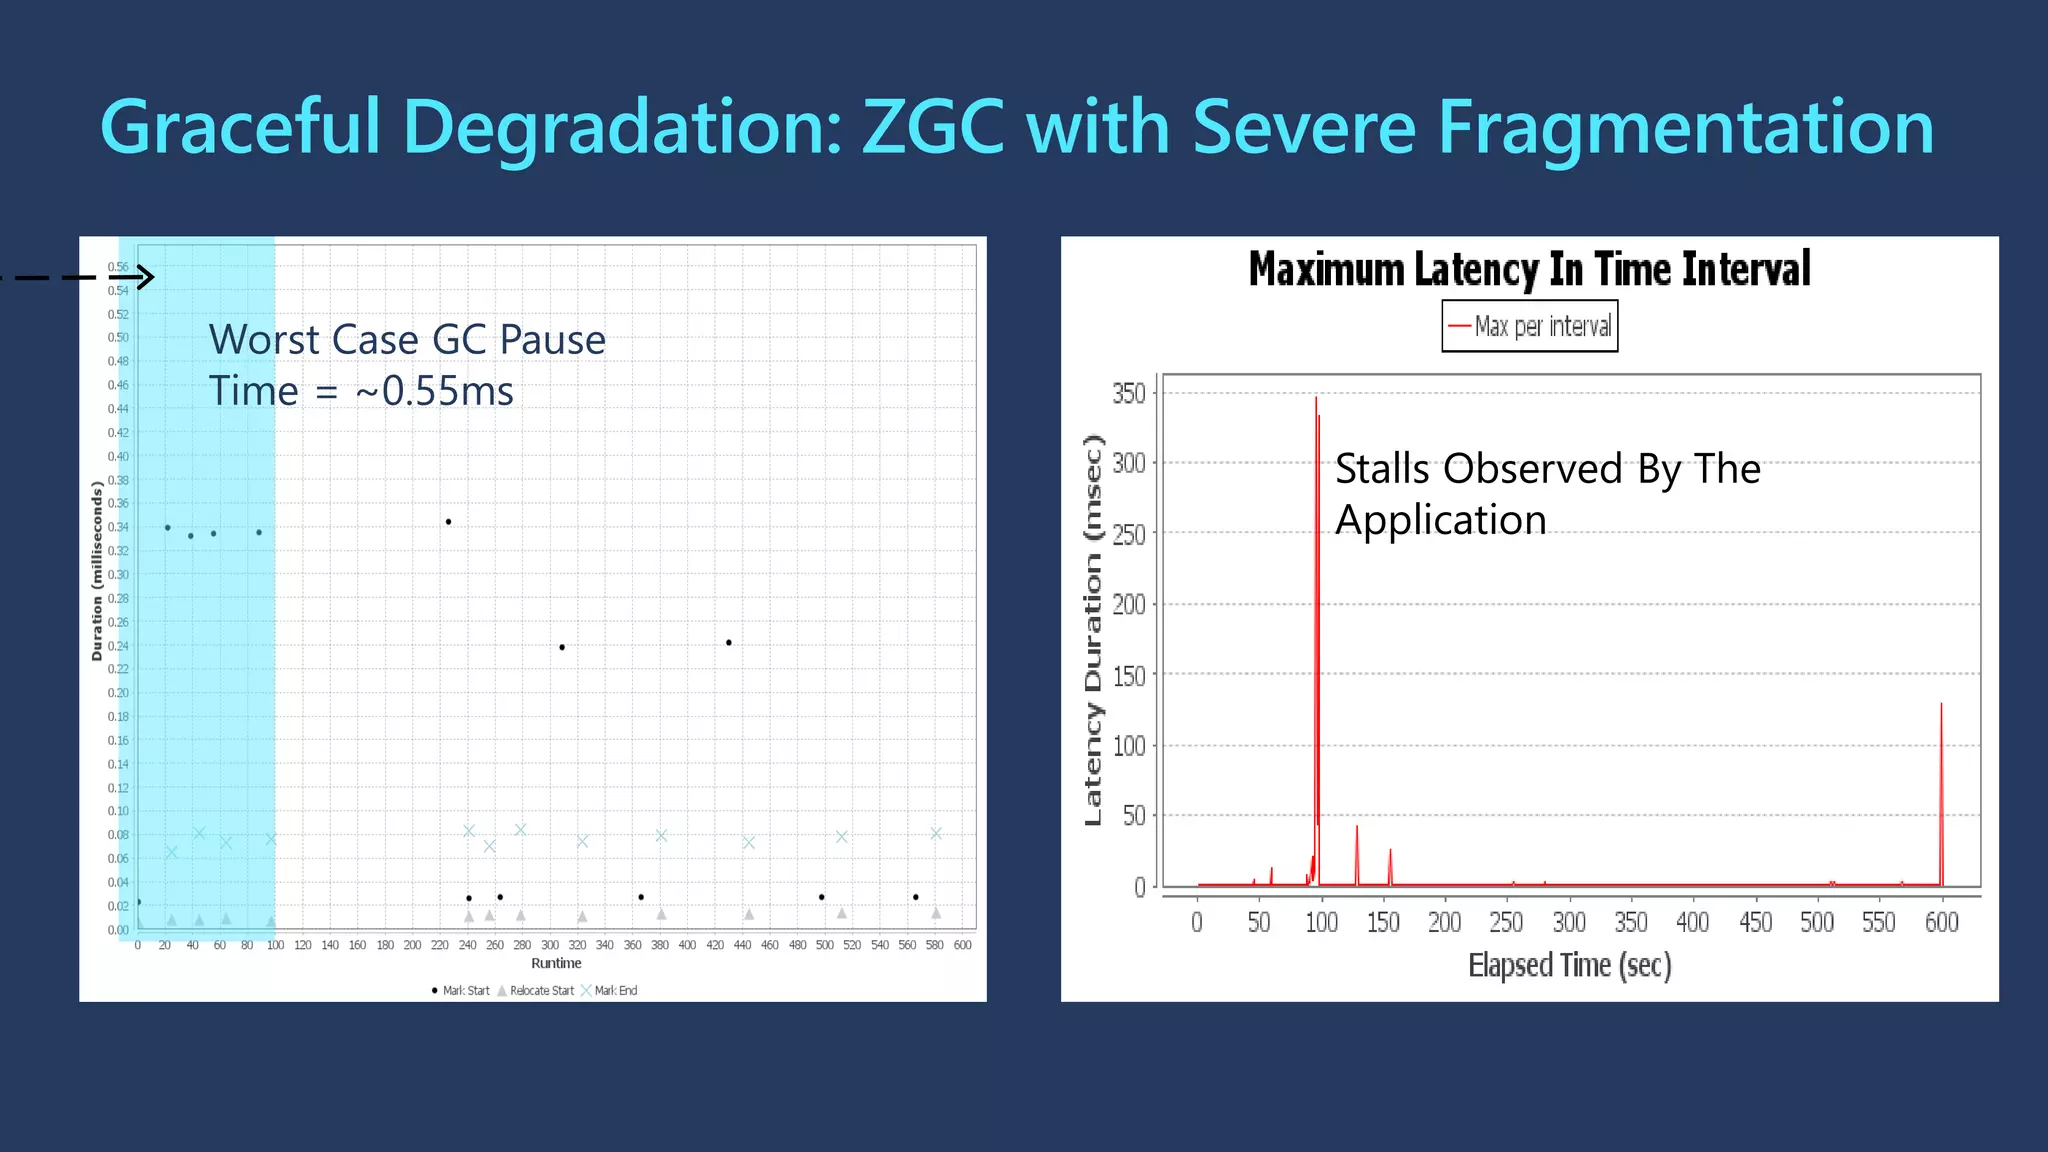
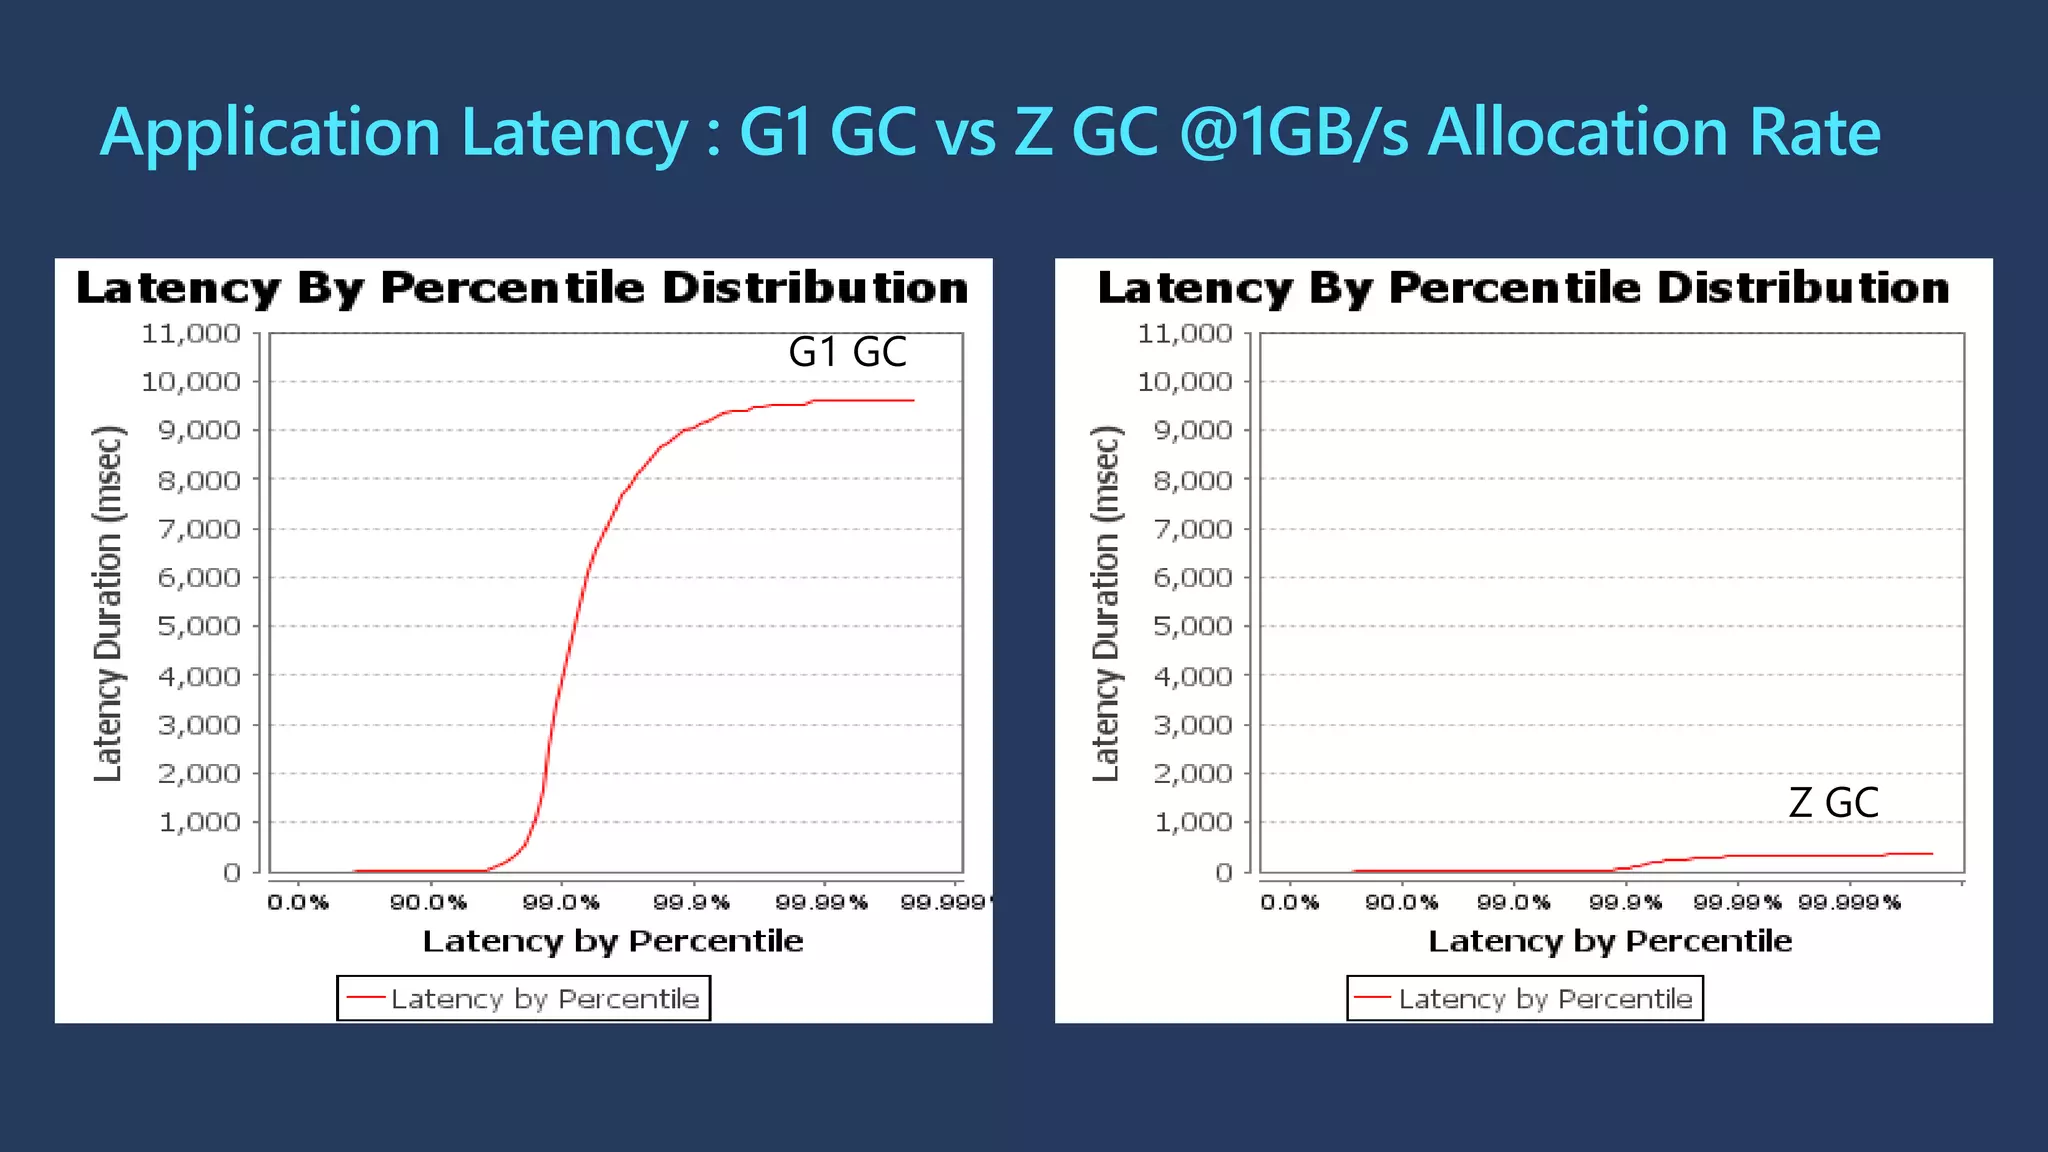
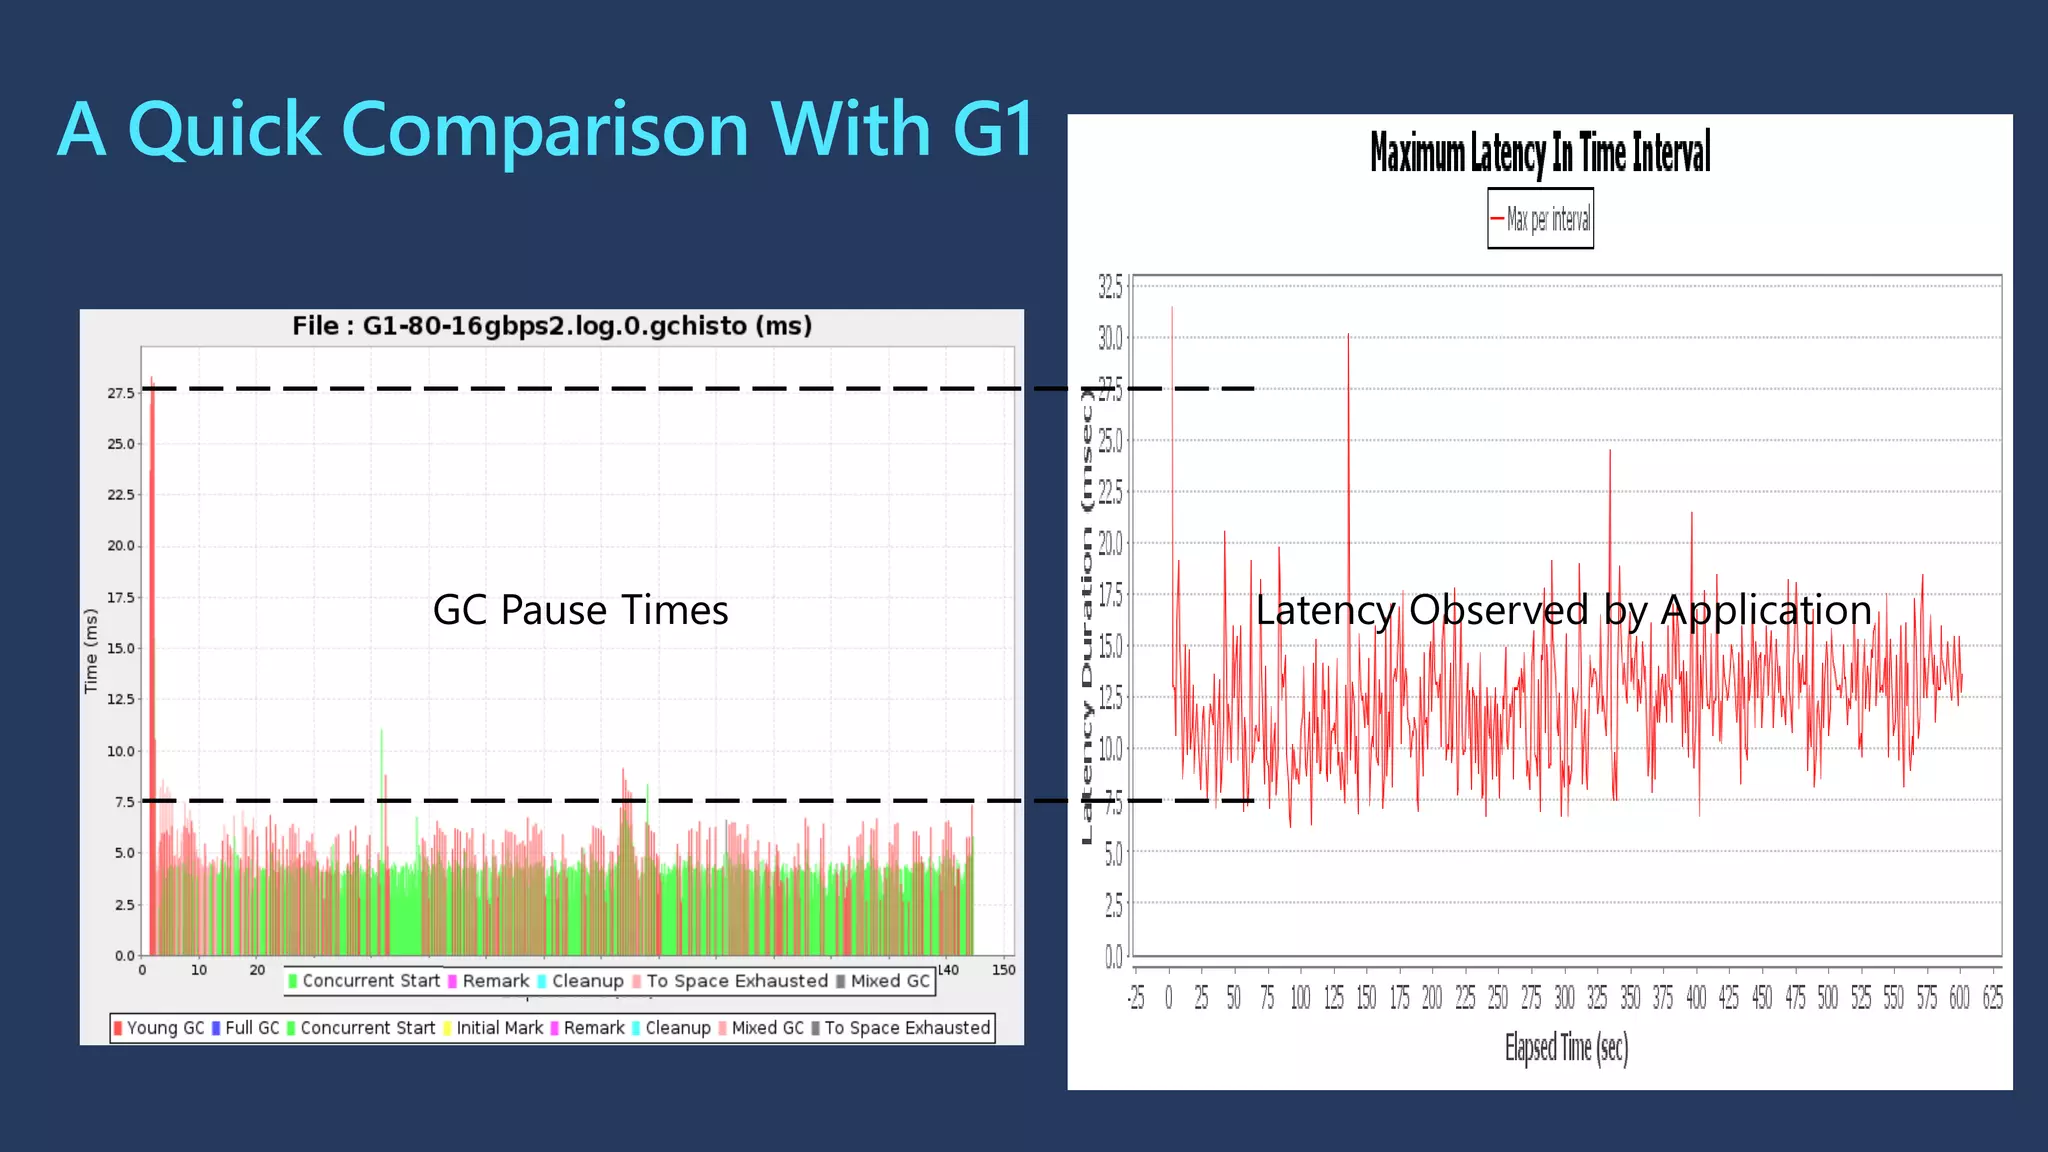
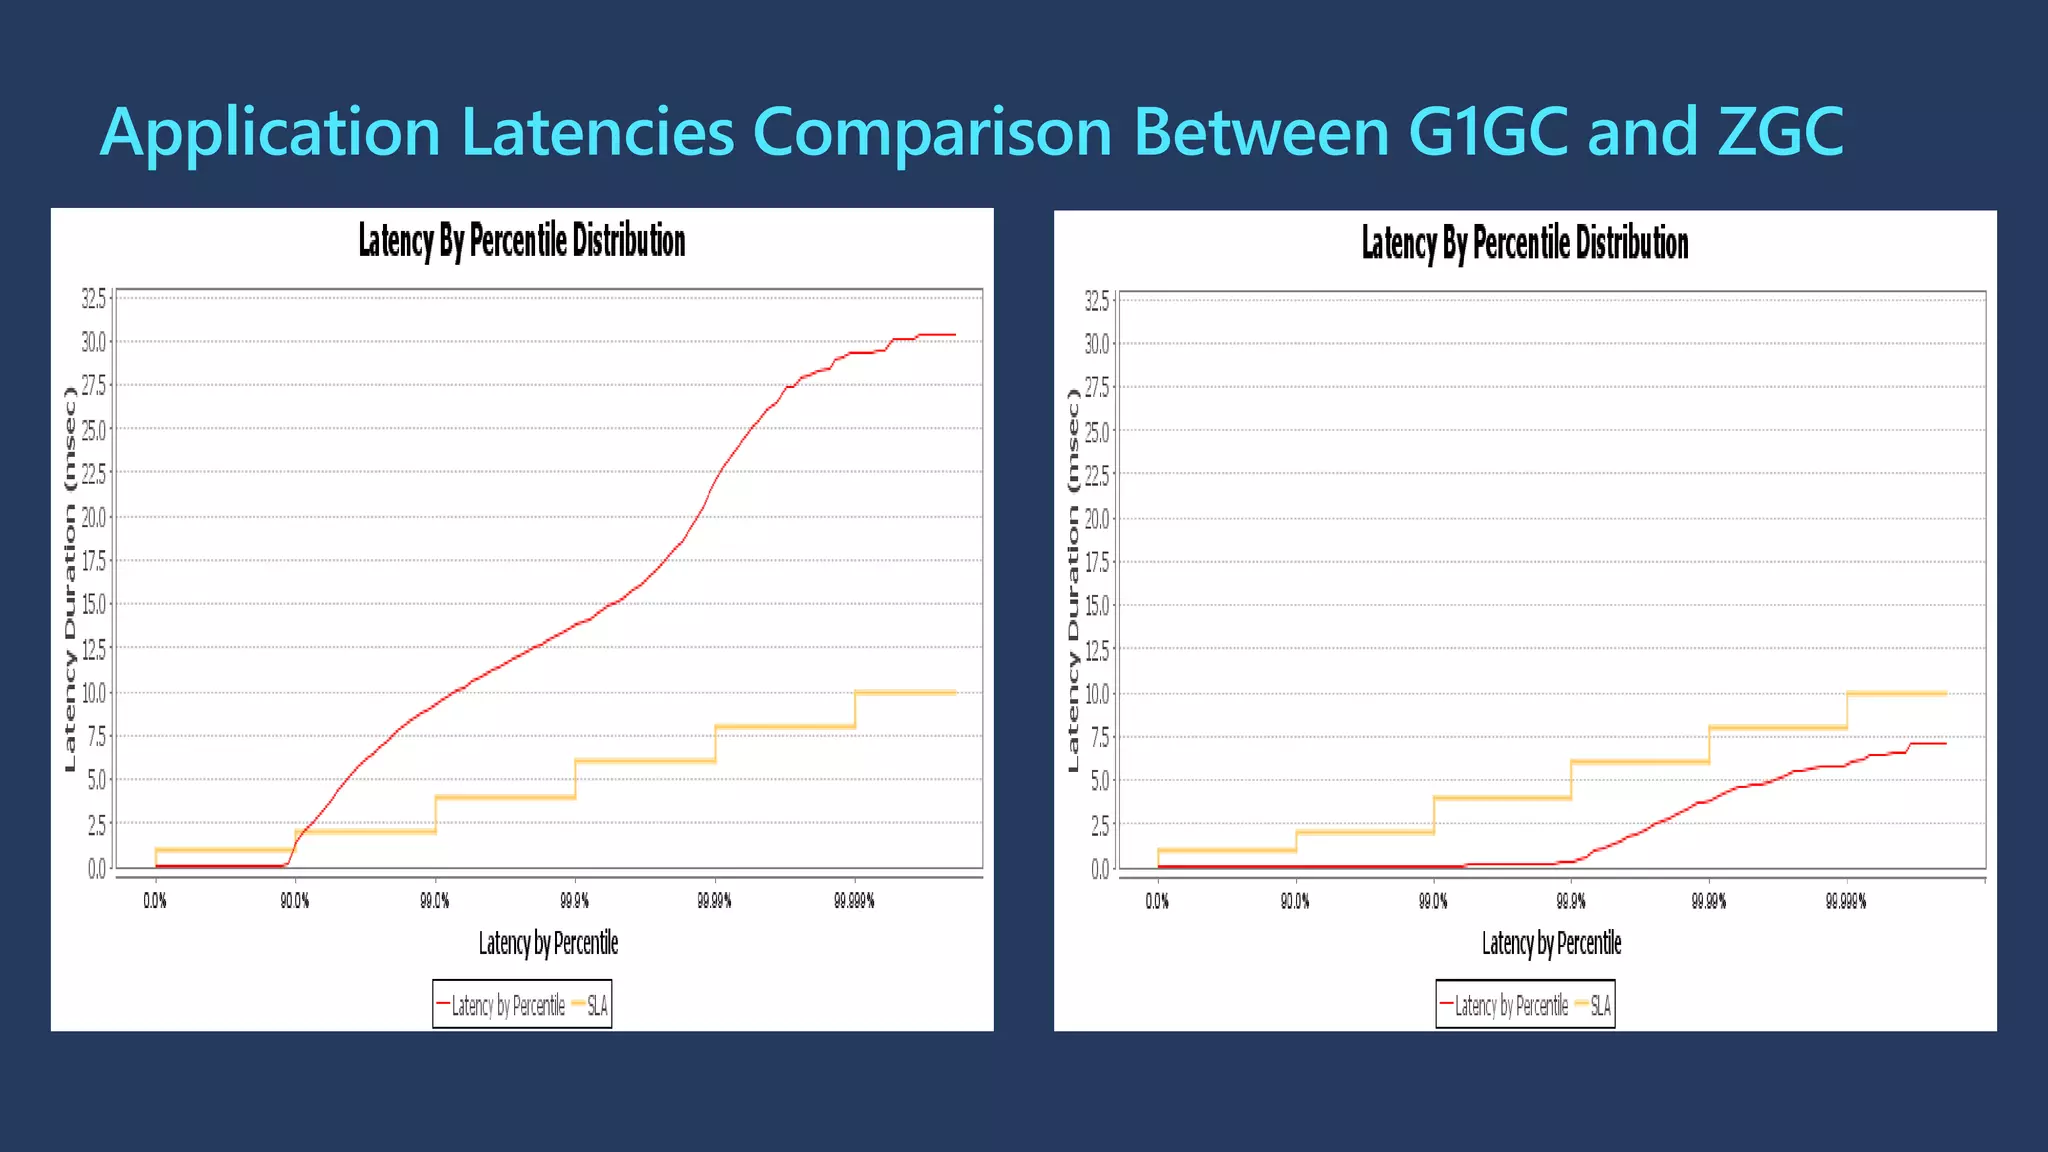
Z Garbage Collector –
Look Ma ~No Pause!
- Monica Beckwith
- @mon_beck
Agenda  The Basic Principles of an Adaptive,
Predictable Garbage Collector
 Designing a GC
 Introduction to Z Garbage Collector
 Design Considerations
 Phases
 Production Readiness
 Performance Impact and Considerations
 Comparison with G1 GC
The Basic Principles of an Adaptive,
Predictable Garbage Collector
OpenJDK HotSpot collectors are designed with different optimization
goals that lead to different algorithmic considerations.
• E.g., a generational collector helps with scaling and maximizing
throughput
• Having multiple GC threads working in parallel helps speed up the time
it takes to complete the GC work
Designing a Garbage Collector (GC)
Let’s Design a GC
GC
Generational Parallel Work
Young Old
Stop-the-
World Threads
Concurrent
Threads
Maintenance Barriers Maintenance Barriers
The goal is to avoid fragmentation and to not take resources
away from the application:
• The work of marking and compaction can be done in a single
stop-the-world (STW) pause/collection known as the Full GC.
• Avoid concurrent work as that may take resources away from
the application threads.
Designing a Throughput Maximizing GC
Let’s Design a Throughput Maximizing GC
Generational Parallel Work
Young Old
Stop-the-
World Threads
Concurrent
Threads
Maintenance Barriers Maintenance Barriers
GC
Throughput Maximizer
A full compacting GC:
• Can get unpredictable and cause stalls that can cause you to miss delivering on your
system level objectives!
• May not scale well when your application has higher promotion rates with lots of
transients
In-order to be able to scale well and add some predictability, we need to
add:
• Regionalized heap &
• Partial compaction with concurrent marking
But I Can’t Deal With Those Long Pauses
Latency Sensitive
Generational Parallel Work
Partial
Compaction
Concurrent
Marking
Let’s Design a Latency Sensitive GC
Regionalized Heap
Young Old
Maintenance Barriers Maintenance Barriers
So, you need a predictable, scalable, low-latency GC?
• Keep the partial compaction, but make it concurrent
• Set time budgets on the STW phases
• Fall back to concurrent work once time budget is exceeded
• Repeat incremental concurrent work and time budgeted STW phases until work is
done.
• Elicit application threads to help with concurrent compaction aka relocation work – this
is known as ‘self-healing’
But I Can’t Deal With Those Long Pauses Tail Latencies
Low-Latency Sensitive
Generational Parallel Work
Let’s Design a Low-Latency Sensitive GC
Regionalized Heap
Partial/Incremental
Concurrent
Marking
Compaction
Self Healing
Young Old
Maintenance Barriers
Generational
Young Old
Maintenance Barriers
Z GC
Not There
Yet
Introduction to Z Garbage Collector
Design Considerations
ZGC is an adaptive, near-real-time, scalable, predictable low-latency
collector
• It can guarantee sub milliseconds pause times
• The GC pause doesn’t increase with the application heap, live dataset or
the root set sizes
• It can span heap sizes from 8MBs up to 16TBs!
• It works concurrently with your application and strives to not let the
application throughput fall below 15%!
Z GC Design Goals
Z GC Core Concept – Colored Pointers
http://cr.openjdk.java.net/~pliden/slides/ZGC-Jfokus-2018.pdf
Object Address
0
43
Unused
M
a
r
k
e
d
0
M
a
r
k
e
d
1
R
e
m
a
p
p
e
d
F
i
n
a
l
i
z
a
b
l
e
48
63
Object is known to
be marked?
Object is known to
not be pointing into
the relocation set?
Object is reachable
only through a
Finalizer?
Metadata stores in the unused bits of the 64-bit pointers
Virtual address mapping/tagging
Multi-mapping on x86-64, aarch64
Introduction to Z Garbage Collector
Phases
GC Background Threads
Z GC Phases
Java Application Threads
Pause
Mark
Start
Pause
Mark
End
Pause
Relocate
Start
Concurrent
Mark/Remap
Concurrent
Relocate
Concurrent Prepare for
Relocation
GC Background Threads
Concurrent Marking
http://cr.openjdk.java.net/~pliden/slides/ZGC-Jfokus-2018.pdf
Heap
GC
Thread 0
GC
Thread 1
GC
Thread n
…
0 1 … n 0 1 … n 0 1 … n
Stripe 0 Stripe 1 Stripe n
• Heap divided into logical stripes
• GC threads work on their own stripe
• Minimizes shared state
• Load barrier to detect loads of non-marked object pointers
• Concurrent reference processing
• Thread local handshakes
Barriers – Loaded Reference Barrier
• Update a “bad” reference to a “good” reference
• Can be self-healing/repairing barrier when updating the source memory
location
• Imposes a set of invariants –
• “All visible loaded reference values will be safely “marked through” by the
collector, if they haven’t been already.
• All visible loaded reference values point to the current location of the
safely accessible contents of the target objects they refer to.”
Tene, G.; Iyengar, B. & Wolf, M. (2011), C4: The Continuously Concurrent Compacting Collector, in 'Proceedings
of the international symposium on Memory management' , ACM, New York, NY, USA , pp. 79--88 .
Concurrent Compaction
 Load barrier to detect object pointers into the collection set
 Can be self-healing
 Off-heap forwarding tables enable to immediately release and reuse
virtual and physical memory
http://cr.openjdk.java.net/~pliden/slides/ZGC-Jfokus-2018.pdf
Introduction to Z Garbage Collector
Production Readiness
In-order to provide more near-real-time control over the pauses, Z GC has provided many
improvements to OpenJDK HotSpot. Here’s a list of few of the optimizations:
• Thread local handshakes – JDK 10
• Load barriers and colored pointers – JDK 11
• Concurrent reference processing – JDK 11
• Concurrent class unloading – JDK 12
• Uncommit unused memory – JDK 13
• Windows and macOS support; Parallel PreTouch – JDK 14
• Compressed class pointers – JDK 15
• Concurrent Thread Stack Scanning – JDK 16
• Extended AArch64 support – JDK 16 (Windows), JDK 17 (macOS)
Z GC Is Production Ready in JDK 15
Thread Local Handshakes vs Global STW
Application Threads Application Threads
Safepoint
Requested
GC
Completed
Application Threads GC Threads Application Threads
Safepoint
Requested
GC
Completed
Handshakes
Time To Safepoint
(TTSP)
GC Threads
Performance Impact and Considerations
Comparison with G1 GC
Effects of Severe Fragmentation
Due to large LDS, varying object sizes and 1 GB/s allocation rates
System: Arm64 running Linux
JDK version: JDK 16 EA (build 16+35-2229)
Benchmark: HeapFragger
Heap Size: 200Gs (initial and max)
LDS: 100Gs
GCs Tested: ZGC and G1GC
Additional JVM Arguments: -XX:+UseLargePages -XX:+AlwaysPreTouch
Benchmark Allocation Rates: 1GB/s
Object Sizes: min: 128B; max: 32.00032MBs
Test Configuration
A Quick Look: Allocation Rate and Promotions
Allocation Rate Promotions
Graceful Degradation: ZGC with Severe Fragmentation
Stalls Observed By The
Application
Worst Case GC Pause
Time = ~0.55ms
Application Latency : G1 GC vs Z GC @1GB/s Allocation Rate
16GB/s
G1 GC
Z GC
Effects of Large Object Sizes and Higher
Allocation Rates (with 50% LDS Pressure)
System: Arm64 running Linux
JDK version: JDK 17 GA (build 17+35)
Benchmark: HyperAlloc
Heap Size: 80Gs (initial and max)
LDS: 40Gs
Benchmark Threads: 80
GCs Tested: ZGC and G1GC
Additional JVM Arguments: -XX:+UseLargePages -XX:+AlwaysPreTouch
Benchmark Allocation Rates: 4GB/s, 8GB/s, 16GB/s
Object Sizes: min: 128B; max: 32.00032MBs (humongous objects)
Test Configuration
Under Pressure : High Allocation Rate, Short-Lived Objects
Live At Mark Start Live At Relocation End
Reasons For Triggering a GC Cycle
Cause Name Description
Timer When timer is up and if no other GC has been performed
yet.
Warmup Based on heap occupancy and if no other GC has been
performed yet.
Allocation Rate Based on high allocation rates and possibility to run out
of heap space
Allocation Stall Mutator blocked due to lack of heap space
Proactive To maintain lower heap sizes if occupancy increases by
10% since the last GC or 5 minutes have passes since.
High
Utilization
Avoid GC due to ‘Allocation Rate’ trigger by
preventatively trigger GC if heap is 95% occupied and
application has a low allocation rate
Count
Timer Warmup
Allocation Rate Allocation Stall
Proactive High Utilization
Very High Allocation Rates and Effects on ZGC
Worst Case Pause Time
Very High Allocation Rates and Effects on Application
A Quick Comparison With G1
GC Pause Times Latency Observed by Application
Application Latencies Comparison Between G1GC and ZGC
Effects of Large Object Sizes and Higher
Allocation Rates (with 50% LDS & 25% MDS
Pressure)
System: Arm64 running Linux
JDK version: JDK 17 GA (build 17+35)
Benchmark: HyperAlloc
Heap Size: 80Gs (initial and max)
LDS: 40Gs
MDS: 20Gs
Benchmark Threads: 80
GCs Tested: ZGC and G1GC
Additional JVM Arguments: -XX:+UseLargePages -XX:+AlwaysPreTouch
Benchmark Allocation Rates: 4GB/s, 8GB/s, 16GB/s
Object Sizes: min: 128B; max: 32.00032MBs (humongous objects)
Test Configuration
Under Pressure : High Allocation Rate, Medium-Lived Objects
Live At Mark Start Live At Relocation End
Reasons For Triggering a GC Cycle
Cause Name Description
Timer When timer is up and if no other GC has been performed
yet.
Warmup Based on heap occupancy and if no other GC has been
performed yet.
Allocation Rate Based on high allocation rates and possibility to run out
of heap space
Allocation Stall Mutator blocked due to lack of heap space
Proactive To maintain lower heap sizes if occupancy increases by
10% since the last GC or 5 minutes have passes since.
High
Utilization
Avoid GC due to ‘Allocation Rate’ trigger by
preventatively trigger GC if heap is 95% occupied and
application has a low allocation rate
Count
Timer Warmup
Allocation Rate Allocation Stall
Proactive High Utilization
Very High Allocation Rate and Effects on ZGC
Worst Case Pause Time
Allocation Stalls and Effects on Application
A Quick Comparison With G1
Latency Observed by Application
GC Pause Times
© Copyright Microsoft Corporation. All rights reserved.
https://wiki.openjdk.java.net/display/zgc/Main
https://malloc.se/blog/zgc-jdk15
http://cr.openjdk.java.net/~pliden/slides/ZGC-OracleDevLive-2020.pdf
Tools:
Censum and some parsing scripts and JFreeChart + GCHisto
jHiccup: https://support.azul.com/hc/en-us/articles/217877803-How-to-Analyze-and-
Visualize-jHiccup-Logs
HistogramLogAnalyzer: https://github.com/HdrHistogram/HistogramLogAnalyzer
Thank You!

ZGC-SnowOne.pdf

  • 1.
    Z Garbage Collector– Look Ma ~No Pause! - Monica Beckwith - @mon_beck
  • 2.
    Agenda  TheBasic Principles of an Adaptive, Predictable Garbage Collector  Designing a GC  Introduction to Z Garbage Collector  Design Considerations  Phases  Production Readiness  Performance Impact and Considerations  Comparison with G1 GC
  • 3.
    The Basic Principlesof an Adaptive, Predictable Garbage Collector
  • 4.
    OpenJDK HotSpot collectorsare designed with different optimization goals that lead to different algorithmic considerations. • E.g., a generational collector helps with scaling and maximizing throughput • Having multiple GC threads working in parallel helps speed up the time it takes to complete the GC work Designing a Garbage Collector (GC)
  • 5.
    Let’s Design aGC GC Generational Parallel Work Young Old Stop-the- World Threads Concurrent Threads Maintenance Barriers Maintenance Barriers
  • 6.
    The goal isto avoid fragmentation and to not take resources away from the application: • The work of marking and compaction can be done in a single stop-the-world (STW) pause/collection known as the Full GC. • Avoid concurrent work as that may take resources away from the application threads. Designing a Throughput Maximizing GC
  • 7.
    Let’s Design aThroughput Maximizing GC Generational Parallel Work Young Old Stop-the- World Threads Concurrent Threads Maintenance Barriers Maintenance Barriers GC Throughput Maximizer
  • 8.
    A full compactingGC: • Can get unpredictable and cause stalls that can cause you to miss delivering on your system level objectives! • May not scale well when your application has higher promotion rates with lots of transients In-order to be able to scale well and add some predictability, we need to add: • Regionalized heap & • Partial compaction with concurrent marking But I Can’t Deal With Those Long Pauses
  • 9.
    Latency Sensitive Generational ParallelWork Partial Compaction Concurrent Marking Let’s Design a Latency Sensitive GC Regionalized Heap Young Old Maintenance Barriers Maintenance Barriers
  • 10.
    So, you needa predictable, scalable, low-latency GC? • Keep the partial compaction, but make it concurrent • Set time budgets on the STW phases • Fall back to concurrent work once time budget is exceeded • Repeat incremental concurrent work and time budgeted STW phases until work is done. • Elicit application threads to help with concurrent compaction aka relocation work – this is known as ‘self-healing’ But I Can’t Deal With Those Long Pauses Tail Latencies
  • 11.
    Low-Latency Sensitive Generational ParallelWork Let’s Design a Low-Latency Sensitive GC Regionalized Heap Partial/Incremental Concurrent Marking Compaction Self Healing Young Old Maintenance Barriers Maintenance Barriers Generational Young Old Maintenance Barriers Z GC Not There Yet
  • 12.
    Introduction to ZGarbage Collector Design Considerations
  • 13.
    ZGC is anadaptive, near-real-time, scalable, predictable low-latency collector • It can guarantee sub milliseconds pause times • The GC pause doesn’t increase with the application heap, live dataset or the root set sizes • It can span heap sizes from 8MBs up to 16TBs! • It works concurrently with your application and strives to not let the application throughput fall below 15%! Z GC Design Goals
  • 14.
    Z GC CoreConcept – Colored Pointers http://cr.openjdk.java.net/~pliden/slides/ZGC-Jfokus-2018.pdf Object Address 0 43 Unused M a r k e d 0 M a r k e d 1 R e m a p p e d F i n a l i z a b l e 48 63 Object is known to be marked? Object is known to not be pointing into the relocation set? Object is reachable only through a Finalizer? Metadata stores in the unused bits of the 64-bit pointers Virtual address mapping/tagging Multi-mapping on x86-64, aarch64
  • 15.
    Introduction to ZGarbage Collector Phases
  • 16.
    GC Background Threads ZGC Phases Java Application Threads Pause Mark Start Pause Mark End Pause Relocate Start Concurrent Mark/Remap Concurrent Relocate Concurrent Prepare for Relocation GC Background Threads
  • 17.
    Concurrent Marking http://cr.openjdk.java.net/~pliden/slides/ZGC-Jfokus-2018.pdf Heap GC Thread 0 GC Thread1 GC Thread n … 0 1 … n 0 1 … n 0 1 … n Stripe 0 Stripe 1 Stripe n • Heap divided into logical stripes • GC threads work on their own stripe • Minimizes shared state • Load barrier to detect loads of non-marked object pointers • Concurrent reference processing • Thread local handshakes
  • 18.
    Barriers – LoadedReference Barrier • Update a “bad” reference to a “good” reference • Can be self-healing/repairing barrier when updating the source memory location • Imposes a set of invariants – • “All visible loaded reference values will be safely “marked through” by the collector, if they haven’t been already. • All visible loaded reference values point to the current location of the safely accessible contents of the target objects they refer to.” Tene, G.; Iyengar, B. & Wolf, M. (2011), C4: The Continuously Concurrent Compacting Collector, in 'Proceedings of the international symposium on Memory management' , ACM, New York, NY, USA , pp. 79--88 .
  • 19.
    Concurrent Compaction  Loadbarrier to detect object pointers into the collection set  Can be self-healing  Off-heap forwarding tables enable to immediately release and reuse virtual and physical memory http://cr.openjdk.java.net/~pliden/slides/ZGC-Jfokus-2018.pdf
  • 20.
    Introduction to ZGarbage Collector Production Readiness
  • 21.
    In-order to providemore near-real-time control over the pauses, Z GC has provided many improvements to OpenJDK HotSpot. Here’s a list of few of the optimizations: • Thread local handshakes – JDK 10 • Load barriers and colored pointers – JDK 11 • Concurrent reference processing – JDK 11 • Concurrent class unloading – JDK 12 • Uncommit unused memory – JDK 13 • Windows and macOS support; Parallel PreTouch – JDK 14 • Compressed class pointers – JDK 15 • Concurrent Thread Stack Scanning – JDK 16 • Extended AArch64 support – JDK 16 (Windows), JDK 17 (macOS) Z GC Is Production Ready in JDK 15
  • 22.
    Thread Local Handshakesvs Global STW Application Threads Application Threads Safepoint Requested GC Completed Application Threads GC Threads Application Threads Safepoint Requested GC Completed Handshakes Time To Safepoint (TTSP) GC Threads
  • 23.
    Performance Impact andConsiderations Comparison with G1 GC
  • 24.
    Effects of SevereFragmentation Due to large LDS, varying object sizes and 1 GB/s allocation rates
  • 25.
    System: Arm64 runningLinux JDK version: JDK 16 EA (build 16+35-2229) Benchmark: HeapFragger Heap Size: 200Gs (initial and max) LDS: 100Gs GCs Tested: ZGC and G1GC Additional JVM Arguments: -XX:+UseLargePages -XX:+AlwaysPreTouch Benchmark Allocation Rates: 1GB/s Object Sizes: min: 128B; max: 32.00032MBs Test Configuration
  • 26.
    A Quick Look:Allocation Rate and Promotions Allocation Rate Promotions
  • 27.
    Graceful Degradation: ZGCwith Severe Fragmentation Stalls Observed By The Application Worst Case GC Pause Time = ~0.55ms
  • 28.
    Application Latency :G1 GC vs Z GC @1GB/s Allocation Rate 16GB/s G1 GC Z GC
  • 29.
    Effects of LargeObject Sizes and Higher Allocation Rates (with 50% LDS Pressure)
  • 30.
    System: Arm64 runningLinux JDK version: JDK 17 GA (build 17+35) Benchmark: HyperAlloc Heap Size: 80Gs (initial and max) LDS: 40Gs Benchmark Threads: 80 GCs Tested: ZGC and G1GC Additional JVM Arguments: -XX:+UseLargePages -XX:+AlwaysPreTouch Benchmark Allocation Rates: 4GB/s, 8GB/s, 16GB/s Object Sizes: min: 128B; max: 32.00032MBs (humongous objects) Test Configuration
  • 31.
    Under Pressure :High Allocation Rate, Short-Lived Objects Live At Mark Start Live At Relocation End
  • 32.
    Reasons For Triggeringa GC Cycle Cause Name Description Timer When timer is up and if no other GC has been performed yet. Warmup Based on heap occupancy and if no other GC has been performed yet. Allocation Rate Based on high allocation rates and possibility to run out of heap space Allocation Stall Mutator blocked due to lack of heap space Proactive To maintain lower heap sizes if occupancy increases by 10% since the last GC or 5 minutes have passes since. High Utilization Avoid GC due to ‘Allocation Rate’ trigger by preventatively trigger GC if heap is 95% occupied and application has a low allocation rate Count Timer Warmup Allocation Rate Allocation Stall Proactive High Utilization
  • 33.
    Very High AllocationRates and Effects on ZGC Worst Case Pause Time
  • 34.
    Very High AllocationRates and Effects on Application
  • 35.
    A Quick ComparisonWith G1 GC Pause Times Latency Observed by Application
  • 36.
  • 37.
    Effects of LargeObject Sizes and Higher Allocation Rates (with 50% LDS & 25% MDS Pressure)
  • 38.
    System: Arm64 runningLinux JDK version: JDK 17 GA (build 17+35) Benchmark: HyperAlloc Heap Size: 80Gs (initial and max) LDS: 40Gs MDS: 20Gs Benchmark Threads: 80 GCs Tested: ZGC and G1GC Additional JVM Arguments: -XX:+UseLargePages -XX:+AlwaysPreTouch Benchmark Allocation Rates: 4GB/s, 8GB/s, 16GB/s Object Sizes: min: 128B; max: 32.00032MBs (humongous objects) Test Configuration
  • 39.
    Under Pressure :High Allocation Rate, Medium-Lived Objects Live At Mark Start Live At Relocation End
  • 40.
    Reasons For Triggeringa GC Cycle Cause Name Description Timer When timer is up and if no other GC has been performed yet. Warmup Based on heap occupancy and if no other GC has been performed yet. Allocation Rate Based on high allocation rates and possibility to run out of heap space Allocation Stall Mutator blocked due to lack of heap space Proactive To maintain lower heap sizes if occupancy increases by 10% since the last GC or 5 minutes have passes since. High Utilization Avoid GC due to ‘Allocation Rate’ trigger by preventatively trigger GC if heap is 95% occupied and application has a low allocation rate Count Timer Warmup Allocation Rate Allocation Stall Proactive High Utilization
  • 41.
    Very High AllocationRate and Effects on ZGC Worst Case Pause Time
  • 42.
    Allocation Stalls andEffects on Application
  • 43.
    A Quick ComparisonWith G1 Latency Observed by Application GC Pause Times
  • 44.
    © Copyright MicrosoftCorporation. All rights reserved. https://wiki.openjdk.java.net/display/zgc/Main https://malloc.se/blog/zgc-jdk15 http://cr.openjdk.java.net/~pliden/slides/ZGC-OracleDevLive-2020.pdf Tools: Censum and some parsing scripts and JFreeChart + GCHisto jHiccup: https://support.azul.com/hc/en-us/articles/217877803-How-to-Analyze-and- Visualize-jHiccup-Logs HistogramLogAnalyzer: https://github.com/HdrHistogram/HistogramLogAnalyzer Thank You!