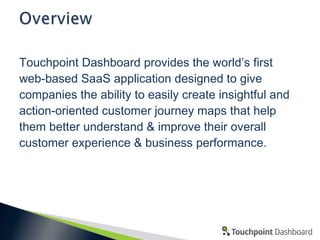
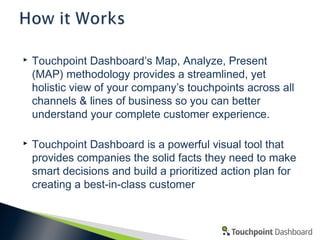
Touchpoint Dashboard provides the world’s first
web-based SaaS application designed to give
companies the ability to easily create insightful and
action-oriented customer journey maps that help
them better understand & improve their overall
customer experience & business performance.


Touchpoint Dashboard’s Map, Analyze, Present
(MAP) methodology provides a streamlined, yet
holistic view of your company’s touchpoints across all
channels & lines of business so you can better
understand your complete customer experience.



Touchpoint Dashboard is a powerful visual tool that
provides companies the solid facts they need to make
smart decisions and build a prioritized action plan for
creating a best-in-class customer
•
•
•
•
•

•
•
•

Keeping 3M in business!
Difficult to transfer
knowledge
Time consuming to create
Difficult to share and
administer updates
One-and-done attitude
Tools are expensive
Static, two dimensional
output
Many hours spent drawing
– not on strategy and
execution
•

•

•

•
•

Create an organized inventory of
all company touchpoints
Audit and measure the
effectiveness and value of every
customer interaction
Identify what’s most important to
customers, and what creates or
detracts from value & loyalty
Get everyone on the same page
Build a compelling case for
change, develop smart
improvement plans and prioritize
funding

Touchpoint Dashboard helps organize,
prototype, prioritize, share, measure, and
present the customer experience for
better decision making


Customer Experience Management suggests an ongoing relationship tied
intimately to data so that the journey map becomes a living decision-making tool.
Touchpoints are:
•Fully customizable
•Data driven
•Linked to the company’s
own measures, custom
scores and models

“Each interaction combines to create the overall experience. By seeing the big picture,
you can identify inefficiencies and opportunities for innovation to improve the overall
experience. One poor interaction can result in a bad experience and dilute brand equity.
Since experiences are a result of multiple interactions, nothing should be left to chance.”
James Torio, http://uxmag.com/articles/experience-maps-identify-inefficiencies-and-opportunities
On the web
www.touchpointdashboard.com
www.twitter.com/tpdashboard
www.facebook.com/tpdashboard
www.youtube.com/tpdashboard
www.slideshare.net/tpdashboard
General Contact Info
8918 W 21st Street North, Suite 200, PMB191, Wichita, KS 67205
PHONE: 888-267-9454

Touchpoint Dashboard Overview

  • 2.
    Touchpoint Dashboard providesthe world’s first web-based SaaS application designed to give companies the ability to easily create insightful and action-oriented customer journey maps that help them better understand & improve their overall customer experience & business performance.
  • 3.
     Touchpoint Dashboard’s Map,Analyze, Present (MAP) methodology provides a streamlined, yet holistic view of your company’s touchpoints across all channels & lines of business so you can better understand your complete customer experience.  Touchpoint Dashboard is a powerful visual tool that provides companies the solid facts they need to make smart decisions and build a prioritized action plan for creating a best-in-class customer
  • 4.
    • • • • • • • • Keeping 3M inbusiness! Difficult to transfer knowledge Time consuming to create Difficult to share and administer updates One-and-done attitude Tools are expensive Static, two dimensional output Many hours spent drawing – not on strategy and execution
  • 5.
    • • • • • Create an organizedinventory of all company touchpoints Audit and measure the effectiveness and value of every customer interaction Identify what’s most important to customers, and what creates or detracts from value & loyalty Get everyone on the same page Build a compelling case for change, develop smart improvement plans and prioritize funding Touchpoint Dashboard helps organize, prototype, prioritize, share, measure, and present the customer experience for better decision making
  • 6.
     Customer Experience Managementsuggests an ongoing relationship tied intimately to data so that the journey map becomes a living decision-making tool. Touchpoints are: •Fully customizable •Data driven •Linked to the company’s own measures, custom scores and models “Each interaction combines to create the overall experience. By seeing the big picture, you can identify inefficiencies and opportunities for innovation to improve the overall experience. One poor interaction can result in a bad experience and dilute brand equity. Since experiences are a result of multiple interactions, nothing should be left to chance.” James Torio, http://uxmag.com/articles/experience-maps-identify-inefficiencies-and-opportunities
  • 7.