How does ahypothesis begin?
Scientists make lots of observations. This
leads them to form scientific questions
about what they have observed. Each
scientist creates an explanation – or
hypothesis – that he or she thinks will
answer the question.
3.
How does ahypothesis begin?
A scientist bases his/her hypothesis both on
what he or she has observed, and on what
he or she already knows to be true.
4.
Making a hypothesisis a step in
the Scientific Method
The 7 basic steps of the scientific method:
1. Asking a question
2. Completing research
3. Making a hypothesis
4. Planning an investigation
5. Recording and analyzing data
6. Explaining the data
7. Communicating the results
5.
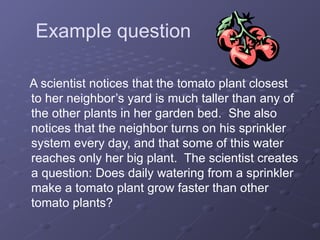
Example question
A scientistnotices that the tomato plant closest
to her neighbor’s yard is much taller than any of
the other plants in her garden bed. She also
notices that the neighbor turns on his sprinkler
system every day, and that some of this water
reaches only her big plant. The scientist creates
a question: Does daily watering from a sprinkler
make a tomato plant grow faster than other
tomato plants?
6.
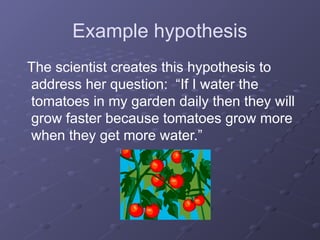
Example hypothesis
The scientistcreates this hypothesis to
address her question: “If I water the
tomatoes in my garden daily then they will
grow faster because tomatoes grow more
when they get more water.”
7.
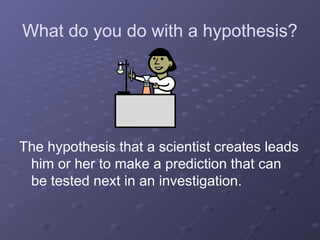
What do youdo with a hypothesis?
The hypothesis that a scientist creates leads
him or her to make a prediction that can
be tested next in an investigation.
8.
What do youdo with a hypothesis?
Notice how the example scientist’s
hypothesis makes a prediction that can be
tested:
“If I water the tomatoes in my garden
daily then they will grow faster because
tomatoes grow more when they get more
water.”
What will the scientist do in the
investigation to test her hypothesis?
9.
A hypothesis isnot just a prediction
In science a prediction is an educated
guess about the expected outcome of a
specific test
In science a hypothesis goes further
A hypothesis includes a possible
explanation about why the expected
outcome of a test will occur
10.
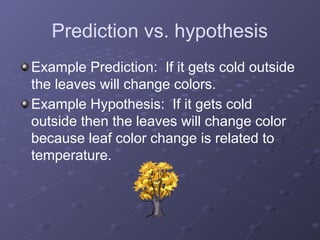
Prediction vs. hypothesis
ExamplePrediction: If it gets cold outside
the leaves will change colors.
Example Hypothesis: If it gets cold
outside then the leaves will change color
because leaf color change is related to
temperature.
11.
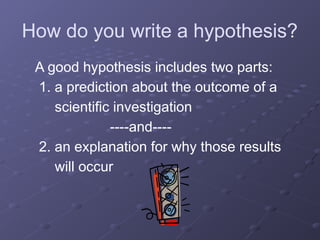
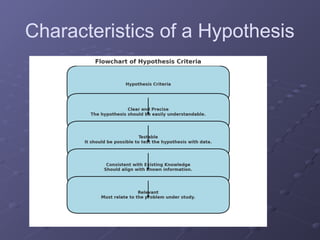
How do youwrite a hypothesis?
A good hypothesis includes two parts:
1. a prediction about the outcome of a
scientific investigation
----and----
2. an explanation for why those results
will occur
12.
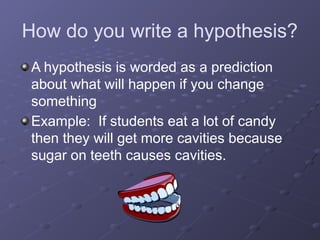
How do youwrite a hypothesis?
A hypothesis is worded as a prediction
about what will happen if you change
something
Example: If students eat a lot of candy
then they will get more cavities because
sugar on teeth causes cavities.
13.
How do youwrite a hypothesis?
A good hypothesis is worded like this:
If…..then…...because…….
OR
I predict…because
I think…because
14.
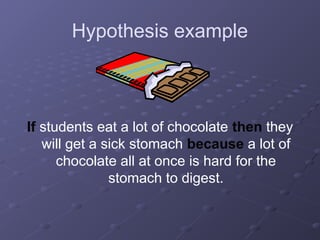
Hypothesis example
If studentseat a lot of chocolate then they
will get a sick stomach because a lot of
chocolate all at once is hard for the
stomach to digest.
15.
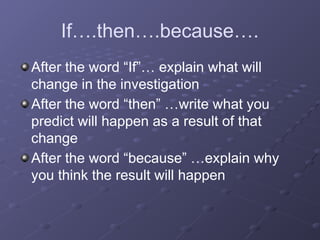
If….then….because….
After the word“If”… explain what will
change in the investigation
After the word “then” …write what you
predict will happen as a result of that
change
After the word “because” …explain why
you think the result will happen
16.
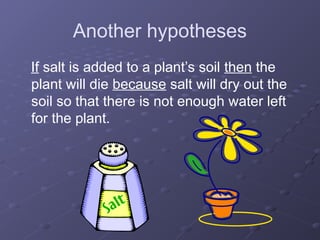
Another hypotheses
If saltis added to a plant’s soil then the
plant will die because salt will dry out the
soil so that there is not enough water left
for the plant.
17.
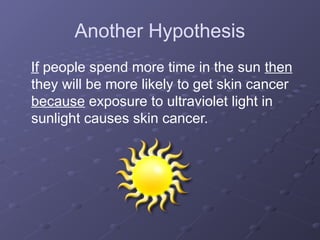
Another Hypothesis
If peoplespend more time in the sun then
they will be more likely to get skin cancer
because exposure to ultraviolet light in
sunlight causes skin cancer.
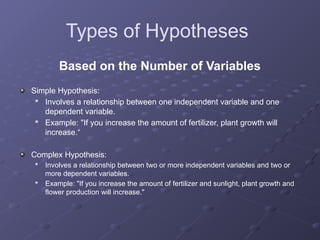
Types of Hypotheses
Basedon the Number of Variables
Simple Hypothesis:
Involves a relationship between one independent variable and one
dependent variable.
Example: "If you increase the amount of fertilizer, plant growth will
increase.“
Complex Hypothesis:
Involves a relationship between two or more independent variables and two or
more dependent variables.
Example: "If you increase the amount of fertilizer and sunlight, plant growth and
flower production will increase."
20.
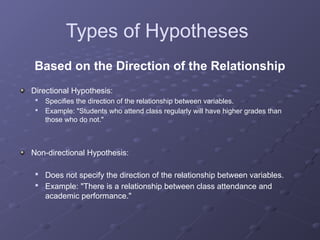
Types of Hypotheses
Basedon the Direction of the Relationship
Directional Hypothesis:
Specifies the direction of the relationship between variables.
Example: "Students who attend class regularly will have higher grades than
those who do not."
Non-directional Hypothesis:
Does not specify the direction of the relationship between variables.
Example: "There is a relationship between class attendance and
academic performance."
21.
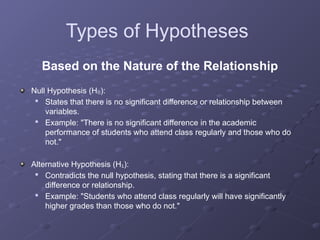
Types of Hypotheses
Basedon the Nature of the Relationship
Null Hypothesis (H ):
₀
States that there is no significant difference or relationship between
variables.
Example: "There is no significant difference in the academic
performance of students who attend class regularly and those who do
not."
Alternative Hypothesis (H ):
₁
Contradicts the null hypothesis, stating that there is a significant
difference or relationship.
Example: "Students who attend class regularly will have significantly
higher grades than those who do not."
22.
Confidence Interval
In research,a Confidence Interval (CI) is
a statistical tool used to indicate the
reliability of an estimate.
It provides a range within which researchers
can be confident that a particular population
parameter (like a mean, proportion, or
difference between groups) lies based on
data collected from a sample.
23.
Confidence Interval
The confidencelevel indicates the degree of certainty
researchers have that the interval contains the true
population parameter. Common confidence levels include:
90% Confidence Level (more lenient, wider intervals)
95% Confidence Level (most commonly used in research)
99% Confidence Level (stricter, narrower intervals)
24.
Example in ResearchContext
Imagine a study assessing the average satisfaction
score for a new online learning platform among
university students. Researchers collect a sample of 200
students and find an average satisfaction score of 4.2
out of 5, with a 95% confidence interval of [4.0, 4.4].
Interpretation: Researchers are 95% confident that the
true mean satisfaction score among the entire population
of students using the platform is between 4.0 and 4.4.
This interval provides a more comprehensive view than
simply stating the average score as 4.2, as it accounts
for the uncertainty in the sample estimate.
25.
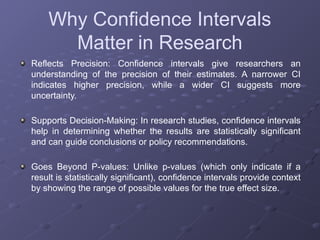
Why Confidence Intervals
Matterin Research
Reflects Precision: Confidence intervals give researchers an
understanding of the precision of their estimates. A narrower CI
indicates higher precision, while a wider CI suggests more
uncertainty.
Supports Decision-Making: In research studies, confidence intervals
help in determining whether the results are statistically significant
and can guide conclusions or policy recommendations.
Goes Beyond P-values: Unlike p-values (which only indicate if a
result is statistically significant), confidence intervals provide context
by showing the range of possible values for the true effect size.
26.
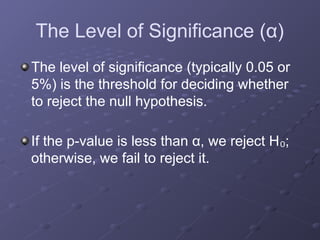
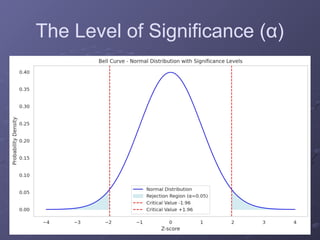
The Level ofSignificance (α)
The level of significance (typically 0.05 or
5%) is the threshold for deciding whether
to reject the null hypothesis.
If the p-value is less than α, we reject H ;
₀
otherwise, we fail to reject it.
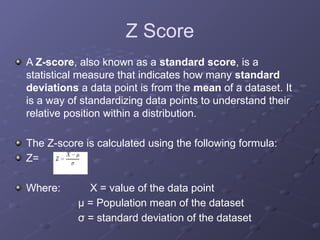
Z Score
A Z-score,also known as a standard score, is a
statistical measure that indicates how many standard
deviations a data point is from the mean of a dataset. It
is a way of standardizing data points to understand their
relative position within a distribution.
The Z-score is calculated using the following formula:
Z=
Where: X = value of the data point
μ = Population mean of the dataset
σ = standard deviation of the dataset
30.
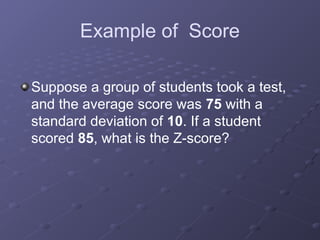
Example of Score
Supposea group of students took a test,
and the average score was 75 with a
standard deviation of 10. If a student
scored 85, what is the Z-score?
31.
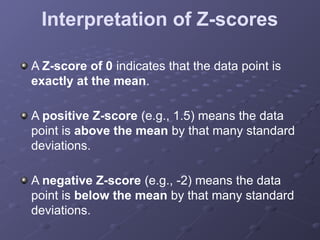
Interpretation of Z-scores
AZ-score of 0 indicates that the data point is
exactly at the mean.
A positive Z-score (e.g., 1.5) means the data
point is above the mean by that many standard
deviations.
A negative Z-score (e.g., -2) means the data
point is below the mean by that many standard
deviations.
32.
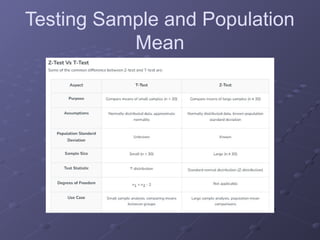
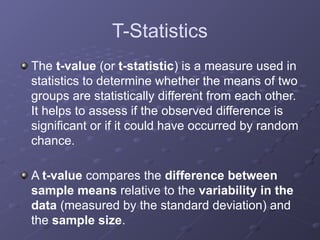
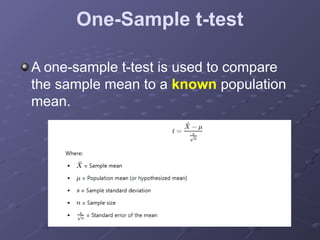
T-Statistics
The t-value (ort-statistic) is a measure used in
statistics to determine whether the means of two
groups are statistically different from each other.
It helps to assess if the observed difference is
significant or if it could have occurred by random
chance.
A t-value compares the difference between
sample means relative to the variability in the
data (measured by the standard deviation) and
the sample size.
Example
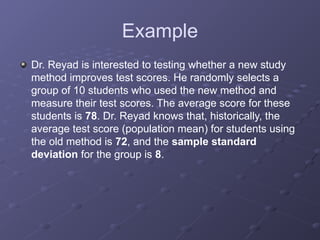
Dr. Reyad isinterested to testing whether a new study
method improves test scores. He randomly selects a
group of 10 students who used the new method and
measure their test scores. The average score for these
students is 78. Dr. Reyad knows that, historically, the
average test score (population mean) for students using
the old method is 72, and the sample standard
deviation for the group is 8.
35.
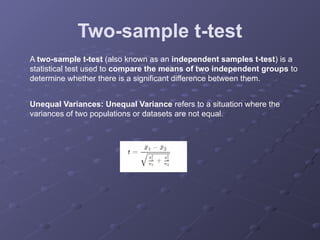
Two-sample t-test
A two-samplet-test (also known as an independent samples t-test) is a
statistical test used to compare the means of two independent groups to
determine whether there is a significant difference between them.
Unequal Variances: Unequal Variance refers to a situation where the
variances of two populations or datasets are not equal.
36.
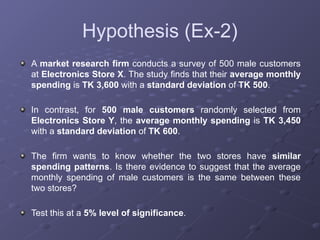
Hypothesis (Ex-2)
A marketresearch firm conducts a survey of 500 male customers
at Electronics Store X. The study finds that their average monthly
spending is TK 3,600 with a standard deviation of TK 500.
In contrast, for 500 male customers randomly selected from
Electronics Store Y, the average monthly spending is TK 3,450
with a standard deviation of TK 600.
The firm wants to know whether the two stores have similar
spending patterns. Is there evidence to suggest that the average
monthly spending of male customers is the same between these
two stores?
Test this at a 5% level of significance.
37.
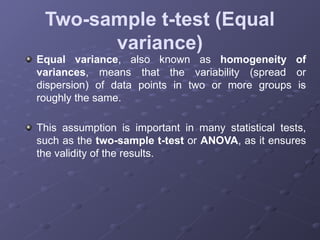
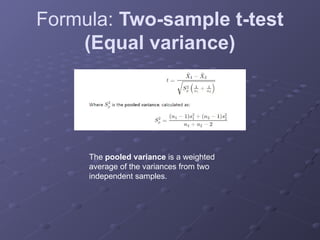
Two-sample t-test (Equal
variance)
Equalvariance, also known as homogeneity of
variances, means that the variability (spread or
dispersion) of data points in two or more groups is
roughly the same.
This assumption is important in many statistical tests,
such as the two-sample t-test or ANOVA, as it ensures
the validity of the results.
38.
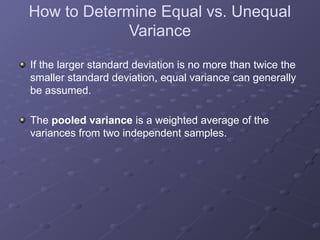
How to DetermineEqual vs. Unequal
Variance
If the larger standard deviation is no more than twice the
smaller standard deviation, equal variance can generally
be assumed.
The pooled variance is a weighted average of the
variances from two independent samples.
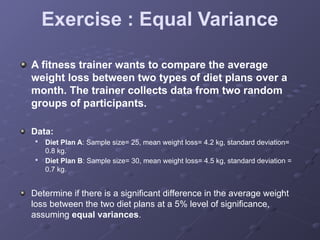
Exercise : EqualVariance
A fitness trainer wants to compare the average
weight loss between two types of diet plans over a
month. The trainer collects data from two random
groups of participants.
Data:
Diet Plan A: Sample size= 25, mean weight loss= 4.2 kg, standard deviation=
0.8 kg.
Diet Plan B: Sample size= 30, mean weight loss= 4.5 kg, standard deviation =
0.7 kg.
Determine if there is a significant difference in the average weight
loss between the two diet plans at a 5% level of significance,
assuming equal variances.
41.
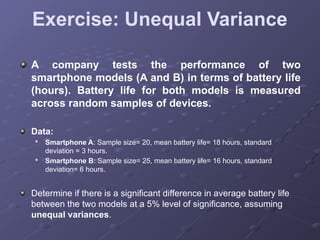
Exercise: Unequal Variance
Acompany tests the performance of two
smartphone models (A and B) in terms of battery life
(hours). Battery life for both models is measured
across random samples of devices.
Data:
Smartphone A: Sample size= 20, mean battery life= 18 hours, standard
deviation = 3 hours.
Smartphone B: Sample size= 25, mean battery life= 16 hours, standard
deviation= 6 hours.
Determine if there is a significant difference in average battery life
between the two models at a 5% level of significance, assuming
unequal variances.
42.
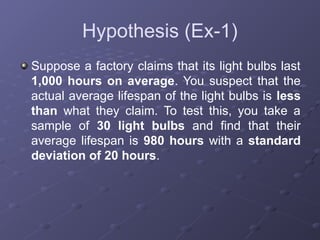
Hypothesis (Ex-1)
Suppose afactory claims that its light bulbs last
1,000 hours on average. You suspect that the
actual average lifespan of the light bulbs is less
than what they claim. To test this, you take a
sample of 30 light bulbs and find that their
average lifespan is 980 hours with a standard
deviation of 20 hours.

![Example in Research Context
Imagine a study assessing the average satisfaction
score for a new online learning platform among
university students. Researchers collect a sample of 200
students and find an average satisfaction score of 4.2
out of 5, with a 95% confidence interval of [4.0, 4.4].
Interpretation: Researchers are 95% confident that the
true mean satisfaction score among the entire population
of students using the platform is between 4.0 and 4.4.
This interval provides a more comprehensive view than
simply stating the average score as 4.2, as it accounts
for the uncertainty in the sample estimate.](https://image.slidesharecdn.com/topic7hypothesis-250408182151-f2c3d4a3/85/Topic-7-What-is-a-hypothesis-and-hypothesis-testing-pptx-24-320.jpg)