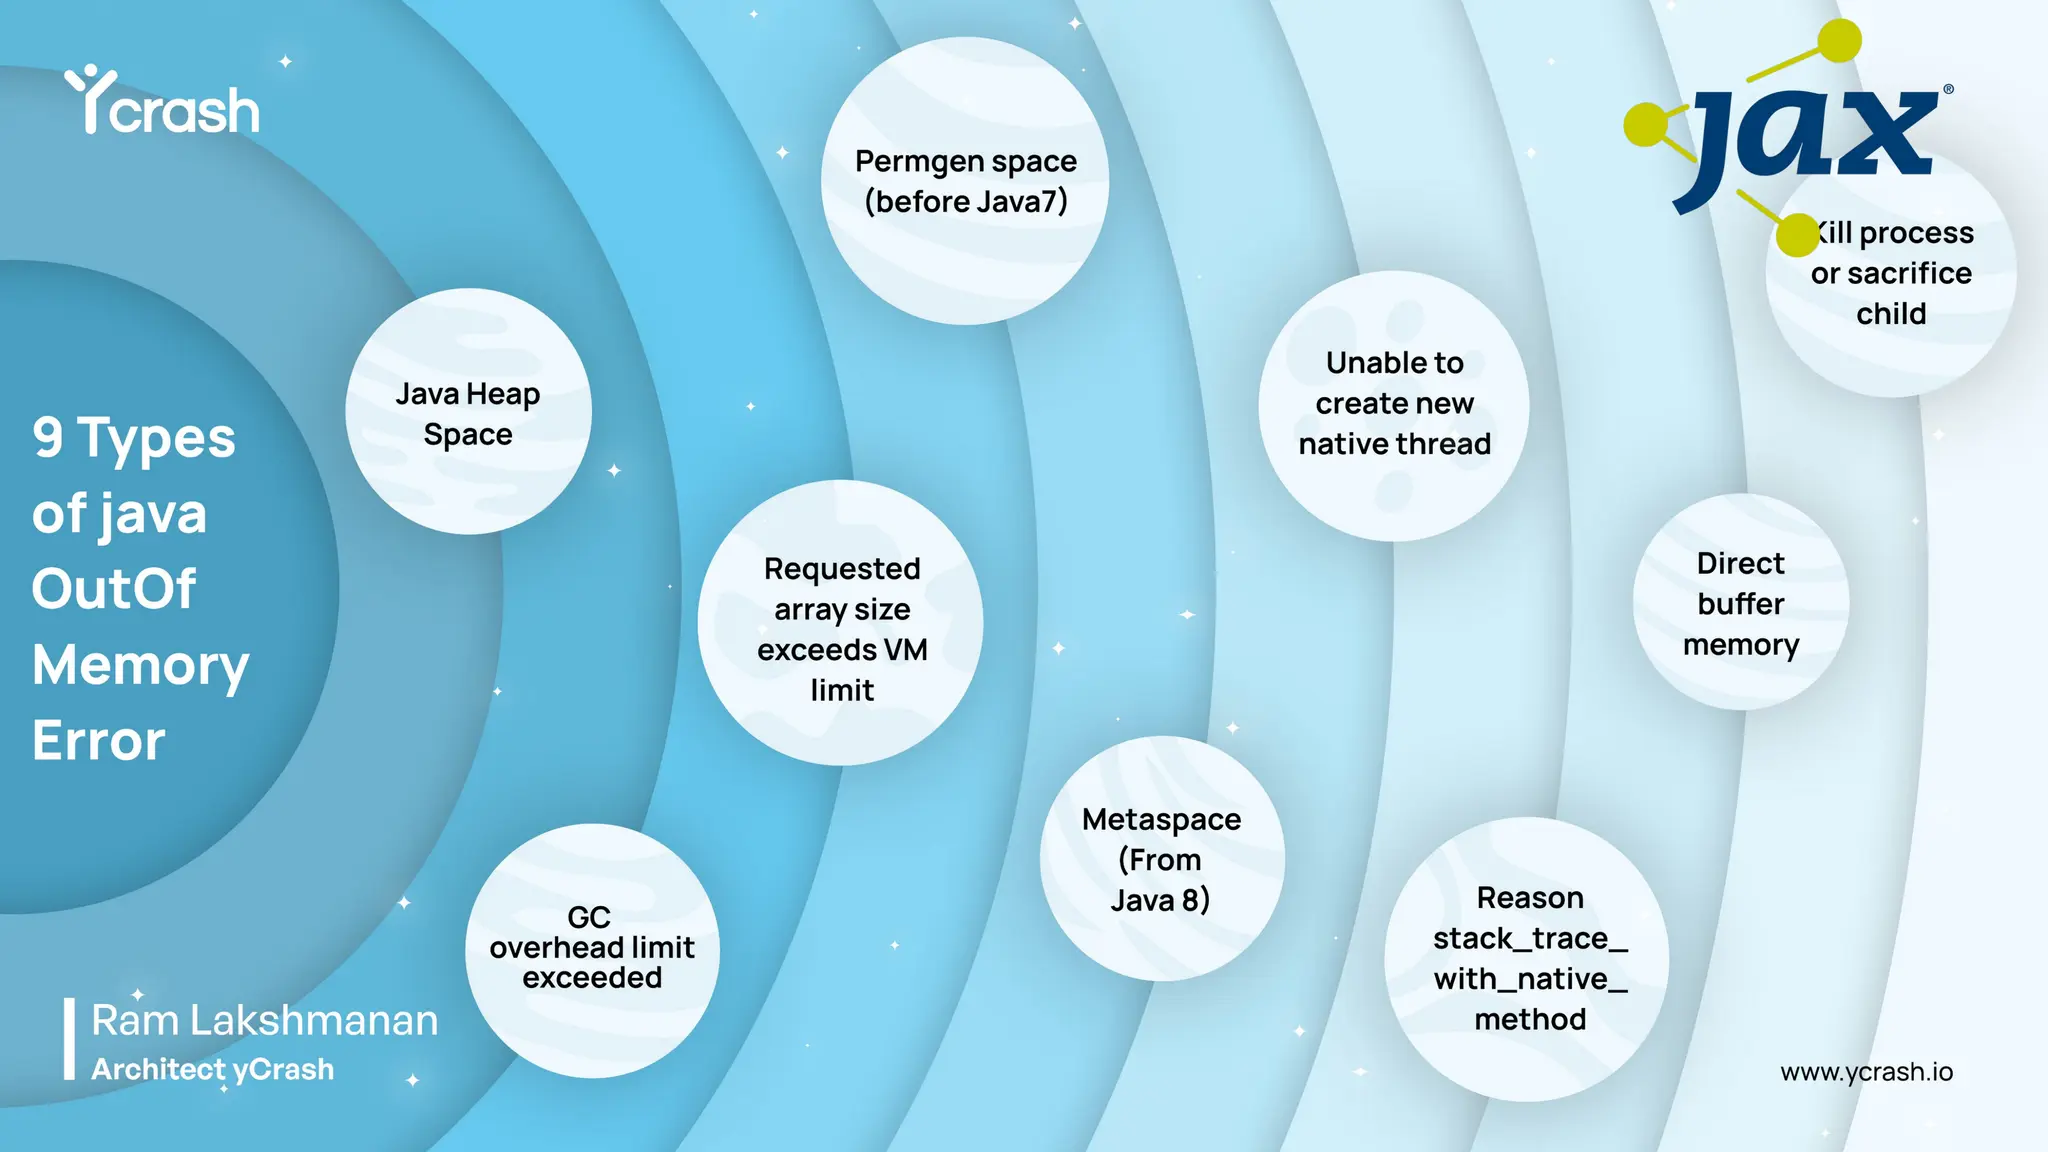
1
Does Java process memory utilization go beyond –Xmx?
2
–XX:MaxMetaspaceSize
-Xmx
Young Old
Metaspac
e
Threads JNI misc
GC
Direc
t
Buff
Code
Cach
e
Heap Memory Native Memory
Java Process Memory
3
Demo
OutOfMemoryError
4
How to know the type of OutOfMemoryError?
java.lang.OutOfMemoryError: <type>
5
Java Heap Space
1
Metaspac
e
Threads JNI misc
GC
Direc
t
Buff
Code
Cach
e
Heap Memory Native Memory
JVM Memory
Most common type
-Xmx
6
GC Behavior of a Healthy Application
- Full Garbage Collection Event
7
GC Behavior of Acute Memory Leak
- Full Garbage Collection Event
8
GC Behavior when there is a Memory Leak
- Full Garbage Collection Event
9
How to study GC Behavior?
-XX:+PrintGCDetails -XX:+PrintGCDateStamps -Xloggc:<file-path>
Till Java 8
-Xlog:gc*:file=<file-path>
From Java 9
Enable GC logs (always)
Almost zero overhead
10
GCeasy
GC Log Analysis Demo
11
How to capture Heap Dumps?
8 options: https://blog.heaphero.io/2017/10/13/how-to-capture-java-heap-dumps-7-options/
1. GC Log
10. netstat
12. vmstat
2. Thread Dump
9. dmesg
3. Heap Dump
6. ps
8. Disk Usage
5. top 13. iostat
11. ping
14. Kernel Params
15. App Logs
16. metadata
4. Heap Substitute
7. top -H
12
Open-source script:
https://github.com/ycrash/yc-data-script
360° Troubleshooting artifacts
./yc –p <PROCESS_ID>
13
HeapHero
How to analyze Heap Dump?
14
OutOfMemoryError: Java Heap Space
Causes
1. Memory leak due to
buggy code
2. Increase in Traffic
Volume
Solutions
1. Fix Memory Leak in the
code
2. Increase heap size (-Xmx)
Artifacts
1. Garbage Collection Log
2. Heap Dump
Tools
1. GCeasy (GC log
analysis)
2. HeapHero
3. Eclipse MAT
4. JVisualVM
15
GC overhead limit exceeded
2
Metaspac
e
Threads JNI misc
GC
Direc
t
Buff
Code
Cach
e
Heap Memory Native Memory
JVM Memory
-Xmx
16
OutOfMemoryError: GC overhead limit exceeded
Diagnosis: Same as ‘Java Heap Space’ 
Java process is spending more than 98% of its time doing garbage collection and recovering
less than 2% of the heap and has been doing so far the last 5 consecutive garbage
collections
17
Requested array size exceeds VM limit
3
Young Old
Metaspac
e
Threads JNI misc
GC
Direc
t
Buff
Code
Cach
e
Heap Memory Native Memory
JVM Memory
18
Demo
OutOfMemoryError: Requested array size exceeds VM
limit
19
OutOfMemoryError: Requested array size exceeds VM limit
Causes
1. Allocated array larger than
heap size
Solutions
1. Fix code which allocates large
array size
2. Increase heap size (-Xmx)
Artifacts
1. Application Log or std
error
Tools
20
CrowdStrike: Largest software outage in history
Root Cause: Out of bound Memory Reads
21
Metaspace
4
Young Old Threads JNI misc
GC
Direc
t
Buff
Code
Cach
e
Heap Memory Native Memory
JVM Memory
22
Metaspace Memory Leak
- Full Garbage Collection Event
23
Demo
OutOfMemoryError: Metaspace
24
How to study Metaspace Behavior?
java {app_name} -verbose:class
Till Java 8
java {app_name} -
Xlog:class+load=info:<filename>
From Java 9
25
OutOfMemoryError: Metaspace
Causes
1. Creating large number of
Dynamic classes (Java
Reflection, Groovy type of
scripting languages)
2. Loading large number of
Classes (3rd
party
libraries/frameworks)
3. Loading large number of
Classloaders
Solutions
1. Fix Memory Leak code
2. Increase -XX:MetaspaceSize
and
-XX:MaxMetaspaceSize.
Artifacts
1. Java 8 & below: java
{app_name} -verbose:class
2. Java 9 & above: java
{app_name} -
Xlog:class+load=info:<filena
me>
3. jcmd {pid} GC.class_histogram
4. Heap Dump
Tools
1. GCeasy (GC log analysis)
2. HeapHero
3. Eclipse MAT
26
Permgen space
5
Young Old Threads JNI misc
GC
Direc
t
Buff
Code
Cach
e
Heap Memory Native Memory
JVM Memory
Happens only in Java 7 & below
27
OutOfMemoryError: Permgen Space
Diagnosis: Same as ‘Metaspace’ 
28
Unable to create new native threads
6
Young Old
Metaspac
e
JNI misc
GC
Direc
t
Buff
Code
Cach
e
Heap Memory Native Memory
JVM Memory
29
How to capture Thread Dump?
9 options:https://blog.fastthread.io/how-to-take-thread-dumps-7-options/
1. GC Log
10. netstat
12. vmstat
2. Thread Dump
9. dmesg
3. Heap Dump
6. ps
8. Disk Usage
5. top 13. iostat
11. ping
14. Kernel Params
15. App Logs
16. metadata
4. Heap Substitute
7. top -H
30
Open-source script:
https://github.com/ycrash/yc-data-script
360° Troubleshooting artifacts
31
Real Case Study
Slowdown in a Major Financial Institution’s Middleware in
USA
http://fastthread.io/my-thread-report.jsp?p=c2hhcmVkLzIwMTcvMDMvMTQvLS10aHJlYWREdW1wLTIudHh0LS0xMi0yOC0zMw==&s=t
32
OutOfMemoryError: Unable to create new native
threads
Causes
1. Threads are leaking
Solutions
1. Fix thread leak
2. Increase the Thread Limits Set
at Operating System(ulimit –u)
3. Kill other processes
4. Increase RAM capacity
5. Reduce Java Heap Size
6. Reduce thread stack size (-Xss).
Note: can cause
Artifacts
1. Thread Dump
Tools
1. FastThread
2. Text Editor
33
Direct buffer memory
7
Young Old
Metaspac
e
Threads JNI misc
GC
Code
Cach
e
Heap Memory Native Memory
JVM Memory
Becoming Pervasive in modern Spring Boot Frameworks
34
Demo
OutOfMemoryError: Direct buffer Memory
35
OutOfMemoryError: Direct buffer memory
Causes
1. Increase(or Leak) in direct
buffers usage
a. java.nio package
b. Moving from Spring
RestTemplate to WebClient
c. Image Processing Libraries
d. Networking Libraries
e. Some JDBC Drivers
Solutions
1. Fix Memory Leak code
2. Increase -
XX:MaxDirectMemorySize
3. Upgrade to Java 17 (There some
issues in Java 11)
Artifacts
1. App Log or Std error
2. Native Memory
Tracking
Tools
36
Kill process or sacrifice child
8
JVM Kernel
X
1. GC Log
10. netstat
12. vmstat
2. Thread Dump
9. dmesg
3. Heap Dump
6. ps
8. Disk Usage
5. top 13. iostat
11. ping
14. Kernel Params
15. App Logs
16. metadata
4. Heap Substitute
7. top -H
37
Open-source script:
https://github.com/ycrash/yc-data-script
360° Troubleshooting artifacts
38
39
Real Case Study
Intermittent HTTP 502 errors in AWS EBS Service
EBS Architecture
40
Clue: Nginx Error
41
42
43
OutOfMemoryError: Kill process or sacrifice child
Causes
1. Lack of RAM capacity
2. High Memory utilization by
other processes in the
environment
3. Memory Leak in the code
Solutions
1. Kill other processes
2. Increase RAM capacity
3. Fix Memory Leak in the code
Artifacts
1. dmesg
2. GC Log
3. Heap Dump
4. Native Memory Tracking
Tools
1. HeapHero
2. Eclipse MAT
3. yCrash
44
Reason stack_trace_with_native_method
9
Young Old
Metaspac
e
Threads misc
GC
Direc
t
Buff
Code
Cach
e
Heap Memory Native Memory
JVM Memory
45
OutOfMemoryError: Reason stack_trace_with_native_method
Don’t worry, if you are not using JNI 
46
OutOfMemoryError: Reason stack_trace_with_native_method
Causes
1. Heavy Usage of Native
Methods
2. Recursive Native Method
Calls
Solutions
1. Fix the problem in the native
app
Tools
1. OS native tools
a. Dtrace
b. pmap
c. pstack
Artifacts
1. Application Log or std
error
47
You need data
GC Log Heap Dump
1. Java Heap Space
2. GC overhead limit exceeded
3. Requested array size exceeds VM limit
7. Direct buffer Memory
App Logs
Verbose Class Log
4. Metaspace
5. PermGen Space
Thread Dump
6. Unable to create native threads
dmesg
8. Kill process or
sacrifice child
GC Log
1. GC Log
10. netstat
12. vmstat
2. Thread Dump
9. dmesg
3. Heap Dump
6. ps
8. Disk Usage
5. top 13. iostat
11. ping
14. Kernel Params
15. App Logs
16. metadata
4. Heap Substitute
7. top -H
48
Open-source script:
https://github.com/ycrash/yc-data-script
360° Troubleshooting artifacts
Ram Lakshmanan ram@tier1app.com
@tier1app https://www.linkedin.com/company/ycrash
This deck will be published in:
https://blog.heaphero.io
If you want to learn more …
49
THANK YOU
FRIENDS

How to Troubleshoot 9 Types of OutOfMemoryError

  • 1.
  • 2.
    Does Java processmemory utilization go beyond –Xmx? 2 –XX:MaxMetaspaceSize -Xmx Young Old Metaspac e Threads JNI misc GC Direc t Buff Code Cach e Heap Memory Native Memory Java Process Memory
  • 3.
  • 4.
    4 How to knowthe type of OutOfMemoryError? java.lang.OutOfMemoryError: <type>
  • 5.
    5 Java Heap Space 1 Metaspac e ThreadsJNI misc GC Direc t Buff Code Cach e Heap Memory Native Memory JVM Memory Most common type -Xmx
  • 6.
    6 GC Behavior ofa Healthy Application - Full Garbage Collection Event
  • 7.
    7 GC Behavior ofAcute Memory Leak - Full Garbage Collection Event
  • 8.
    8 GC Behavior whenthere is a Memory Leak - Full Garbage Collection Event
  • 9.
    9 How to studyGC Behavior? -XX:+PrintGCDetails -XX:+PrintGCDateStamps -Xloggc:<file-path> Till Java 8 -Xlog:gc*:file=<file-path> From Java 9 Enable GC logs (always) Almost zero overhead
  • 10.
  • 11.
    11 How to captureHeap Dumps? 8 options: https://blog.heaphero.io/2017/10/13/how-to-capture-java-heap-dumps-7-options/
  • 12.
    1. GC Log 10.netstat 12. vmstat 2. Thread Dump 9. dmesg 3. Heap Dump 6. ps 8. Disk Usage 5. top 13. iostat 11. ping 14. Kernel Params 15. App Logs 16. metadata 4. Heap Substitute 7. top -H 12 Open-source script: https://github.com/ycrash/yc-data-script 360° Troubleshooting artifacts ./yc –p <PROCESS_ID>
  • 13.
  • 14.
    14 OutOfMemoryError: Java HeapSpace Causes 1. Memory leak due to buggy code 2. Increase in Traffic Volume Solutions 1. Fix Memory Leak in the code 2. Increase heap size (-Xmx) Artifacts 1. Garbage Collection Log 2. Heap Dump Tools 1. GCeasy (GC log analysis) 2. HeapHero 3. Eclipse MAT 4. JVisualVM
  • 15.
    15 GC overhead limitexceeded 2 Metaspac e Threads JNI misc GC Direc t Buff Code Cach e Heap Memory Native Memory JVM Memory -Xmx
  • 16.
    16 OutOfMemoryError: GC overheadlimit exceeded Diagnosis: Same as ‘Java Heap Space’  Java process is spending more than 98% of its time doing garbage collection and recovering less than 2% of the heap and has been doing so far the last 5 consecutive garbage collections
  • 17.
    17 Requested array sizeexceeds VM limit 3 Young Old Metaspac e Threads JNI misc GC Direc t Buff Code Cach e Heap Memory Native Memory JVM Memory
  • 18.
  • 19.
    19 OutOfMemoryError: Requested arraysize exceeds VM limit Causes 1. Allocated array larger than heap size Solutions 1. Fix code which allocates large array size 2. Increase heap size (-Xmx) Artifacts 1. Application Log or std error Tools
  • 20.
    20 CrowdStrike: Largest softwareoutage in history Root Cause: Out of bound Memory Reads
  • 21.
    21 Metaspace 4 Young Old ThreadsJNI misc GC Direc t Buff Code Cach e Heap Memory Native Memory JVM Memory
  • 22.
    22 Metaspace Memory Leak -Full Garbage Collection Event
  • 23.
  • 24.
    24 How to studyMetaspace Behavior? java {app_name} -verbose:class Till Java 8 java {app_name} - Xlog:class+load=info:<filename> From Java 9
  • 25.
    25 OutOfMemoryError: Metaspace Causes 1. Creatinglarge number of Dynamic classes (Java Reflection, Groovy type of scripting languages) 2. Loading large number of Classes (3rd party libraries/frameworks) 3. Loading large number of Classloaders Solutions 1. Fix Memory Leak code 2. Increase -XX:MetaspaceSize and -XX:MaxMetaspaceSize. Artifacts 1. Java 8 & below: java {app_name} -verbose:class 2. Java 9 & above: java {app_name} - Xlog:class+load=info:<filena me> 3. jcmd {pid} GC.class_histogram 4. Heap Dump Tools 1. GCeasy (GC log analysis) 2. HeapHero 3. Eclipse MAT
  • 26.
    26 Permgen space 5 Young OldThreads JNI misc GC Direc t Buff Code Cach e Heap Memory Native Memory JVM Memory Happens only in Java 7 & below
  • 27.
  • 28.
    28 Unable to createnew native threads 6 Young Old Metaspac e JNI misc GC Direc t Buff Code Cach e Heap Memory Native Memory JVM Memory
  • 29.
    29 How to captureThread Dump? 9 options:https://blog.fastthread.io/how-to-take-thread-dumps-7-options/
  • 30.
    1. GC Log 10.netstat 12. vmstat 2. Thread Dump 9. dmesg 3. Heap Dump 6. ps 8. Disk Usage 5. top 13. iostat 11. ping 14. Kernel Params 15. App Logs 16. metadata 4. Heap Substitute 7. top -H 30 Open-source script: https://github.com/ycrash/yc-data-script 360° Troubleshooting artifacts
  • 31.
    31 Real Case Study Slowdownin a Major Financial Institution’s Middleware in USA http://fastthread.io/my-thread-report.jsp?p=c2hhcmVkLzIwMTcvMDMvMTQvLS10aHJlYWREdW1wLTIudHh0LS0xMi0yOC0zMw==&s=t
  • 32.
    32 OutOfMemoryError: Unable tocreate new native threads Causes 1. Threads are leaking Solutions 1. Fix thread leak 2. Increase the Thread Limits Set at Operating System(ulimit –u) 3. Kill other processes 4. Increase RAM capacity 5. Reduce Java Heap Size 6. Reduce thread stack size (-Xss). Note: can cause Artifacts 1. Thread Dump Tools 1. FastThread 2. Text Editor
  • 33.
    33 Direct buffer memory 7 YoungOld Metaspac e Threads JNI misc GC Code Cach e Heap Memory Native Memory JVM Memory Becoming Pervasive in modern Spring Boot Frameworks
  • 34.
  • 35.
    35 OutOfMemoryError: Direct buffermemory Causes 1. Increase(or Leak) in direct buffers usage a. java.nio package b. Moving from Spring RestTemplate to WebClient c. Image Processing Libraries d. Networking Libraries e. Some JDBC Drivers Solutions 1. Fix Memory Leak code 2. Increase - XX:MaxDirectMemorySize 3. Upgrade to Java 17 (There some issues in Java 11) Artifacts 1. App Log or Std error 2. Native Memory Tracking Tools
  • 36.
    36 Kill process orsacrifice child 8 JVM Kernel X
  • 37.
    1. GC Log 10.netstat 12. vmstat 2. Thread Dump 9. dmesg 3. Heap Dump 6. ps 8. Disk Usage 5. top 13. iostat 11. ping 14. Kernel Params 15. App Logs 16. metadata 4. Heap Substitute 7. top -H 37 Open-source script: https://github.com/ycrash/yc-data-script 360° Troubleshooting artifacts
  • 38.
  • 39.
    39 Real Case Study IntermittentHTTP 502 errors in AWS EBS Service
  • 40.
  • 41.
  • 42.
  • 43.
    43 OutOfMemoryError: Kill processor sacrifice child Causes 1. Lack of RAM capacity 2. High Memory utilization by other processes in the environment 3. Memory Leak in the code Solutions 1. Kill other processes 2. Increase RAM capacity 3. Fix Memory Leak in the code Artifacts 1. dmesg 2. GC Log 3. Heap Dump 4. Native Memory Tracking Tools 1. HeapHero 2. Eclipse MAT 3. yCrash
  • 44.
    44 Reason stack_trace_with_native_method 9 Young Old Metaspac e Threadsmisc GC Direc t Buff Code Cach e Heap Memory Native Memory JVM Memory
  • 45.
  • 46.
    46 OutOfMemoryError: Reason stack_trace_with_native_method Causes 1.Heavy Usage of Native Methods 2. Recursive Native Method Calls Solutions 1. Fix the problem in the native app Tools 1. OS native tools a. Dtrace b. pmap c. pstack Artifacts 1. Application Log or std error
  • 47.
    47 You need data GCLog Heap Dump 1. Java Heap Space 2. GC overhead limit exceeded 3. Requested array size exceeds VM limit 7. Direct buffer Memory App Logs Verbose Class Log 4. Metaspace 5. PermGen Space Thread Dump 6. Unable to create native threads dmesg 8. Kill process or sacrifice child GC Log
  • 48.
    1. GC Log 10.netstat 12. vmstat 2. Thread Dump 9. dmesg 3. Heap Dump 6. ps 8. Disk Usage 5. top 13. iostat 11. ping 14. Kernel Params 15. App Logs 16. metadata 4. Heap Substitute 7. top -H 48 Open-source script: https://github.com/ycrash/yc-data-script 360° Troubleshooting artifacts
  • 49.
    Ram Lakshmanan ram@tier1app.com @tier1apphttps://www.linkedin.com/company/ycrash This deck will be published in: https://blog.heaphero.io If you want to learn more … 49 THANK YOU FRIENDS

Editor's Notes

  • #3 Eclipse: MemoryLeakDemo, LaunchPad_oom
  • #10 Gceasy - C:\workspace\speeches\9-types-oom\gc-memory-leak.zip
  • #11 https://blog.heaphero.io/2017/10/13/how-to-capture-java-heap-dumps-7-options/
  • #13 http://localhost:8080/heap-index.jsp c:\workspace-tmp\webinar-2025-02-12.hprof http://localhost:8080/heap-report-wc.jsp?p=RmxpYjBXVjZMYlY2QTVOSlB1NS9tZzdmSGt0QXUzdzNIZDQ5cUx4dHVOeUw5TDQvcHJZLzFQeDZicC80cVB3bVdoUTJYS2VvN09rWWwrNlV4Mk5TQitKaGlGbk1IOTgwbjkyem90ek9Qbk91ZjM1R0lLTTIxNXBaSGdFd1p5Rk8= http://localhost:8080/heap-index.jsp C:\workspace\speeches\9-types-oom\
  • #17 OOMRequestedArraySizeExceedsVMLimit
  • #18 OOMRequestedArraySizeExceedsVMLimit
  • #22 https://gceasy.io/my-gc-report.jsp?p=c2hhcmVkLzIwMjIvMDcvMTYvbWV0YXNwYWNlLW9vbWVycm9yLmdjLS0xOC0xNy0zMg==&s=t&channel=WEB
  • #23 OOMMetaspace
  • #25 OOMMetaspace_verbose
  • #29 https://blog.fastthread.io/how-to-take-thread-dumps-7-options/
  • #31 C:\workspace\speeches\9-types-oom\thread-leak.txt http://localhost:8080/my-thread-report.jsp?p=Qzpcd29ya3NwYWNlLXRtcFxlZS11cGxvYWRzMlxzaGFyZWRcMjAyNS01LTZcdGhyZWFkLWxlYWsudHh0LTIwLTU3LTM5Ozs=&
  • #34 OOMDirectBuffer
  • #38 https://test.ycrash.io/yc-report-kernel.jsp?ou=czlWbG0rUko0UXAxazlSbjZrSUIwUT09&de=172.31.7.106&app=yc&ts=2023-09-01T10-25-39
  • #42 https://test.ycrash.io/yc-report-kernel.jsp?ou=czlWbG0rUko0UXAxazlSbjZrSUIwUT09&de=172.31.7.106&app=yc&ts=2023-09-01T10-25-39