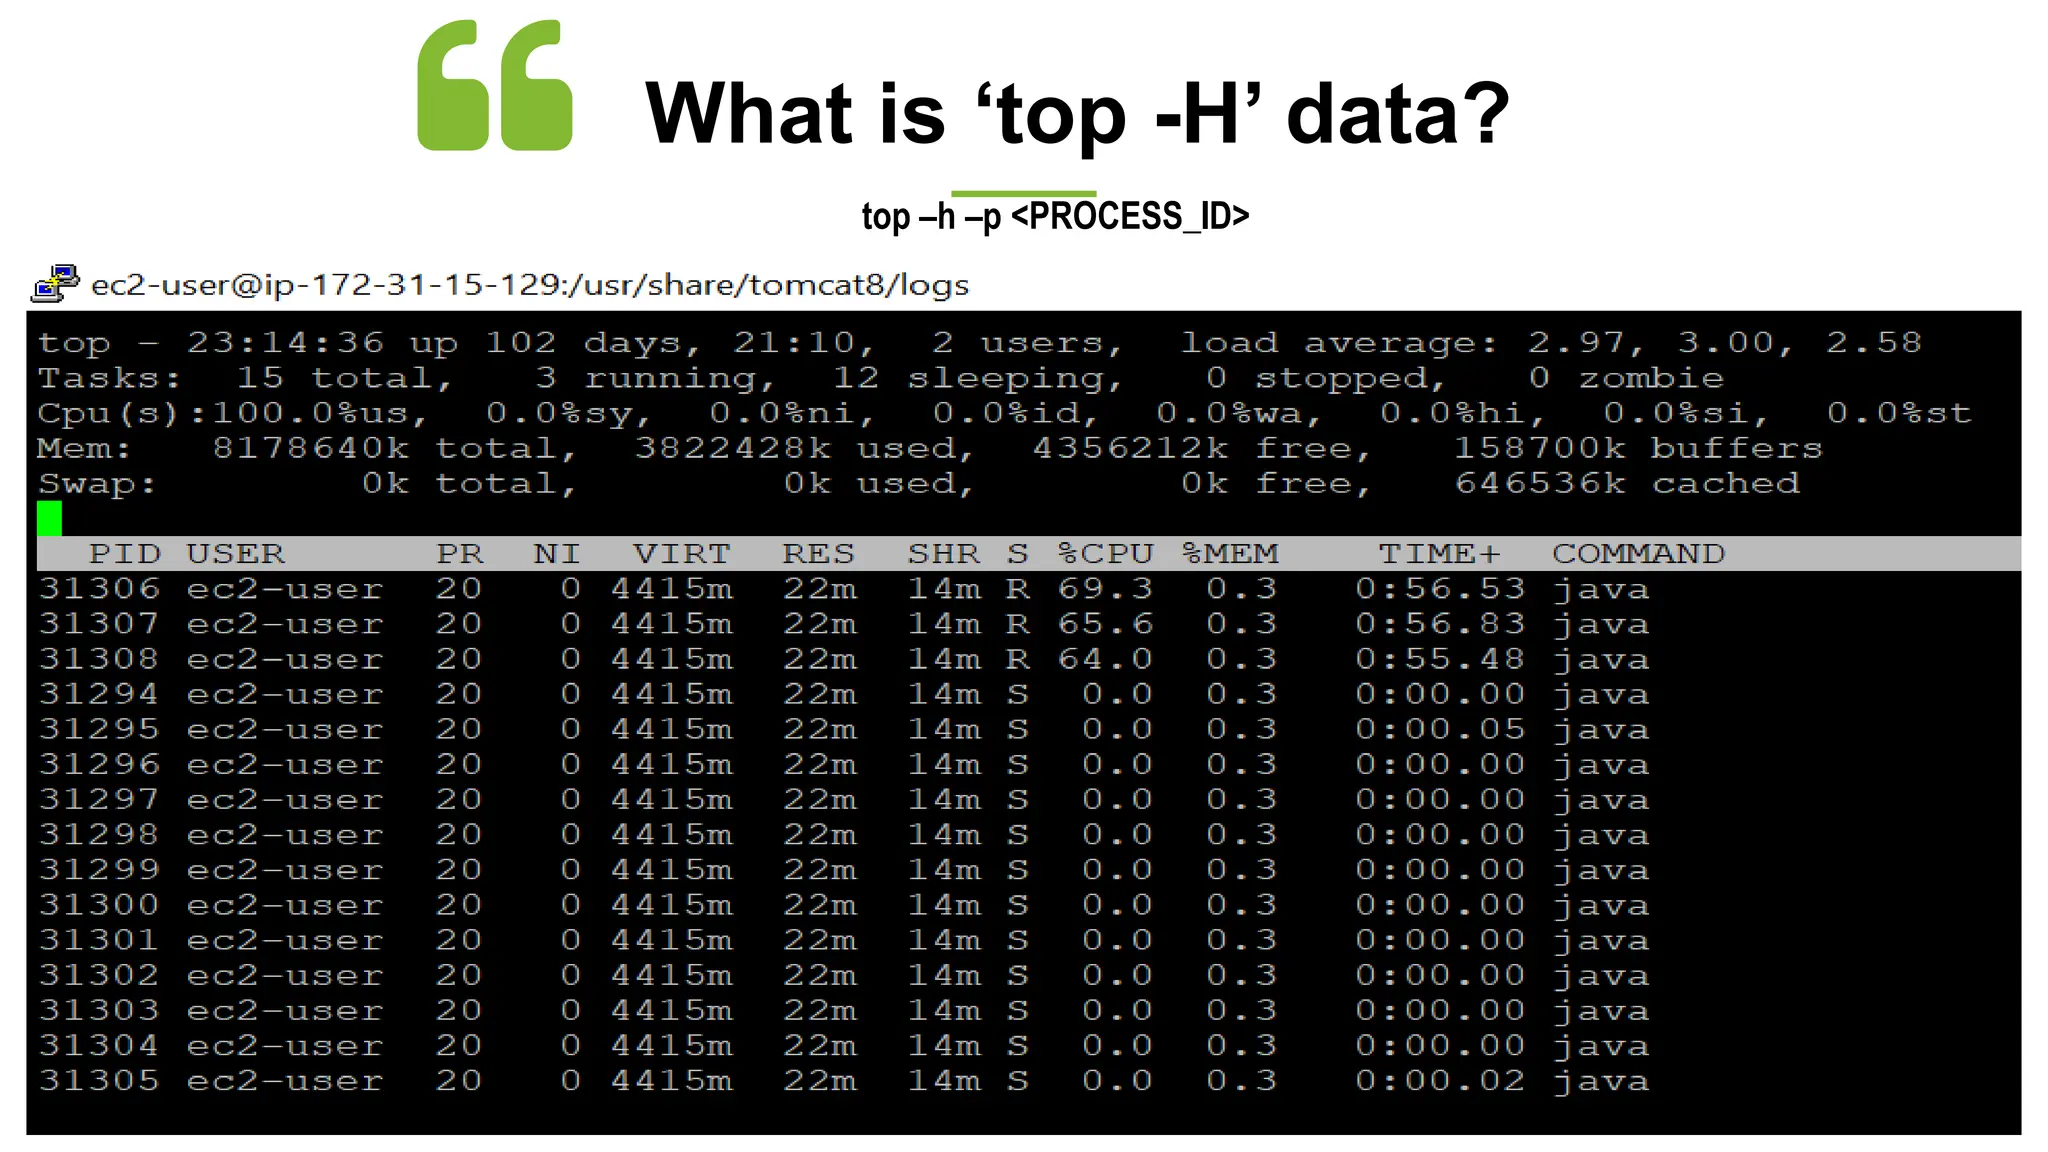
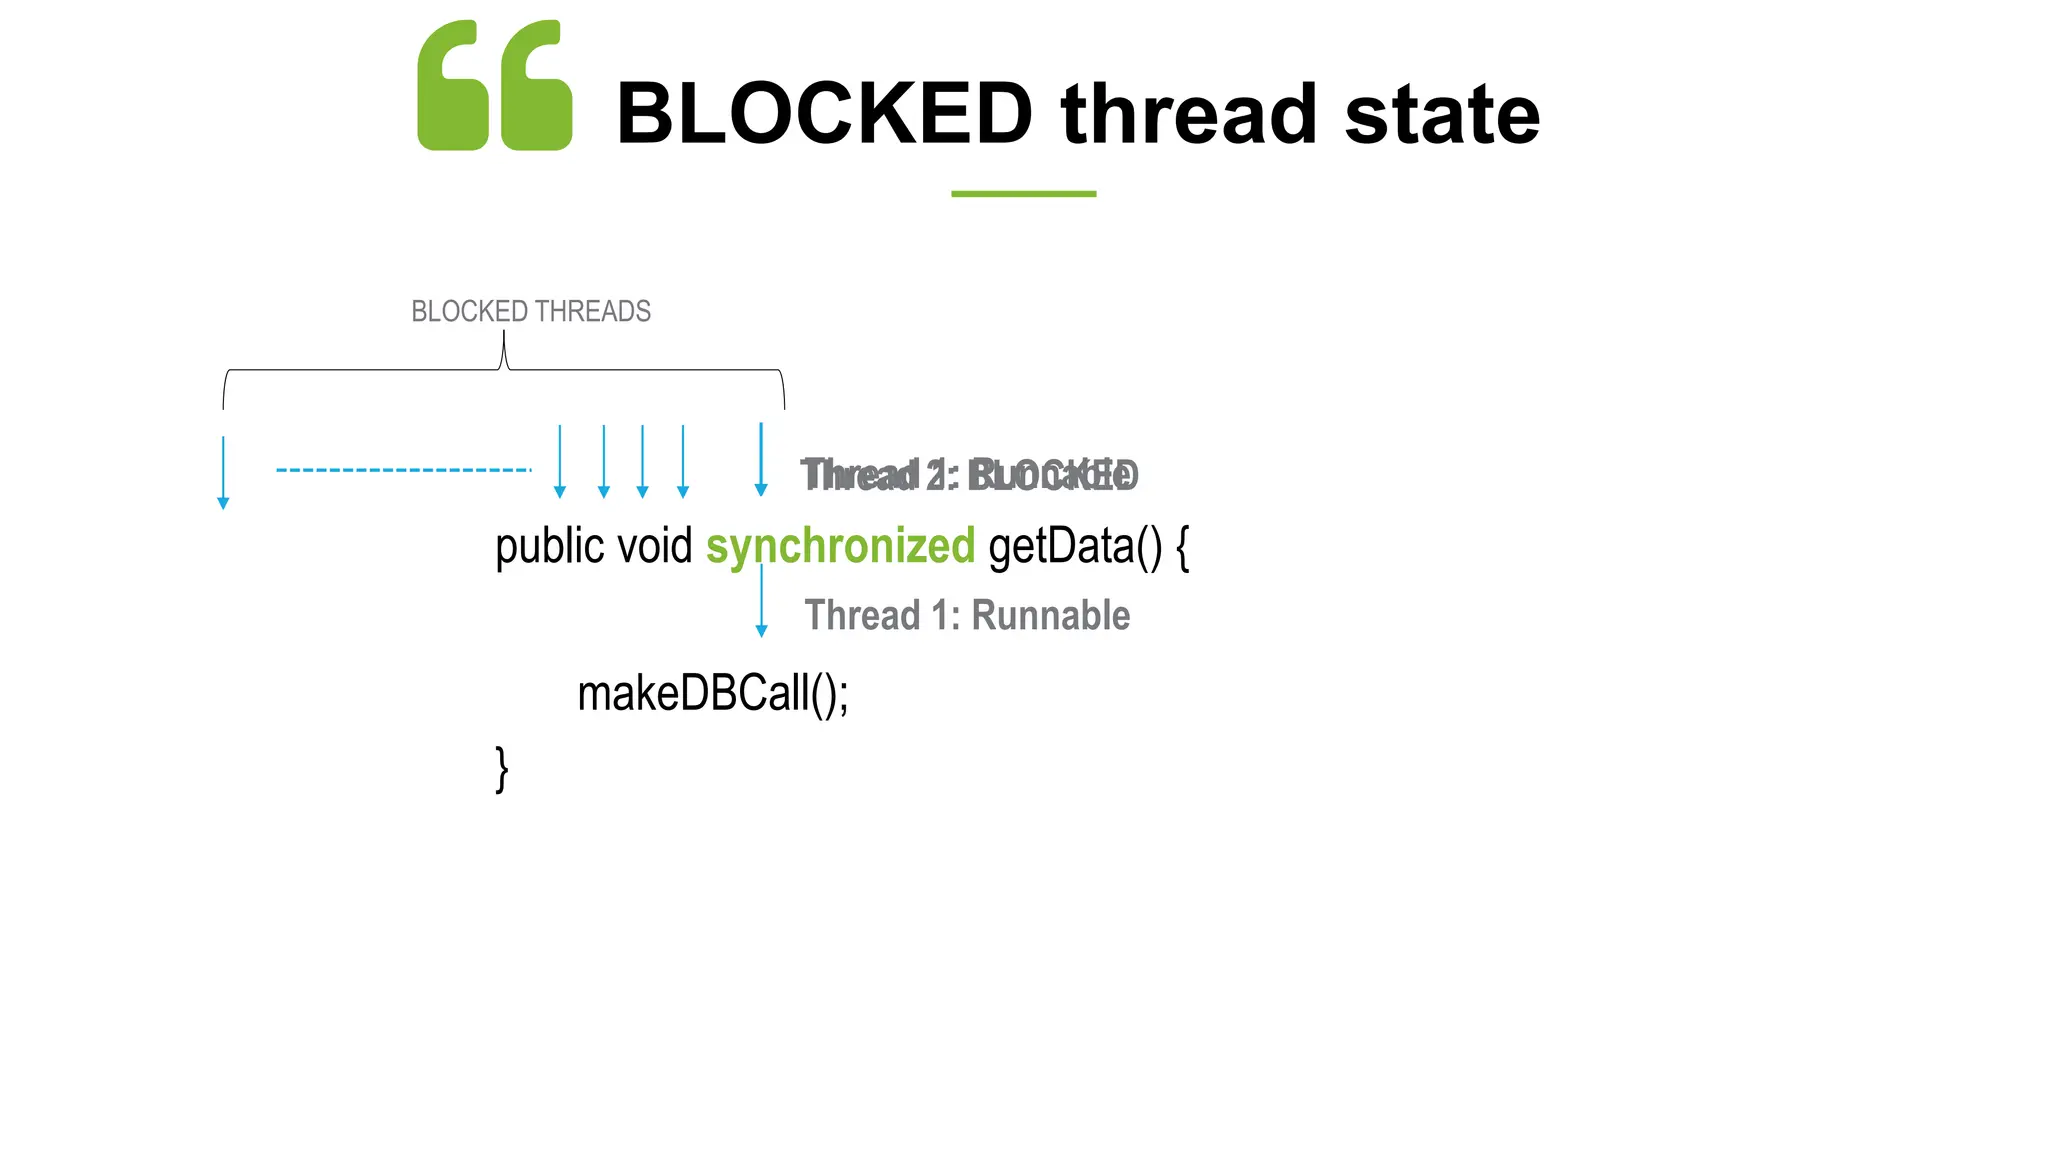
The document discusses major outages experienced by enterprises due to issues in middleware, garbage collection (GC) management, and CPU spikes, with a focus on troubleshooting steps using various diagnostic tools like GC logs and thread dumps. It highlights specific case studies from different industries, including finance and travel, and provides links to scripts and training resources for further learning. Additionally, it addresses Java thread states and patterns related to memory leaks and performance degradation.


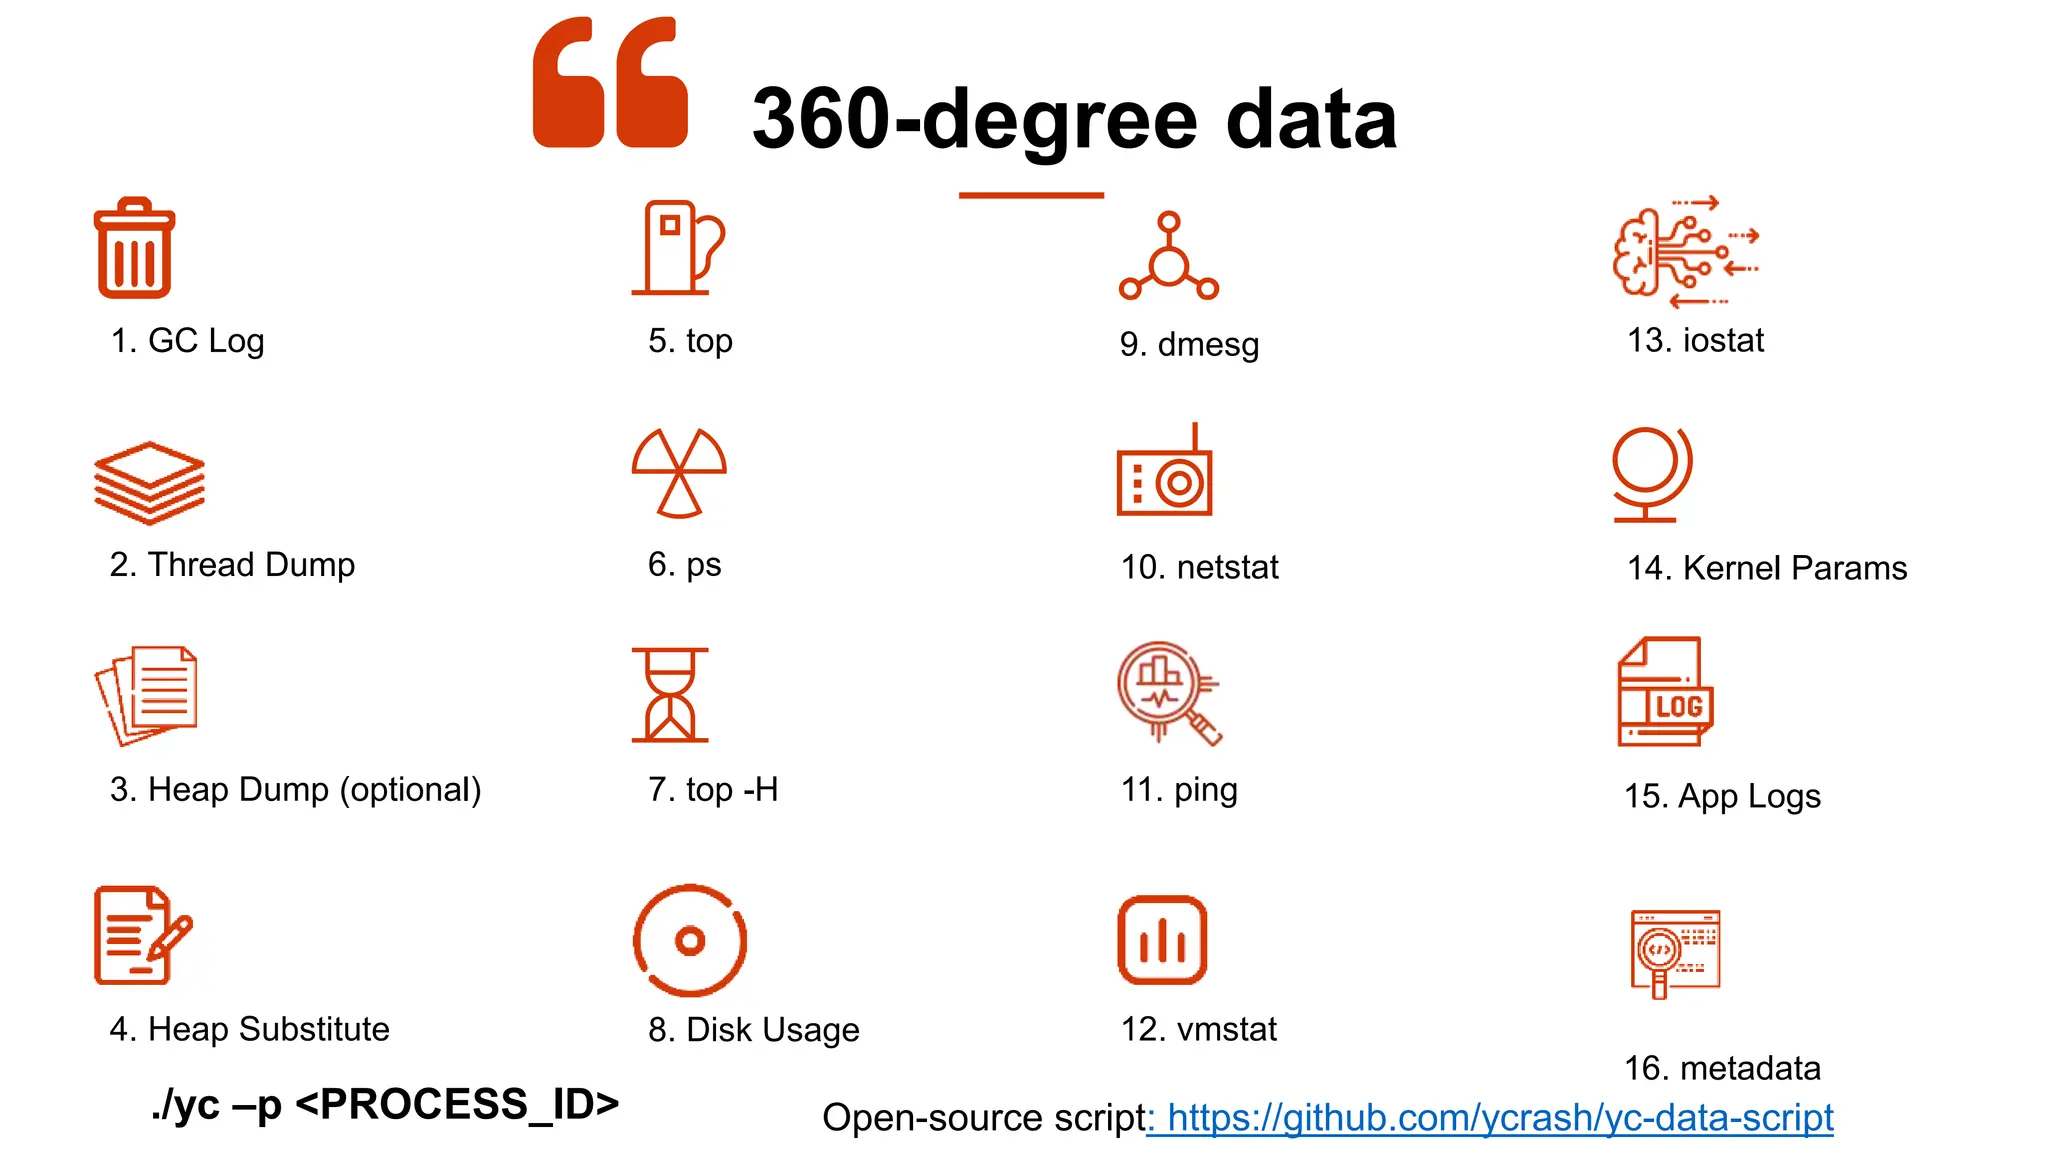
![2019-12-26 17:13:23
Full thread dump Java HotSpot(TM) 64-Bit Server VM (23.7-b01 mixed mode):
"Reconnection-1" prio=10 tid=0x00007f0442e10800 nid=0x112a waiting on condition [0x00007f042f719000]
java.lang.Thread.State: WAITING (parking)
at sun.misc.Unsafe.park(Native Method)
- parking to wait for <0x007b3953a98> (a java.util.concurrent.locks.AbstractQueuedSynchr)
at java.util.concurrent.locks.LockSupport.park(LockSupport.java:186)
at java.lang.Thread.run(Thread.java:722)
:
:
1
2
3
1 Timestamp at which thread dump was triggered
2 JVM Version info
3 Thread Details - <<details in following slides>>
Anatomy of thread dump
"InvoiceThread-A996" prio=10 tid=0x00002b7cfc6fb000 nid=0x4479 runnable [0x00002b7d17ab8000]
java.lang.Thread.State: RUNNABLE
at com.buggycompany.rt.util.ItinerarySegmentProcessor.setConnectingFlight(ItinerarySegmentProcessor.java:380)
at com.buggycompany.rt.util.ItinerarySegmentProcessor.processTripType0(ItinerarySegmentProcessor.java:366)
at com.buggycompany.rt.util.ItinerarySegmentProcessor.processItineraryByTripType(ItinerarySegmentProcessor.java:254)
at com.buggycompany.rt.util.ItinerarySegmentProcessor.templateMethod(ItinerarySegmentProcessor.java:399)
at com.buggycompany.qc.gds.InvoiceGeneratedFacade.readTicketImage(InvoiceGeneratedFacade.java:252)
at com.buggycompany.qc.gds.InvoiceGeneratedFacade.doOrchestrate(InvoiceGeneratedFacade.java:151)
at com.buggycompany.framework.gdstask.BaseGDSFacade.orchestrate(BaseGDSFacade.java:32)
at com.buggycompany.framework.gdstask.BaseGDSFacade.doWork(BaseGDSFacade.java:22)
at com.buggycompany.framework.concurrent.BuggycompanyCallable.call(buggycompanyCallable.java:80)
at java.util.concurrent.FutureTask$Sync.innerRun(FutureTask.java:334)
at java.util.concurrent.FutureTask.run(FutureTask.java:166)
at java.util.concurrent.ThreadPoolExecutor.runWorker(ThreadPoolExecutor.java:1145)
at java.util.concurrent.ThreadPoolExecutor$Worker.run(ThreadPoolExecutor.java:615)
at java.lang.Thread.run(Thread.java:722)](https://image.slidesharecdn.com/major-outages-pykara-2024-240701122005-68a00f9a/75/Major-Outages-in-Major-Enterprises-Payara-Conference-4-2048.jpg)
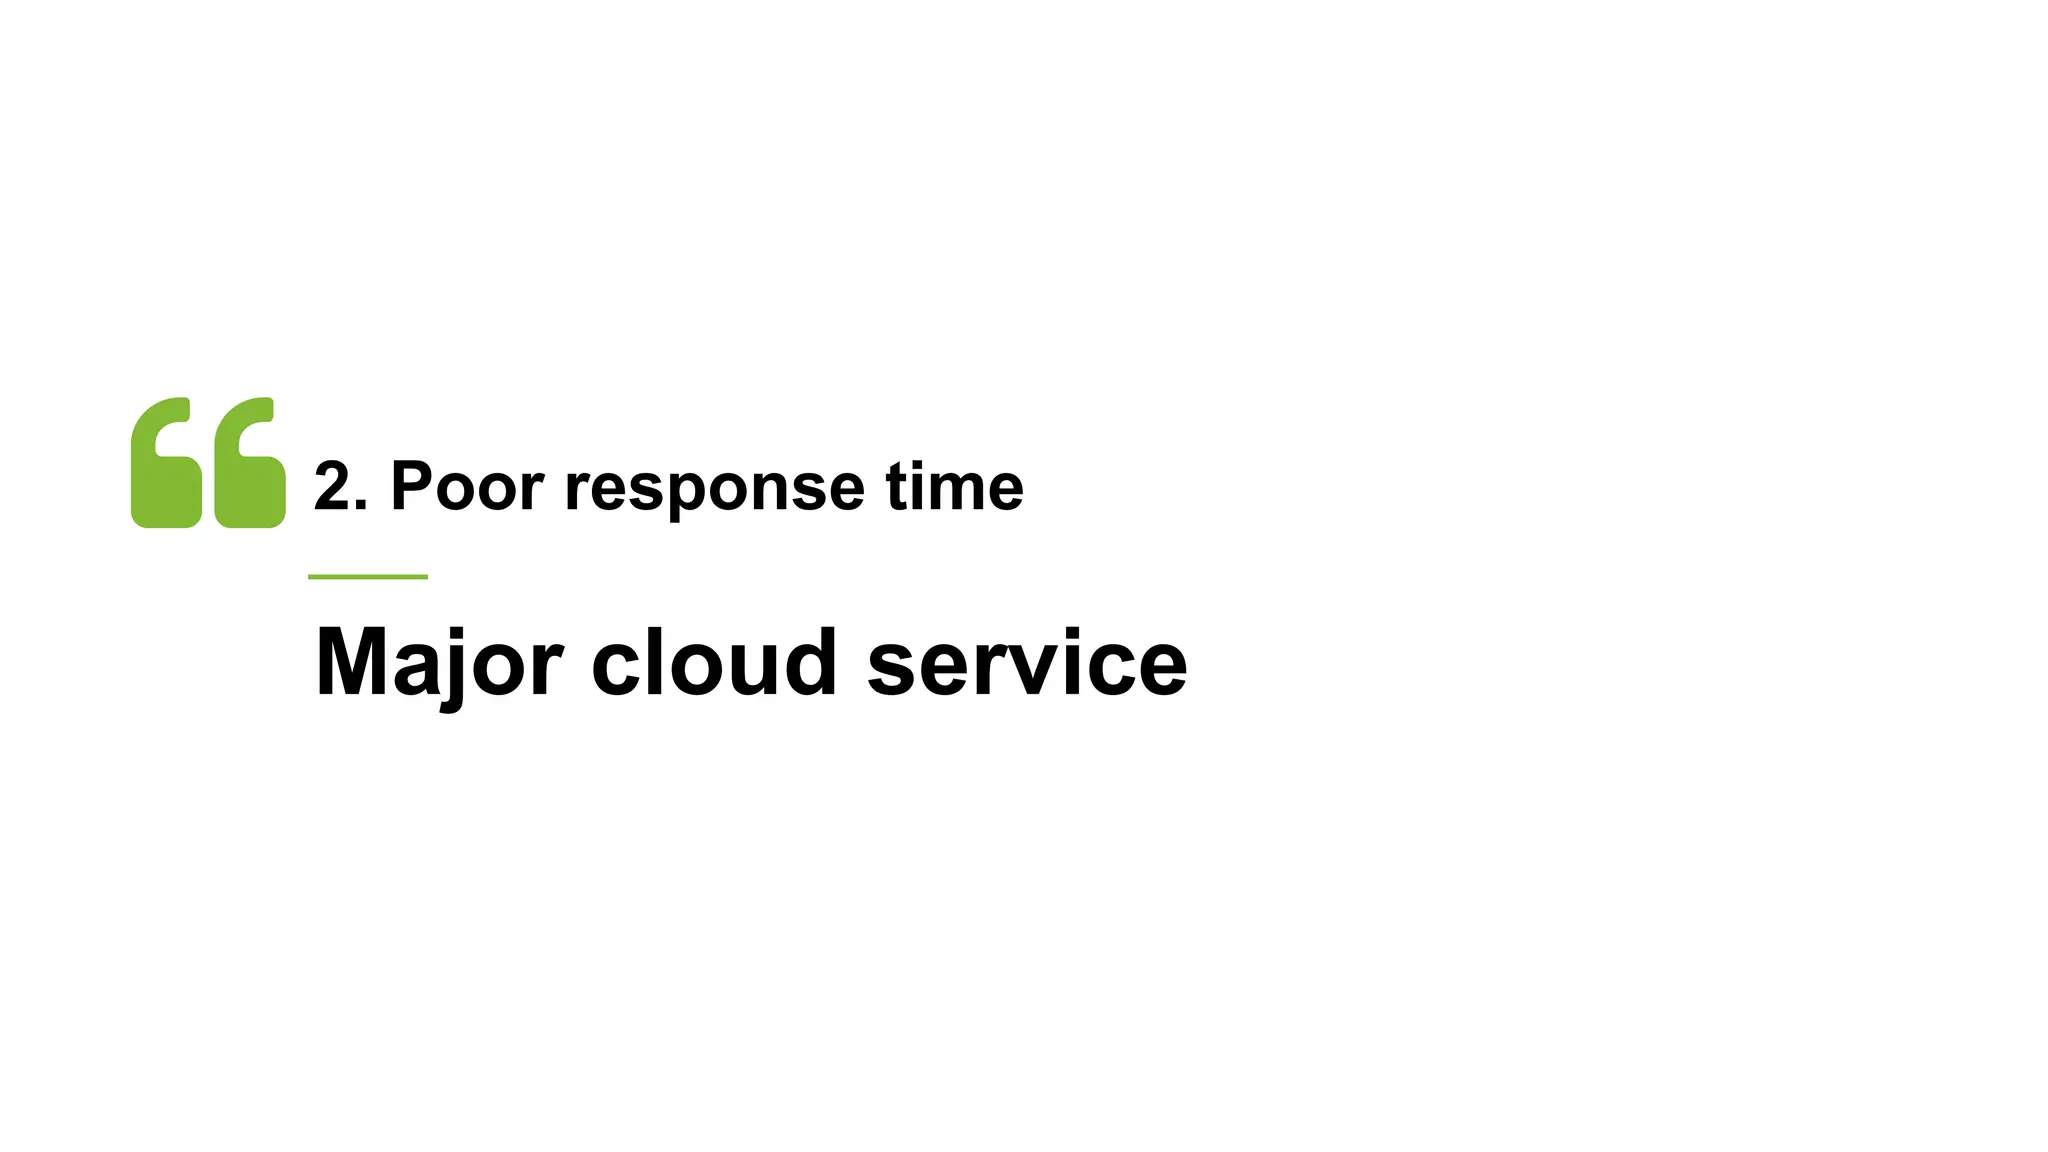
!["InvoiceThread-A996" prio=10 tid=0x00002b7cfc6fb000 nid=0x4479 runnable [0x00002b7d17ab8000]
java.lang.Thread.State: RUNNABLE
at com.buggycompany.rt.util.ItinerarySegmentProcessor.setConnectingFlight(ItinerarySegmentProcessor.java:380)
at com.buggycompany.rt.util.ItinerarySegmentProcessor.processTripType0(ItinerarySegmentProcessor.java:366)
at com.buggycompany.rt.util.ItinerarySegmentProcessor.processItineraryByTripType(ItinerarySegmentProcessor.java:254)
at com.buggycompany.rt.util.ItinerarySegmentProcessor.templateMethod(ItinerarySegmentProcessor.java:399)
at com.buggycompany.qc.gds.InvoiceGeneratedFacade.readTicketImage(InvoiceGeneratedFacade.java:252)
at com.buggycompany.qc.gds.InvoiceGeneratedFacade.doOrchestrate(InvoiceGeneratedFacade.java:151)
at com.buggycompany.framework.gdstask.BaseGDSFacade.orchestrate(BaseGDSFacade.java:32)
at com.buggycompany.framework.gdstask.BaseGDSFacade.doWork(BaseGDSFacade.java:22)
at com.buggycompany.framework.concurrent.BuggycompanyCallable.call(buggycompanyCallable.java:80)
at java.util.concurrent.FutureTask$Sync.innerRun(FutureTask.java:334)
at java.util.concurrent.FutureTask.run(FutureTask.java:166)
at java.util.concurrent.ThreadPoolExecutor.runWorker(ThreadPoolExecutor.java:1145)
at java.util.concurrent.ThreadPoolExecutor$Worker.run(ThreadPoolExecutor.java:615)
at java.lang.Thread.run(Thread.java:722)
1 2 3 4 5
6
7
1 Thread Name - InvoiceThread-A996
2 Priority - Can have values from 1 to 10
3
Thread Id - 0x00002b7cfc6fb000 – Unique ID assigned by JVM. It's returned by calling the Thread.getId() method.
4 Native Id - 0x4479 - This ID is highly platform dependent. On Linux, it's the pid of the thread. On Windows, it's simply the OS-level thread ID within
a process. On Mac OS X, it is said to be the native pthread_t value.
5 Address space - 0x00002b7d17ab8000 -
6 Thread State - RUNNABLE
7 Stack trace -](https://image.slidesharecdn.com/major-outages-pykara-2024-240701122005-68a00f9a/75/Major-Outages-in-Major-Enterprises-Payara-Conference-5-2048.jpg)

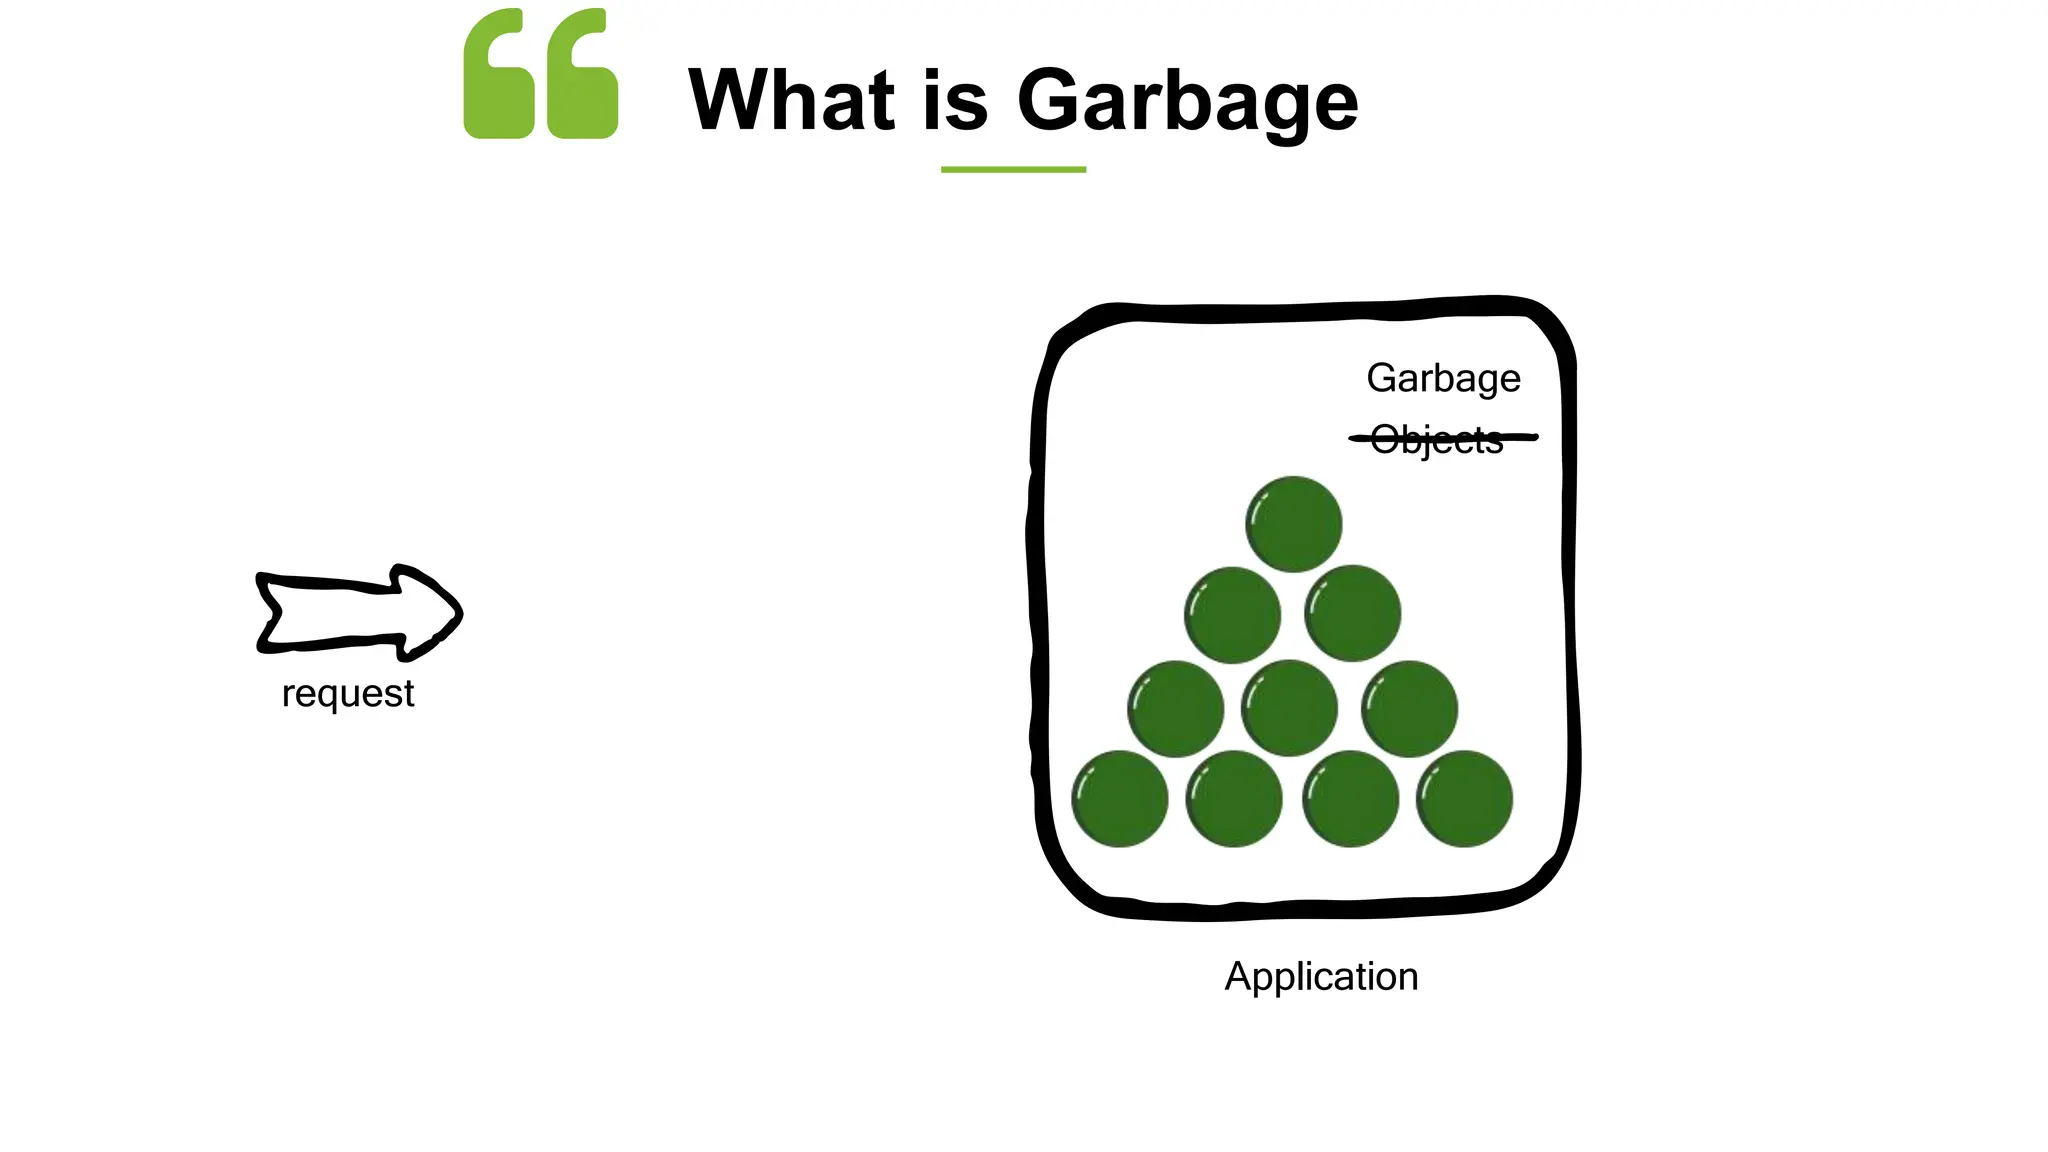
![2019-08-31T01:09:19.397+0000: 1.606: [GC (Metadata GC Threshold) [PSYoungGen: 545393K->18495K(2446848K)] 545393K-
>18519K(8039424K), 0.0189376 secs] [Times: user=0.15 sys=0.01, real=0.02 secs]
2019-08-31T01:09:19.416+0000: 1.625: [Full GC (Metadata GC Threshold) [PSYoungGen: 18495K->0K(2446848K)] [ParOldGen: 24K-
>17366K(5592576K)] 18519K->17366K(8039424K), [Metaspace: 20781K->20781K(1067008K)], 0.0416162 secs] [Times: user=0.38
sys=0.03, real=0.04 secs]
2019-08-31T01:18:19.288+0000: 541.497: [GC (Metadata GC Threshold) [PSYoungGen: 1391495K->18847K(2446848K)] 1408861K-
>36230K(8039424K), 0.0568365 secs] [Times: user=0.31 sys=0.75, real=0.06 secs]
2019-08-31T01:18:19.345+0000: 541.554: [Full GC (Metadata GC Threshold) [PSYoungGen: 18847K->0K(2446848K)] [ParOldGen:
17382K->25397K(5592576K)] 36230K->25397K(8039424K), [Metaspace: 34865K->34865K(1079296K)], 0.0467640 secs] [Times:
user=0.31 sys=0.08, real=0.04 secs]
2019-08-31T02:33:20.326+0000: 5042.536: [GC (Allocation Failure) [PSYoungGen: 2097664K->11337K(2446848K)] 2123061K-
>36742K(8039424K), 0.3298985 secs] [Times: user=0.00 sys=9.20, real=0.33 secs]
2019-08-31T03:40:11.749+0000: 9053.959: [GC (Allocation Failure) [PSYoungGen: 2109001K->15776K(2446848K)] 2134406K-
>41189K(8039424K), 0.0517517 secs] [Times: user=0.00 sys=1.22, real=0.05 secs]
2019-08-31T05:11:46.869+0000: 14549.079: [GC (Allocation Failure) [PSYoungGen: 2113440K->24832K(2446848K)] 2138853K-
>50253K(8039424K), 0.0392831 secs] [Times: user=0.02 sys=0.79, real=0.04 secs]
2019-08-31T06:26:10.376+0000: 19012.586: [GC (Allocation Failure) [PSYoungGen: 2122496K->25600K(2756096K)] 2147917K-
>58149K(8348672K), 0.0371416 secs] [Times: user=0.01 sys=0.75, real=0.04 secs]
2019-08-31T07:50:03.442+0000: 24045.652: [GC (Allocation Failure) [PSYoungGen: 2756096K->32768K(2763264K)] 2788645K-
>72397K(8355840K), 0.0709641 secs] [Times: user=0.16 sys=1.39, real=0.07 secs]
2019-08-31T09:04:21.406+0000: 28503.616: [GC (Allocation Failure) [PSYoungGen: 2763264K->32768K(2733568K)] 2802893K-
>83469K(8326144K), 0.0789178 secs] [Times: user=0.12 sys=1.59, real=0.08 secs]
Sample GC log](https://image.slidesharecdn.com/major-outages-pykara-2024-240701122005-68a00f9a/75/Major-Outages-in-Major-Enterprises-Payara-Conference-11-2048.jpg)