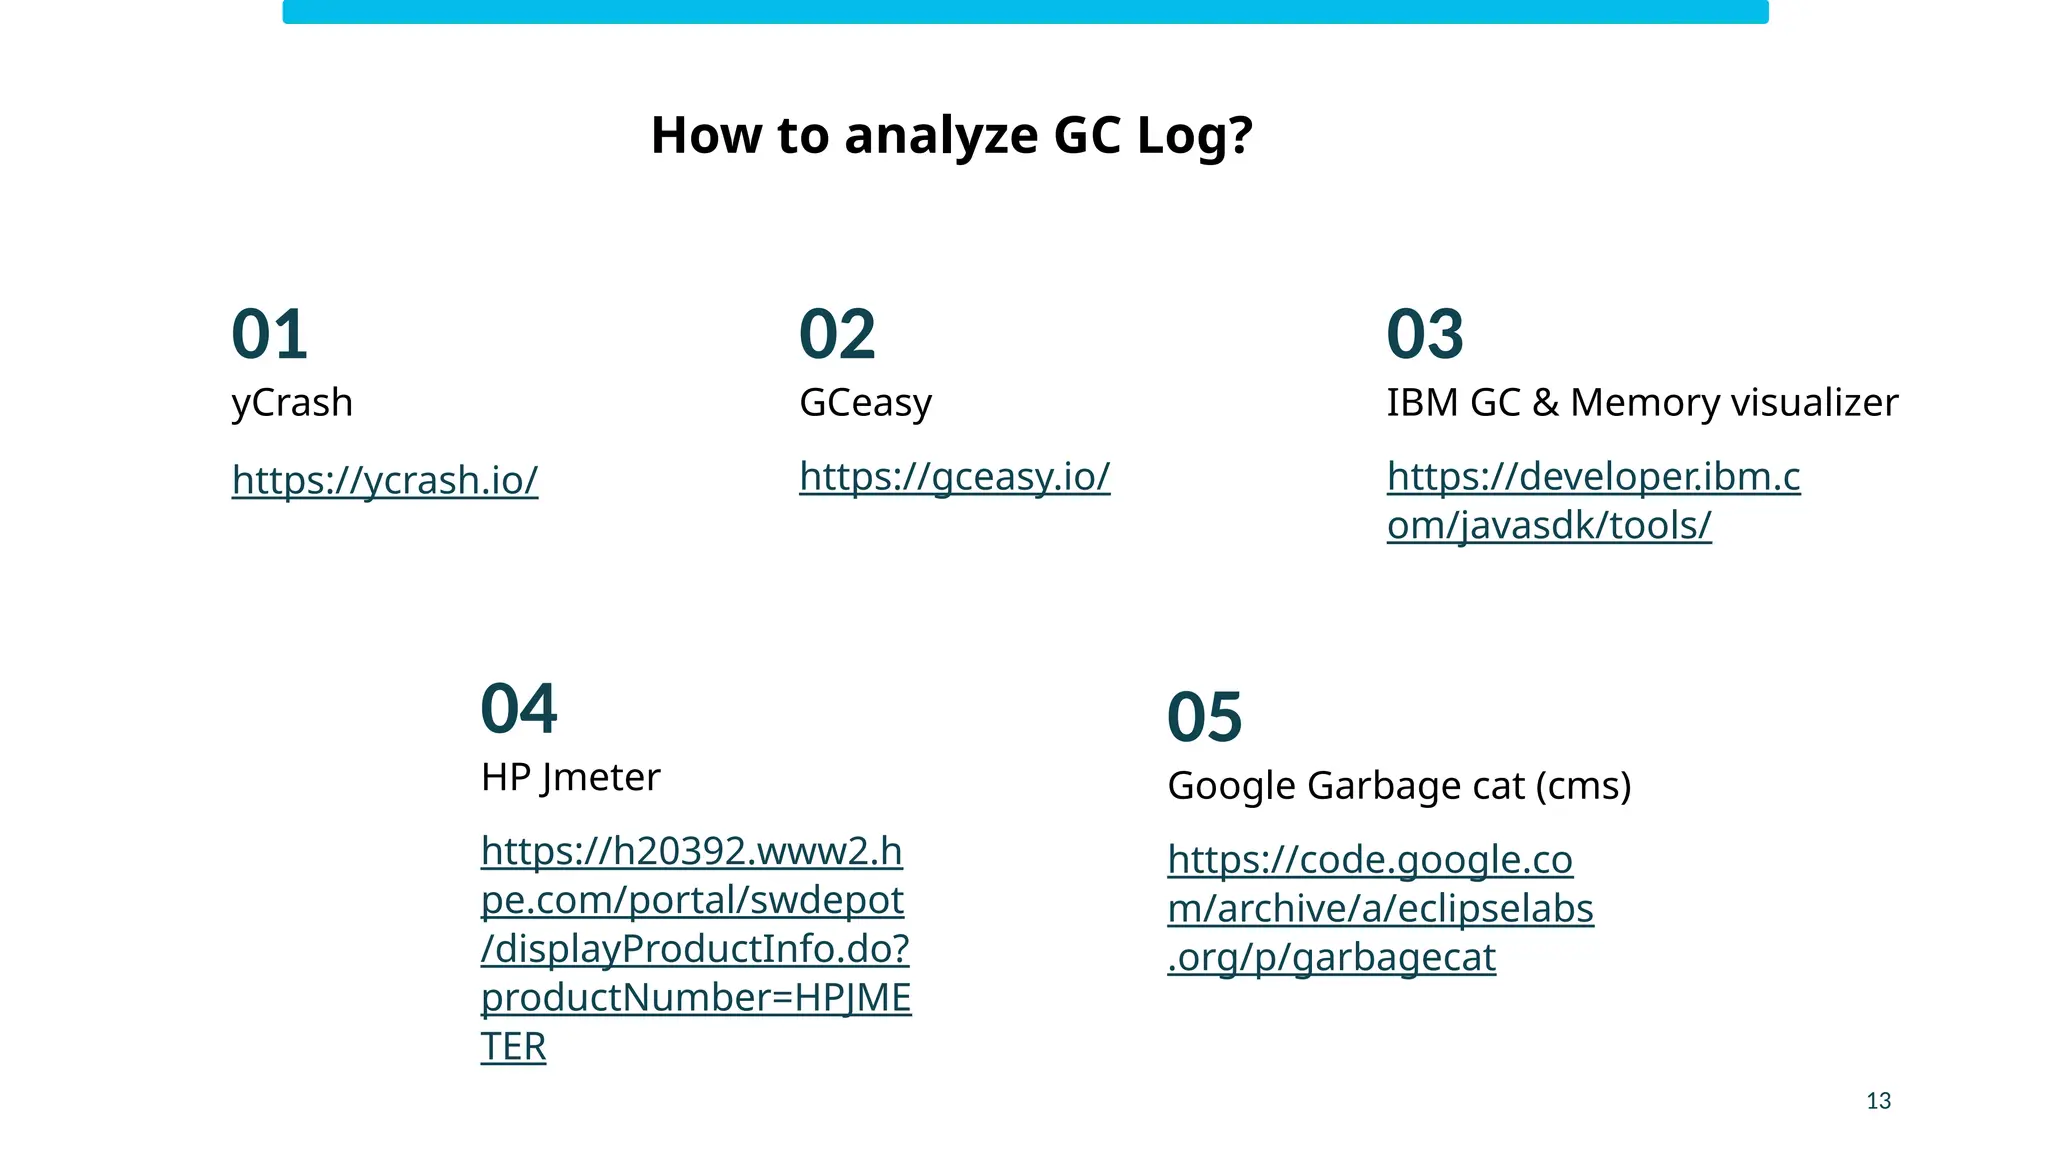
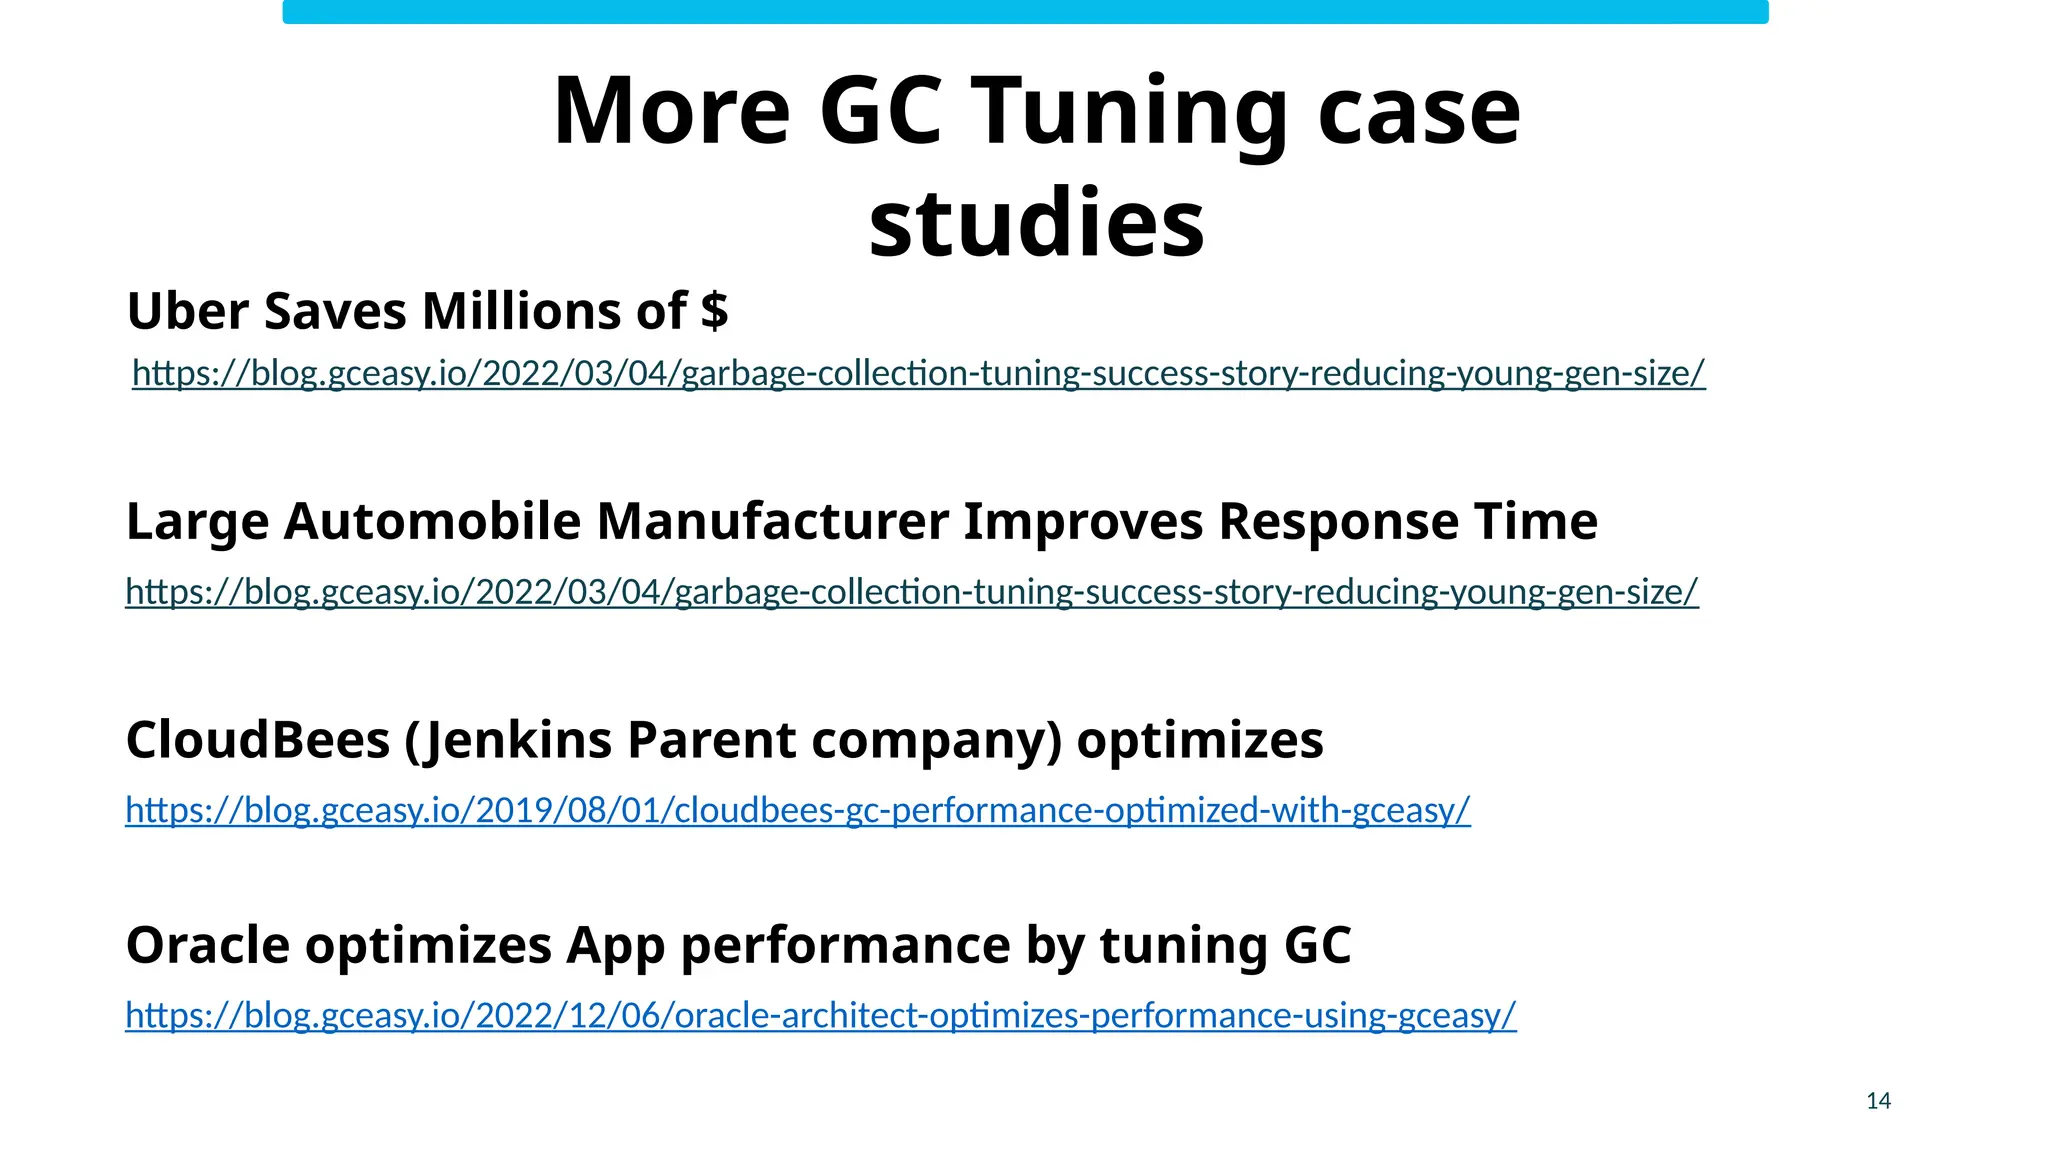
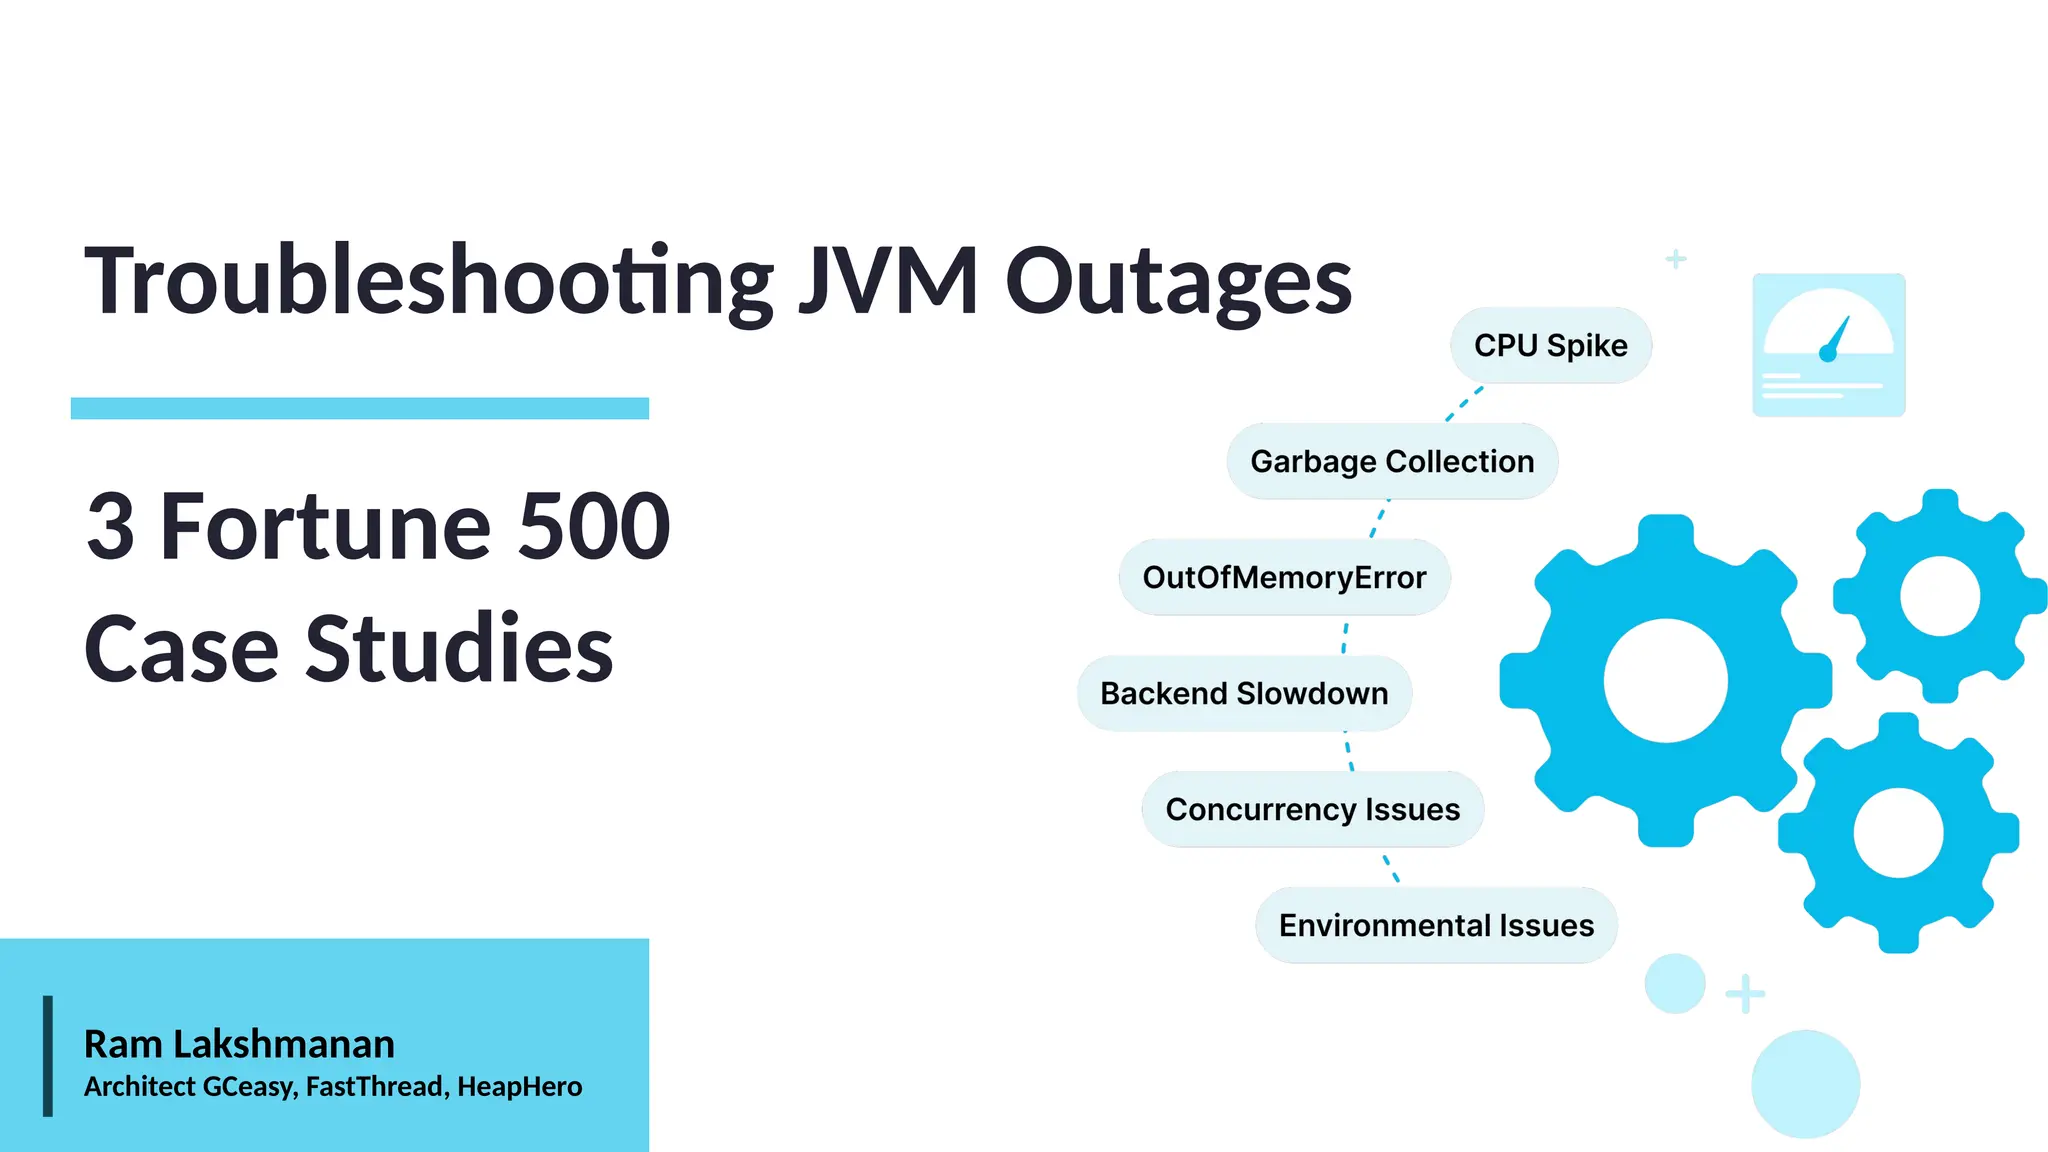
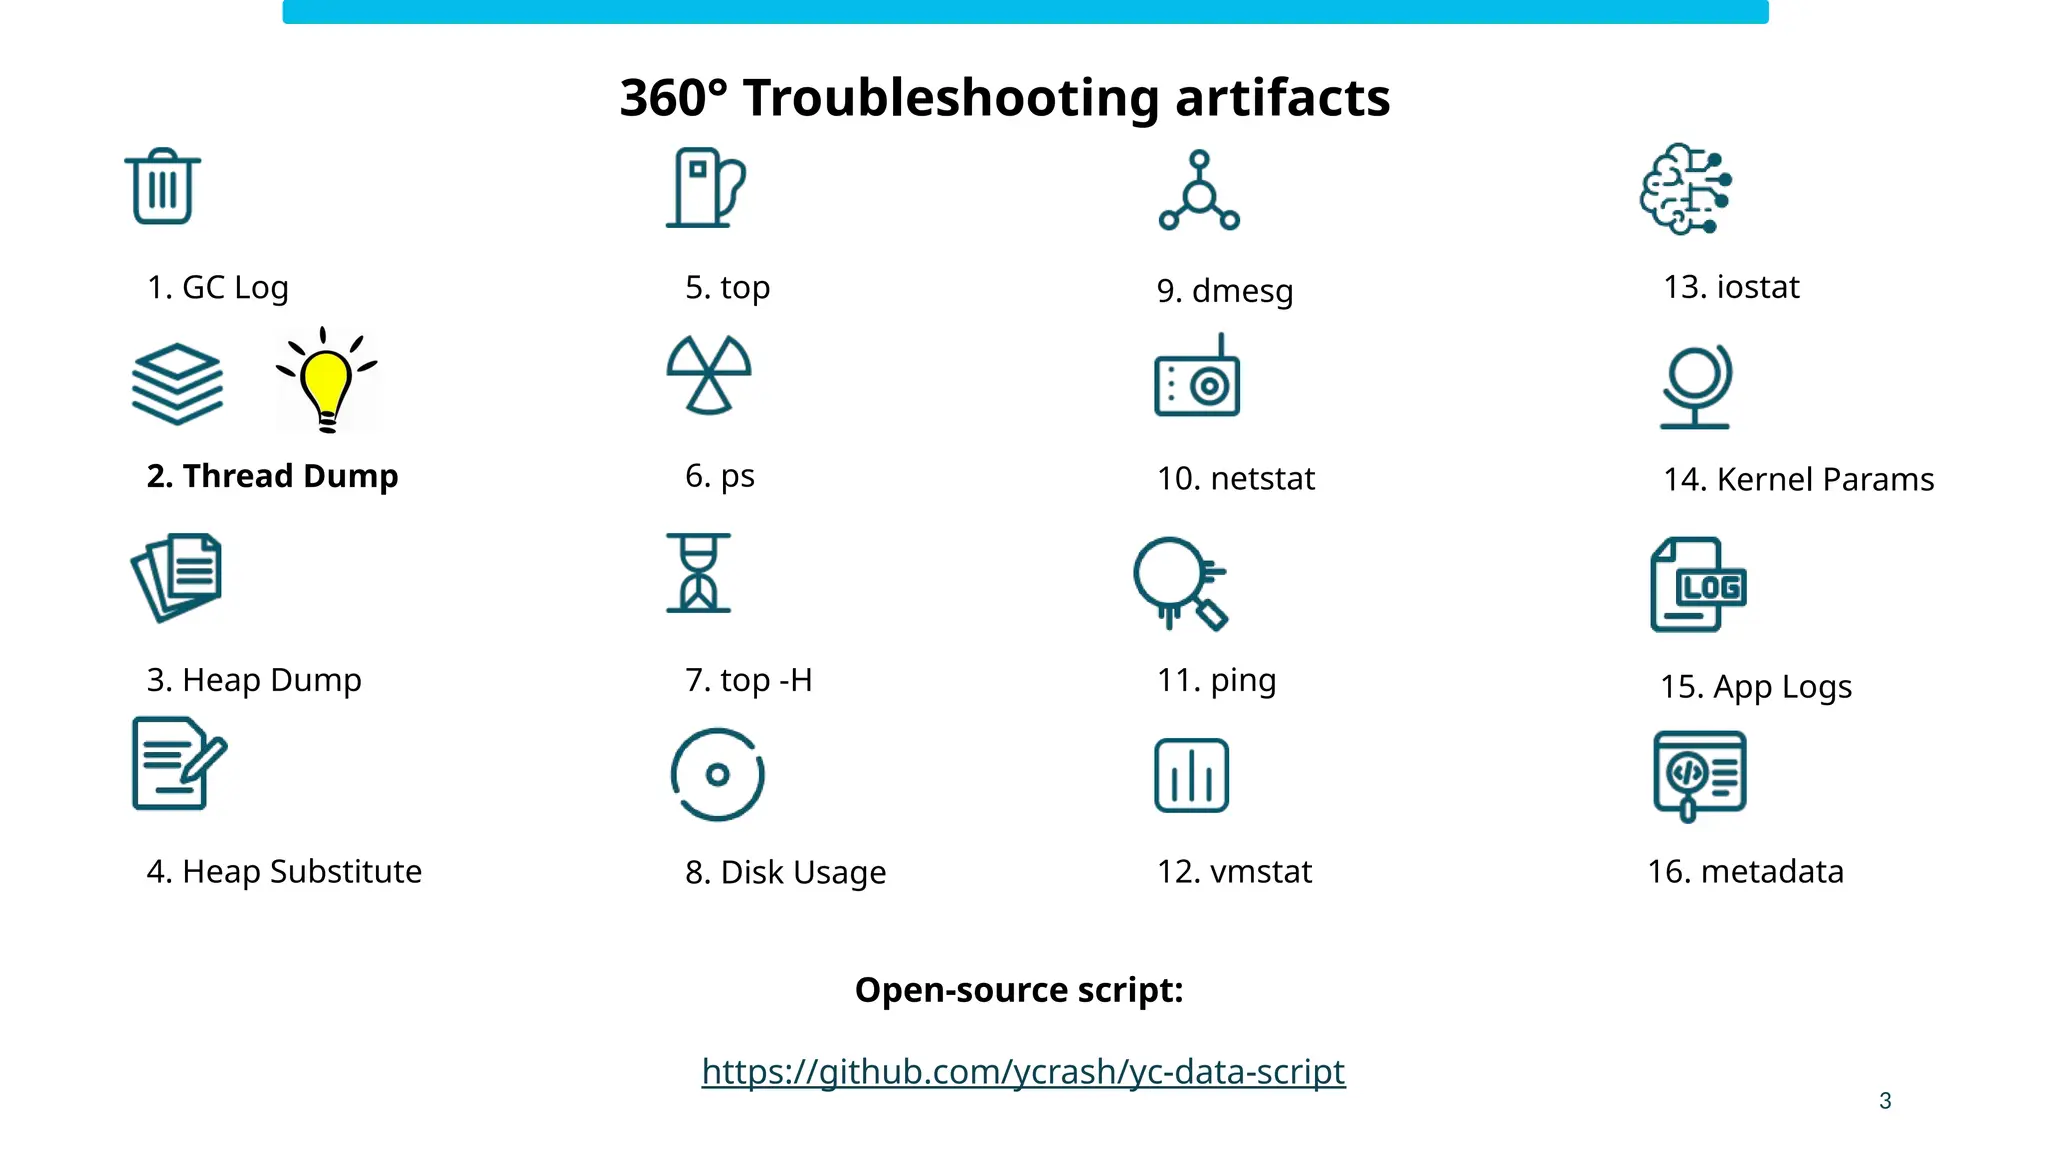
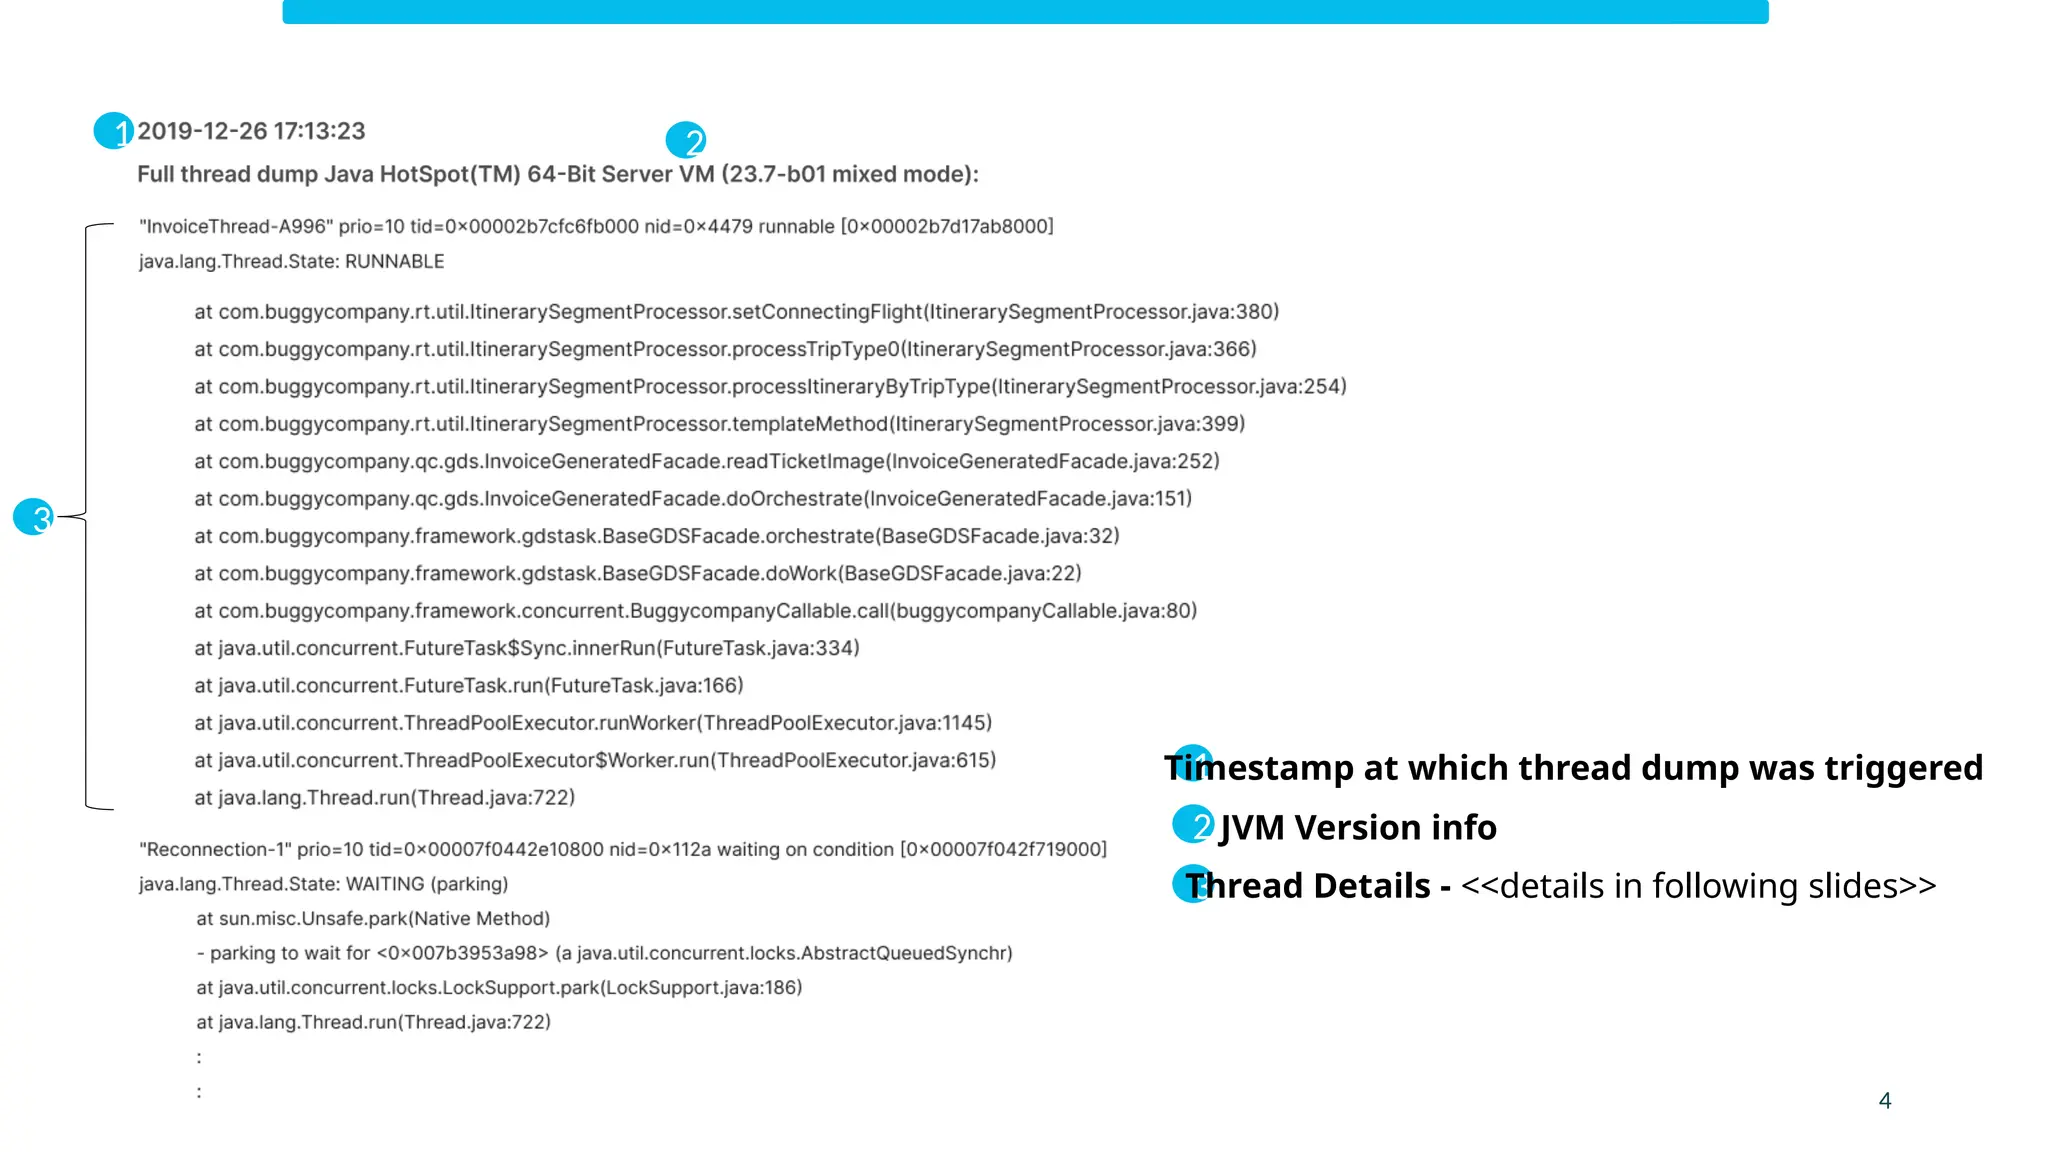
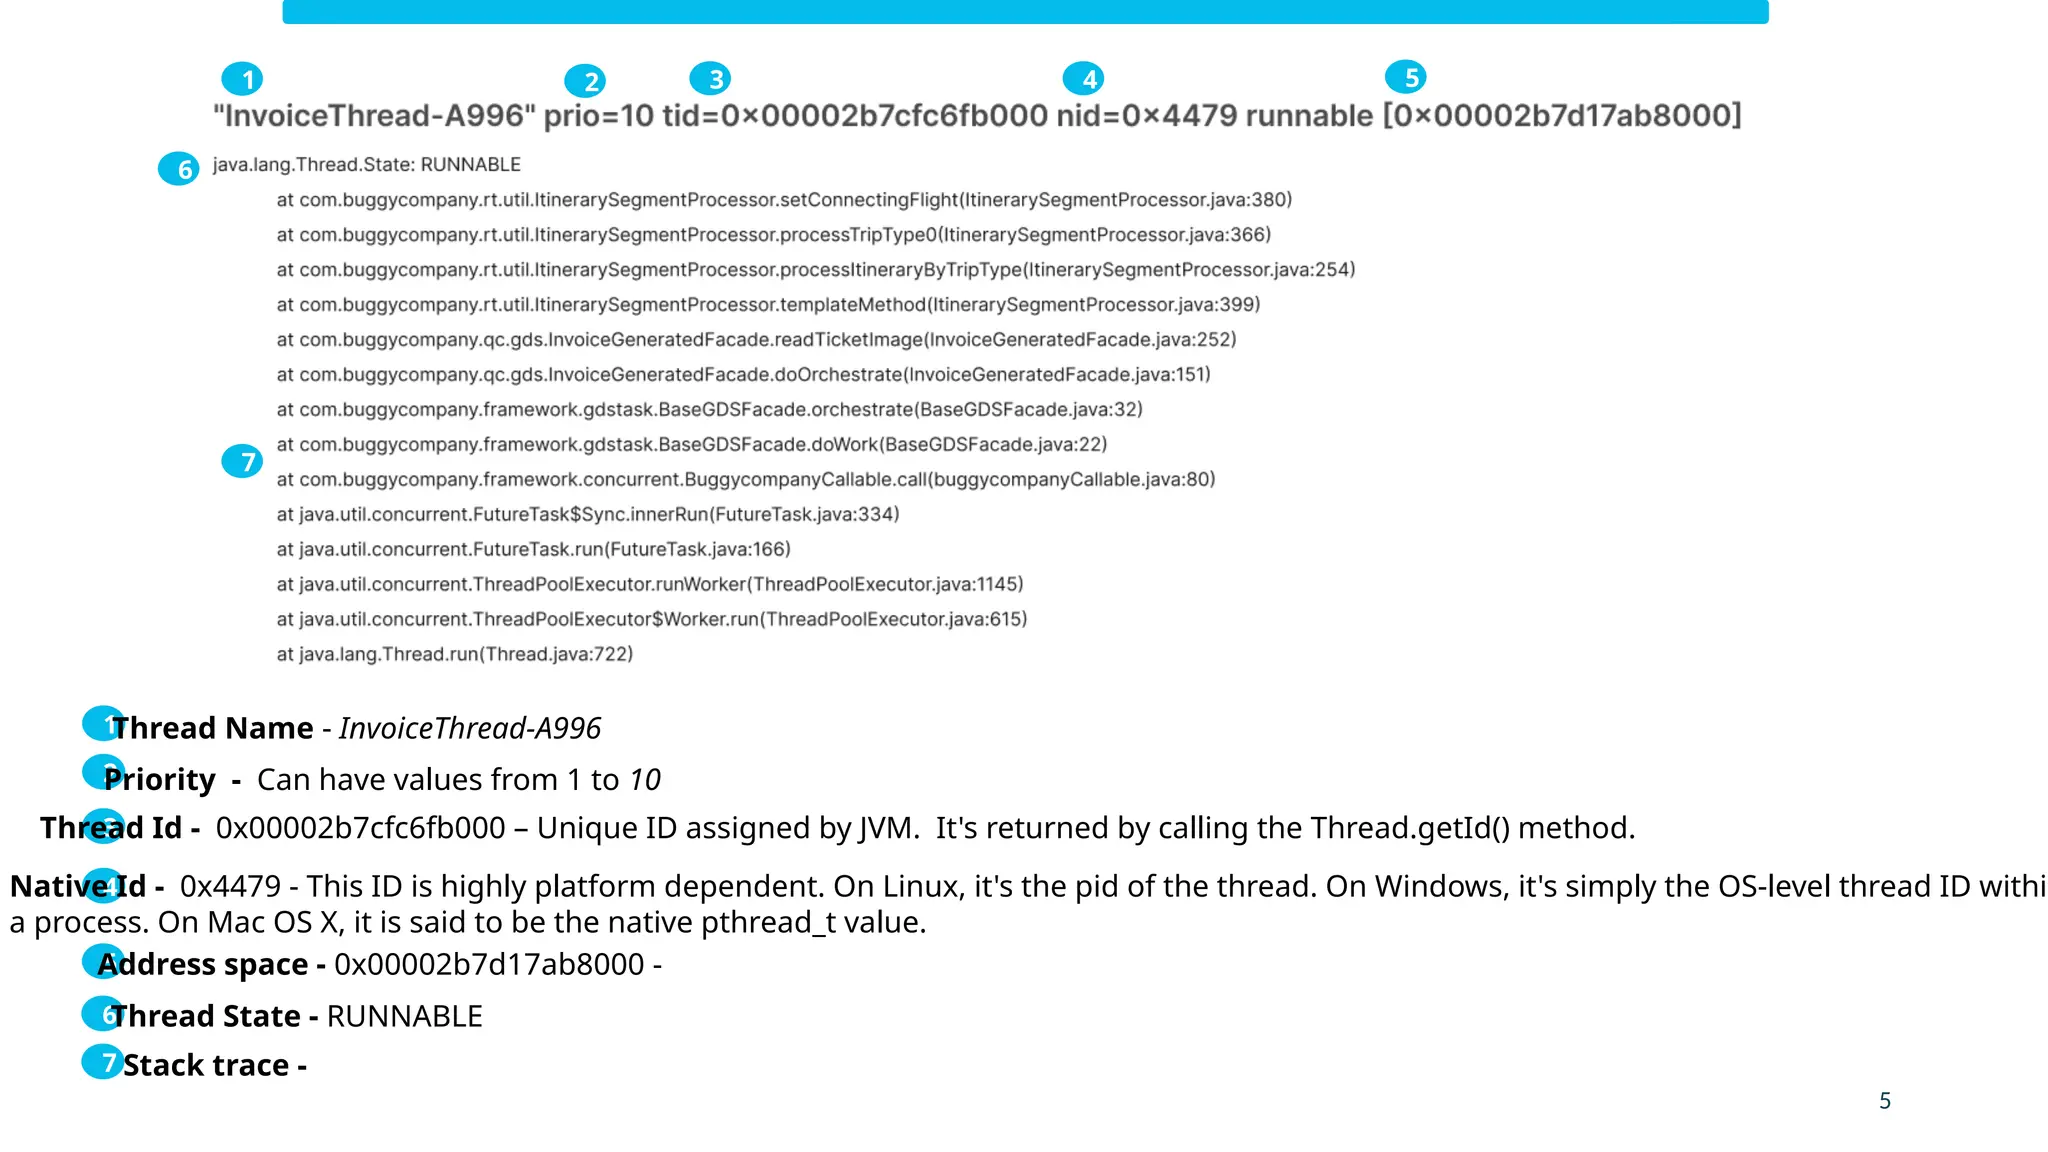
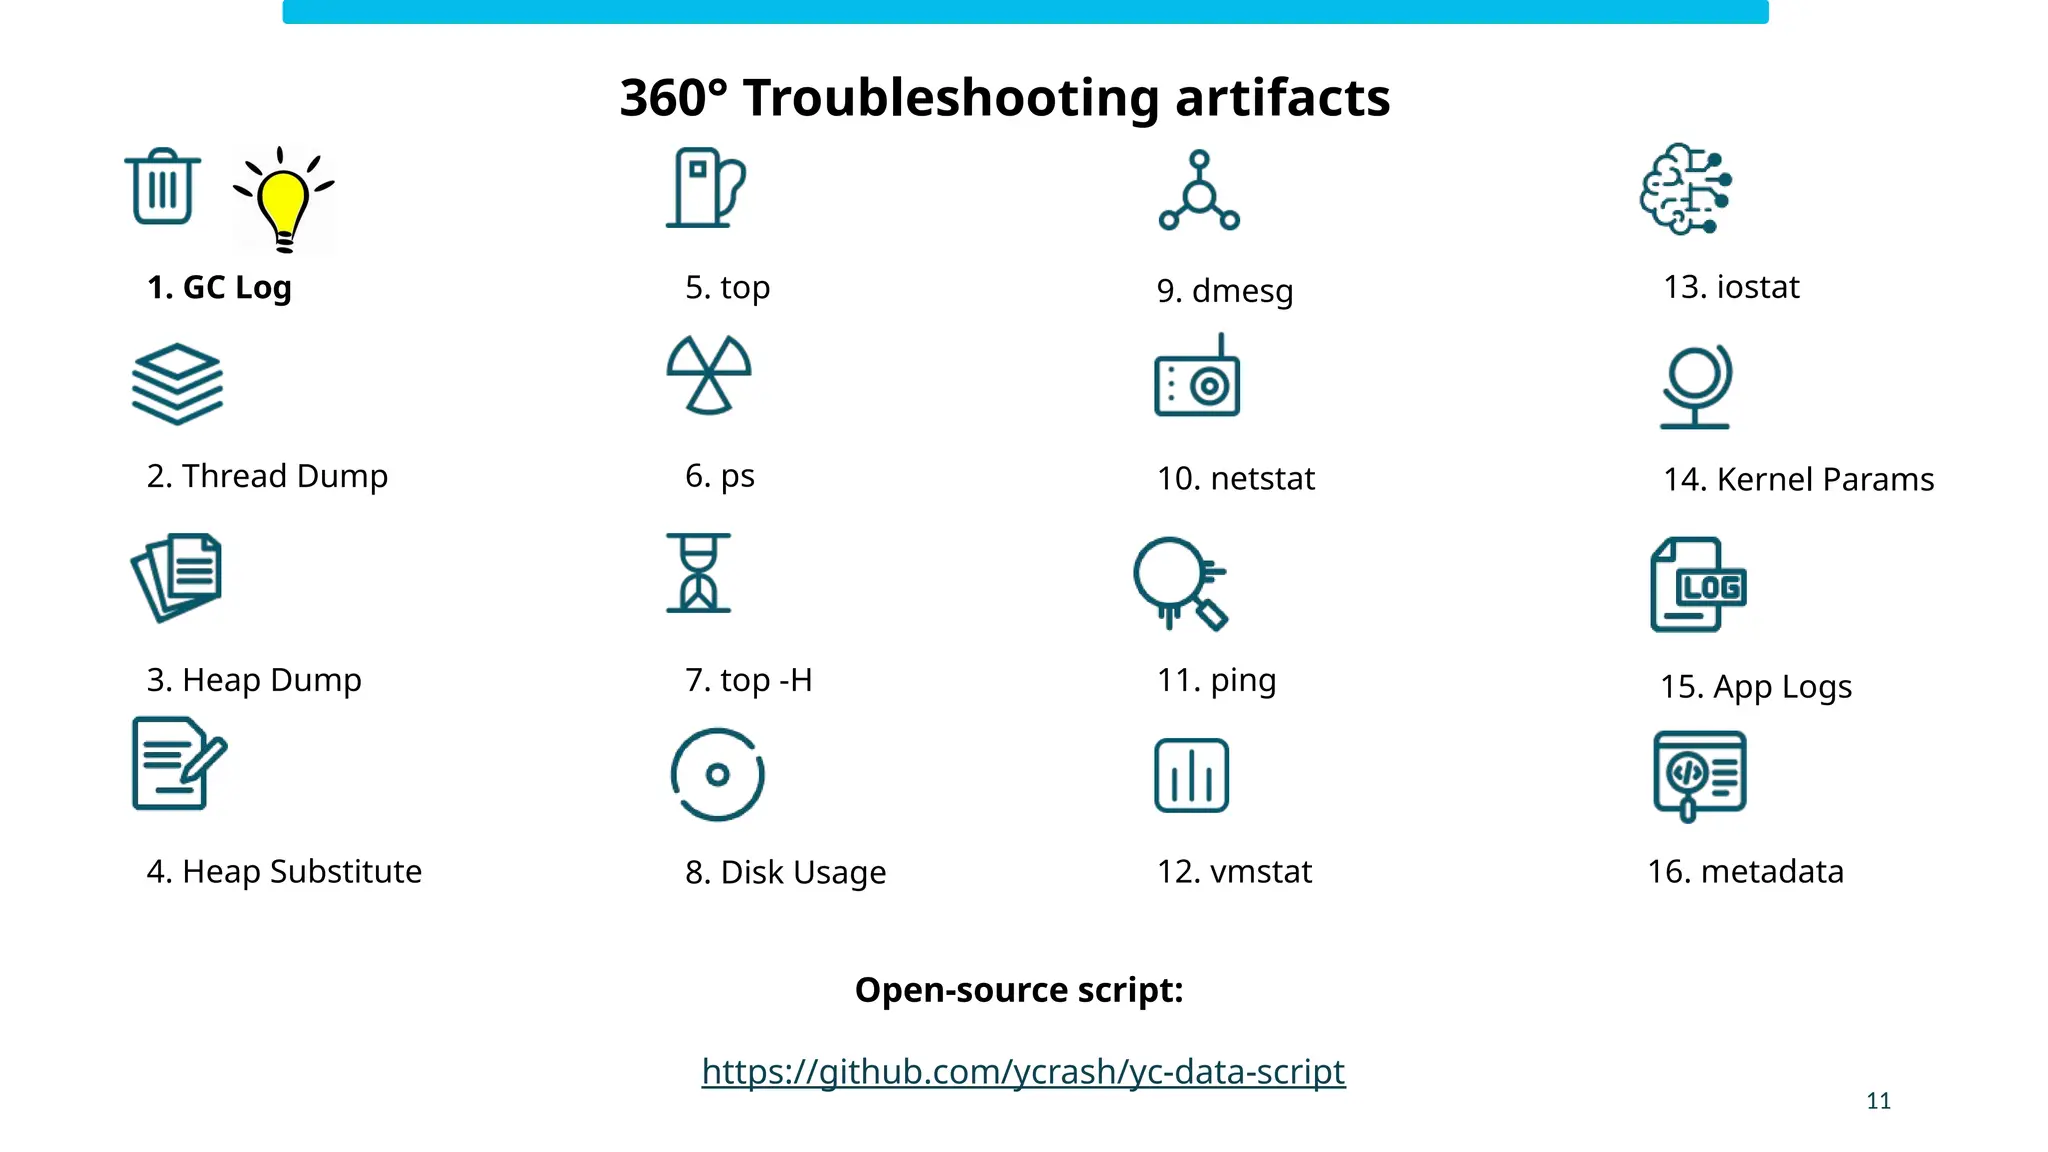
Troubleshooting JVM Outages
3 Fortune 500
Case Studies
Ram Lakshmanan
Architect GCeasy, FastThread, HeapHero
2
Slowdown
Major Financial Institution in N. America
Analysis Report: https://tinyurl.com/5da3ft8z
Open-source script:
https://github.com/ycrash/yc-data-script
1. GC Log
10. netstat
12. vmstat
2. Thread Dump
9. dmesg
3. Heap Dump
6. ps
8. Disk Usage
5. top 13. iostat
11. ping
14. Kernel Params
15. App Logs
16. metadata
4. Heap Substitute
7. top -H
3
360° Troubleshooting artifacts
1 2
3
1
Timestamp at which thread dump was triggered
2 JVM Version info
3
Thread Details - <<details in following slides>>
4
1 2 3 4 5
6
7
1
Thread Name - InvoiceThread-A996
2
Priority - Can have values from 1 to 10
3
Thread Id - 0x00002b7cfc6fb000 – Unique ID assigned by JVM. It's returned by calling the Thread.getId() method.
4
Native Id - 0x4479 - This ID is highly platform dependent. On Linux, it's the pid of the thread. On Windows, it's simply the OS-level thread ID within
a process. On Mac OS X, it is said to be the native pthread_t value.
5
Address space - 0x00002b7d17ab8000 -
6
Thread State - RUNNABLE
7 Stack trace -
5
How to analyze Thread dump?
https://www.ibm.com/support/pa
ges/ibm-thread-and-monitor-du
mp-analyzer-java-tmda
IBM TDMA
FastThread
https://fastthread.io/
03
02
https://tinyurl.com/wq95weo
Sample thread
report
yCrash
https://ycrash.io/
01
6
7
Poor Response Time
Major Cloud Service Provider
Blog: https://blog.gceasy.io/garbage-collection-tuning-success-story-reducing-young-gen-size/
What is Garbage?
HTTP Request
Objects
Memory
Garbage
8
9
3 - 4 Decades ago
Developer
Writes code to Manually evict Garbage
JVM
Automatically evicts Garbage
Now
How are objects Garbage Collected?
Evolution: Manual -> Automatic
10
Automatic GC sounds good right?
Yes, but for
GC pauses CPU consumption
Open-source script:
https://github.com/ycrash/yc-data-script
1. GC Log
10. netstat
12. vmstat
2. Thread Dump
9. dmesg
3. Heap Dump
6. ps
8. Disk Usage
5. top 13. iostat
11. ping
14. Kernel Params
15. App Logs
16. metadata
4. Heap Substitute
7. top -H
11
360° Troubleshooting artifacts
2019-08-31T01:09:19.397+0000: 1.606: [GC (Metadata GC Threshold) [PSYoungGen: 545393K->18495K(2446848K)] 545393K->18519K(8039424K),
0.0189376 secs] [Times: user=0.15 sys=0.01, real=0.02 secs]
2019-08-31T01:09:19.416+0000: 1.625: [Full GC (Metadata GC Threshold) [PSYoungGen: 18495K->0K(2446848K)] [ParOldGen: 24K->17366K(5592576K)]
18519K->17366K(8039424K), [Metaspace: 20781K->20781K(1067008K)], 0.0416162 secs] [Times: user=0.38 sys=0.03, real=0.04 secs]
2019-08-31T01:18:19.288+0000: 541.497: [GC (Metadata GC Threshold) [PSYoungGen: 1391495K->18847K(2446848K)] 1408861K->36230K(8039424K),
0.0568365 secs] [Times: user=0.31 sys=0.75, real=0.06 secs]
2019-08-31T01:18:19.345+0000: 541.554: [Full GC (Metadata GC Threshold) [PSYoungGen: 18847K->0K(2446848K)] [ParOldGen: 17382K-
>25397K(5592576K)] 36230K->25397K(8039424K), [Metaspace: 34865K->34865K(1079296K)], 0.0467640 secs] [Times: user=0.31 sys=0.08, real=0.04 secs]
2019-08-31T02:33:20.326+0000: 5042.536: [GC (Allocation Failure) [PSYoungGen: 2097664K->11337K(2446848K)] 2123061K->36742K(8039424K),
0.3298985 secs] [Times: user=0.00 sys=9.20, real=0.33 secs]
2019-08-31T03:40:11.749+0000: 9053.959: [GC (Allocation Failure) [PSYoungGen: 2109001K->15776K(2446848K)] 2134406K->41189K(8039424K),
0.0517517 secs] [Times: user=0.00 sys=1.22, real=0.05 secs]
2019-08-31T05:11:46.869+0000: 14549.079: [GC (Allocation Failure) [PSYoungGen: 2113440K->24832K(2446848K)] 2138853K->50253K(8039424K),
0.0392831 secs] [Times: user=0.02 sys=0.79, real=0.04 secs]
2019-08-31T06:26:10.376+0000: 19012.586: [GC (Allocation Failure) [PSYoungGen: 2122496K->25600K(2756096K)] 2147917K->58149K(8348672K),
0.0371416 secs] [Times: user=0.01 sys=0.75, real=0.04 secs]
2019-08-31T07:50:03.442+0000: 24045.652: [GC (Allocation Failure) [PSYoungGen: 2756096K->32768K(2763264K)] 2788645K->72397K(8355840K),
0.0709641 secs] [Times: user=0.16 sys=1.39, real=0.07 secs]
2019-08-31T09:04:21.406+0000: 28503.616: [GC (Allocation Failure) [PSYoungGen: 2763264K->32768K(2733568K)] 2802893K->83469K(8326144K),
0.0789178 secs] [Times: user=0.12 sys=1.59, real=0.08 secs]
Sample GC Log
How to analyze GC Log?
https://developer.ibm.c
om/javasdk/tools/
IBM GC & Memory visualizer
GCeasy
yCrash
https://gceasy.io/
Google Garbage cat (cms)
https://code.google.co
m/archive/a/eclipselabs
.org/p/garbagecat
HP Jmeter
https://h20392.www2.h
pe.com/portal/swdepot
/displayProductInfo.do?
productNumber=HPJME
TER
03
02
01
05
04
https://ycrash.io/
13
14
More GC Tuning case
studies
Uber Saves Millions of $
https://blog.gceasy.io/2022/03/04/garbage-collection-tuning-success-story-reducing-young-gen-size/
Large Automobile Manufacturer Improves Response Time
https://blog.gceasy.io/2022/03/04/garbage-collection-tuning-success-story-reducing-young-gen-size/
CloudBees (Jenkins Parent company) optimizes
https://blog.gceasy.io/2019/08/01/cloudbees-gc-performance-optimized-with-gceasy/
Oracle optimizes App performance by tuning GC
https://blog.gceasy.io/2022/12/06/oracle-architect-optimizes-performance-using-gceasy/
15
Large SaaS company CEO’s tweet
Intermittent HTTP 502 Errors
16
Major Travel Service Provider
EBS Architecture
17
Clue: Nginx Error
18
1. GC Log
10. netstat
12. vmstat
2. Thread Dump
9. dmesg
3. Heap Dump
6. ps
8. Disk Usage
5. top 13. iostat
11. ping
14. Kernel Params
15. App Logs
16. metadata
4. Heap Substitute
7. top -H
19
Open-source script:
https://github.com/ycrash/yc-data-script
360° Data
20
21
JVM Performance Master Class
https://ycrash.io/java-performance-training
Ram Lakshmanan ram@tier1app.com
@tier1app https://www.linkedin.com/company/ycrash
This deck will be published in:
https://blog.ycrash.io
If you want to learn more …
22
THANK YOU
FRIENDS

TroubleshootingJVMOutages-3CaseStudies.pptx

  • 1.
    Troubleshooting JVM Outages 3Fortune 500 Case Studies Ram Lakshmanan Architect GCeasy, FastThread, HeapHero
  • 2.
    2 Slowdown Major Financial Institutionin N. America Analysis Report: https://tinyurl.com/5da3ft8z
  • 3.
    Open-source script: https://github.com/ycrash/yc-data-script 1. GCLog 10. netstat 12. vmstat 2. Thread Dump 9. dmesg 3. Heap Dump 6. ps 8. Disk Usage 5. top 13. iostat 11. ping 14. Kernel Params 15. App Logs 16. metadata 4. Heap Substitute 7. top -H 3 360° Troubleshooting artifacts
  • 4.
    1 2 3 1 Timestamp atwhich thread dump was triggered 2 JVM Version info 3 Thread Details - <<details in following slides>> 4
  • 5.
    1 2 34 5 6 7 1 Thread Name - InvoiceThread-A996 2 Priority - Can have values from 1 to 10 3 Thread Id - 0x00002b7cfc6fb000 – Unique ID assigned by JVM. It's returned by calling the Thread.getId() method. 4 Native Id - 0x4479 - This ID is highly platform dependent. On Linux, it's the pid of the thread. On Windows, it's simply the OS-level thread ID within a process. On Mac OS X, it is said to be the native pthread_t value. 5 Address space - 0x00002b7d17ab8000 - 6 Thread State - RUNNABLE 7 Stack trace - 5
  • 6.
    How to analyzeThread dump? https://www.ibm.com/support/pa ges/ibm-thread-and-monitor-du mp-analyzer-java-tmda IBM TDMA FastThread https://fastthread.io/ 03 02 https://tinyurl.com/wq95weo Sample thread report yCrash https://ycrash.io/ 01 6
  • 7.
    7 Poor Response Time MajorCloud Service Provider Blog: https://blog.gceasy.io/garbage-collection-tuning-success-story-reducing-young-gen-size/
  • 8.
    What is Garbage? HTTPRequest Objects Memory Garbage 8
  • 9.
    9 3 - 4Decades ago Developer Writes code to Manually evict Garbage JVM Automatically evicts Garbage Now How are objects Garbage Collected? Evolution: Manual -> Automatic
  • 10.
    10 Automatic GC soundsgood right? Yes, but for GC pauses CPU consumption
  • 11.
    Open-source script: https://github.com/ycrash/yc-data-script 1. GCLog 10. netstat 12. vmstat 2. Thread Dump 9. dmesg 3. Heap Dump 6. ps 8. Disk Usage 5. top 13. iostat 11. ping 14. Kernel Params 15. App Logs 16. metadata 4. Heap Substitute 7. top -H 11 360° Troubleshooting artifacts
  • 12.
    2019-08-31T01:09:19.397+0000: 1.606: [GC(Metadata GC Threshold) [PSYoungGen: 545393K->18495K(2446848K)] 545393K->18519K(8039424K), 0.0189376 secs] [Times: user=0.15 sys=0.01, real=0.02 secs] 2019-08-31T01:09:19.416+0000: 1.625: [Full GC (Metadata GC Threshold) [PSYoungGen: 18495K->0K(2446848K)] [ParOldGen: 24K->17366K(5592576K)] 18519K->17366K(8039424K), [Metaspace: 20781K->20781K(1067008K)], 0.0416162 secs] [Times: user=0.38 sys=0.03, real=0.04 secs] 2019-08-31T01:18:19.288+0000: 541.497: [GC (Metadata GC Threshold) [PSYoungGen: 1391495K->18847K(2446848K)] 1408861K->36230K(8039424K), 0.0568365 secs] [Times: user=0.31 sys=0.75, real=0.06 secs] 2019-08-31T01:18:19.345+0000: 541.554: [Full GC (Metadata GC Threshold) [PSYoungGen: 18847K->0K(2446848K)] [ParOldGen: 17382K- >25397K(5592576K)] 36230K->25397K(8039424K), [Metaspace: 34865K->34865K(1079296K)], 0.0467640 secs] [Times: user=0.31 sys=0.08, real=0.04 secs] 2019-08-31T02:33:20.326+0000: 5042.536: [GC (Allocation Failure) [PSYoungGen: 2097664K->11337K(2446848K)] 2123061K->36742K(8039424K), 0.3298985 secs] [Times: user=0.00 sys=9.20, real=0.33 secs] 2019-08-31T03:40:11.749+0000: 9053.959: [GC (Allocation Failure) [PSYoungGen: 2109001K->15776K(2446848K)] 2134406K->41189K(8039424K), 0.0517517 secs] [Times: user=0.00 sys=1.22, real=0.05 secs] 2019-08-31T05:11:46.869+0000: 14549.079: [GC (Allocation Failure) [PSYoungGen: 2113440K->24832K(2446848K)] 2138853K->50253K(8039424K), 0.0392831 secs] [Times: user=0.02 sys=0.79, real=0.04 secs] 2019-08-31T06:26:10.376+0000: 19012.586: [GC (Allocation Failure) [PSYoungGen: 2122496K->25600K(2756096K)] 2147917K->58149K(8348672K), 0.0371416 secs] [Times: user=0.01 sys=0.75, real=0.04 secs] 2019-08-31T07:50:03.442+0000: 24045.652: [GC (Allocation Failure) [PSYoungGen: 2756096K->32768K(2763264K)] 2788645K->72397K(8355840K), 0.0709641 secs] [Times: user=0.16 sys=1.39, real=0.07 secs] 2019-08-31T09:04:21.406+0000: 28503.616: [GC (Allocation Failure) [PSYoungGen: 2763264K->32768K(2733568K)] 2802893K->83469K(8326144K), 0.0789178 secs] [Times: user=0.12 sys=1.59, real=0.08 secs] Sample GC Log
  • 13.
    How to analyzeGC Log? https://developer.ibm.c om/javasdk/tools/ IBM GC & Memory visualizer GCeasy yCrash https://gceasy.io/ Google Garbage cat (cms) https://code.google.co m/archive/a/eclipselabs .org/p/garbagecat HP Jmeter https://h20392.www2.h pe.com/portal/swdepot /displayProductInfo.do? productNumber=HPJME TER 03 02 01 05 04 https://ycrash.io/ 13
  • 14.
    14 More GC Tuningcase studies Uber Saves Millions of $ https://blog.gceasy.io/2022/03/04/garbage-collection-tuning-success-story-reducing-young-gen-size/ Large Automobile Manufacturer Improves Response Time https://blog.gceasy.io/2022/03/04/garbage-collection-tuning-success-story-reducing-young-gen-size/ CloudBees (Jenkins Parent company) optimizes https://blog.gceasy.io/2019/08/01/cloudbees-gc-performance-optimized-with-gceasy/ Oracle optimizes App performance by tuning GC https://blog.gceasy.io/2022/12/06/oracle-architect-optimizes-performance-using-gceasy/
  • 15.
    15 Large SaaS companyCEO’s tweet
  • 16.
    Intermittent HTTP 502Errors 16 Major Travel Service Provider
  • 17.
  • 18.
  • 19.
    1. GC Log 10.netstat 12. vmstat 2. Thread Dump 9. dmesg 3. Heap Dump 6. ps 8. Disk Usage 5. top 13. iostat 11. ping 14. Kernel Params 15. App Logs 16. metadata 4. Heap Substitute 7. top -H 19 Open-source script: https://github.com/ycrash/yc-data-script 360° Data
  • 20.
  • 21.
    21 JVM Performance MasterClass https://ycrash.io/java-performance-training
  • 22.
    Ram Lakshmanan ram@tier1app.com @tier1apphttps://www.linkedin.com/company/ycrash This deck will be published in: https://blog.ycrash.io If you want to learn more … 22 THANK YOU FRIENDS

Editor's Notes

  • #2 http://localhost:8080/yc-report.jsp?ou=SAP&de=198.134.23.1&app=yc&ts=2023-06-11T22-56-32
  • #6 http://localhost:8080/yc-report.jsp?ou=SAP&de=198.134.23.1&app=yc&ts=2023-06-11T22-56-32
  • #13 Baseline: http://localhost:8080/yc-load-report-gc?ou=SAP&de=145.23.82.1&app=yc&ts=2023-06-11T23-03-50 Benchmark: http://localhost:8080/yc-load-report-gc?ou=SAP&de=193.45.89.12&app=yc&ts=2023-06-11T23-09-10
  • #20 https://test.ycrash.io/yc-report-kernel.jsp?ou=czlWbG0rUko0UXAxazlSbjZrSUIwUT09&de=172.31.7.106&app=yc&ts=2023-09-01T10-25-39