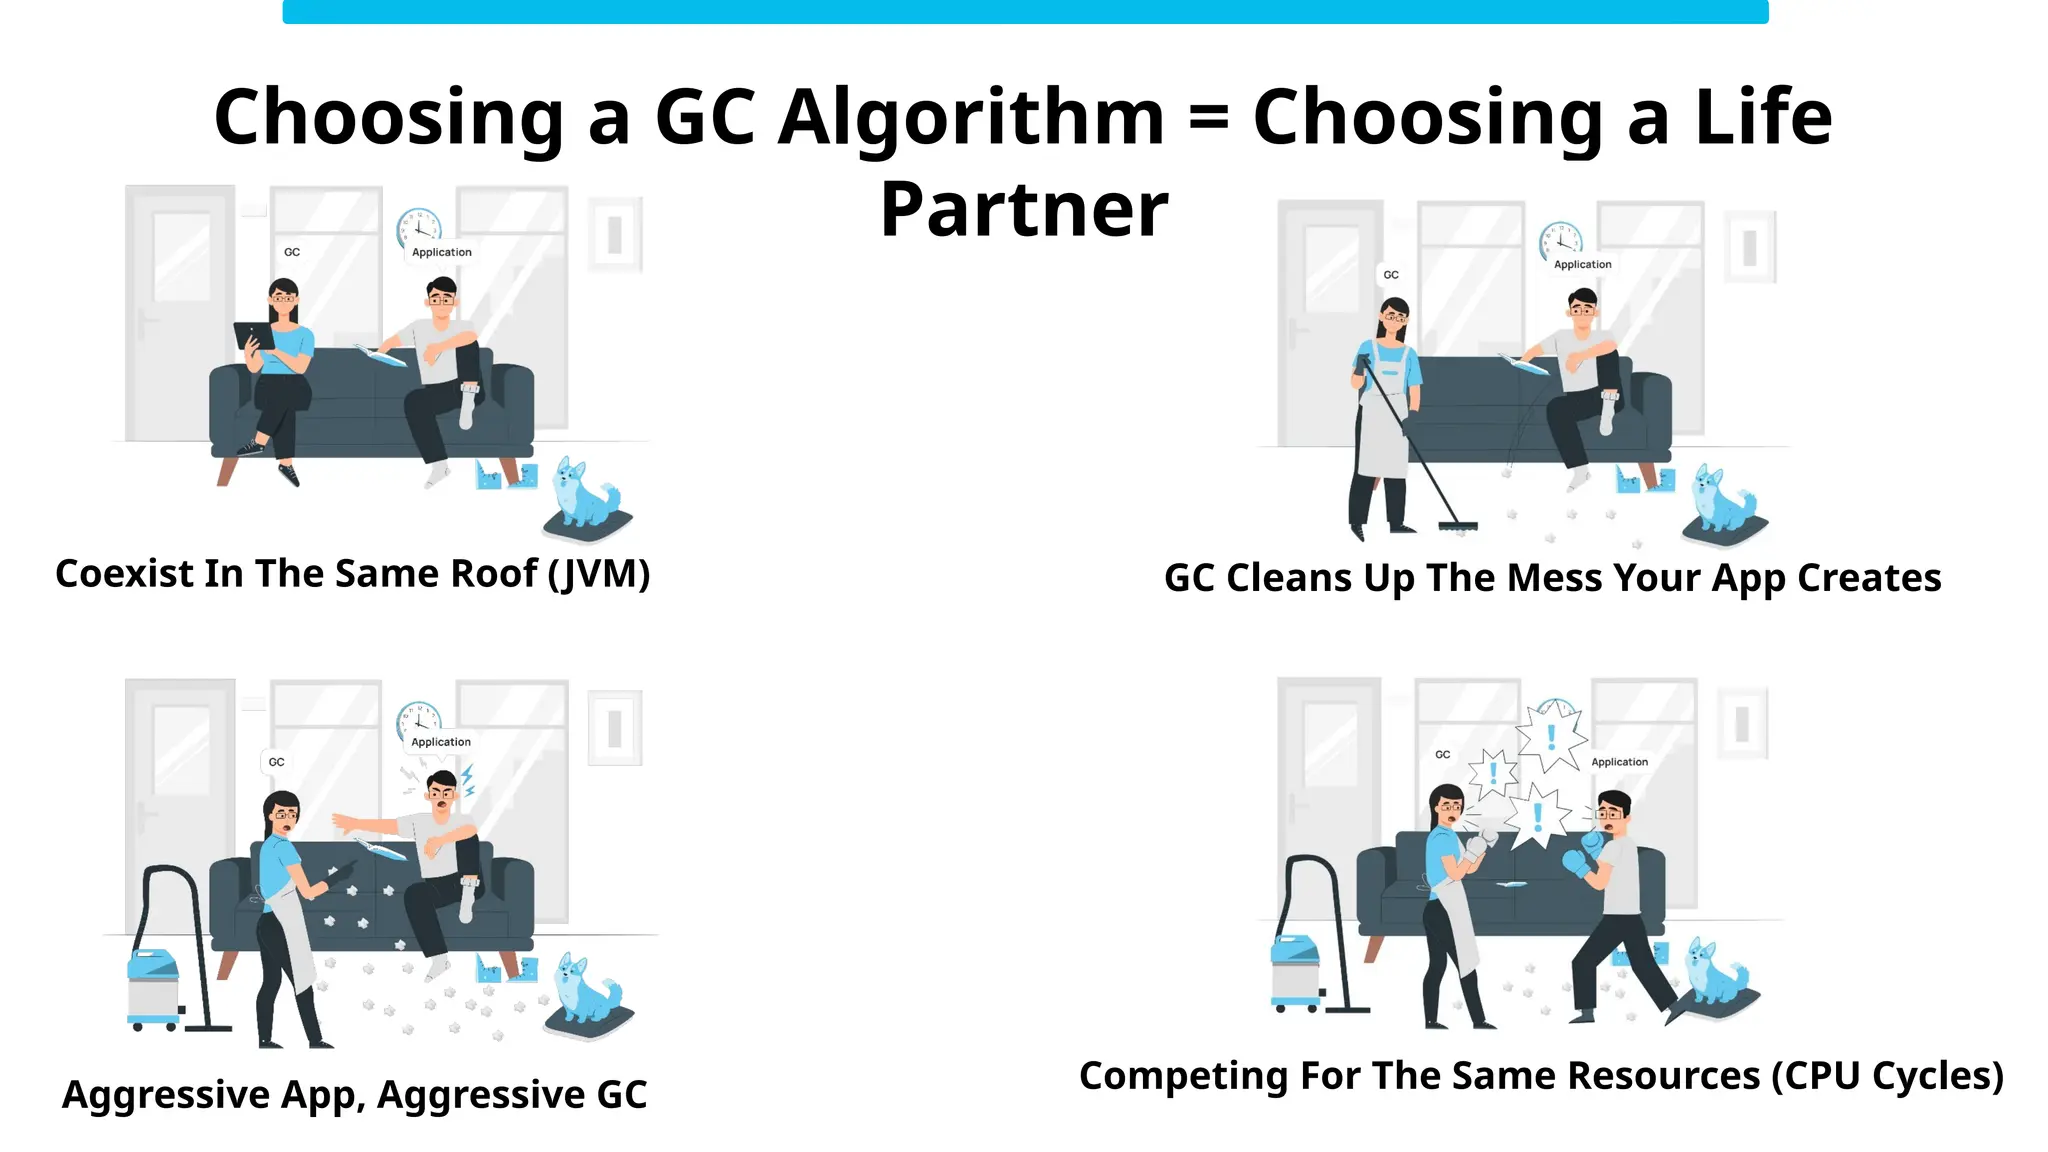
Choosing a GC Algorithm = Choosing a Life
Partner
Coexist In The Same Roof (JVM) GC Cleans Up The Mess Your App Creates
Aggressive App, Aggressive GC Competing For The Same Resources (CPU Cycles)
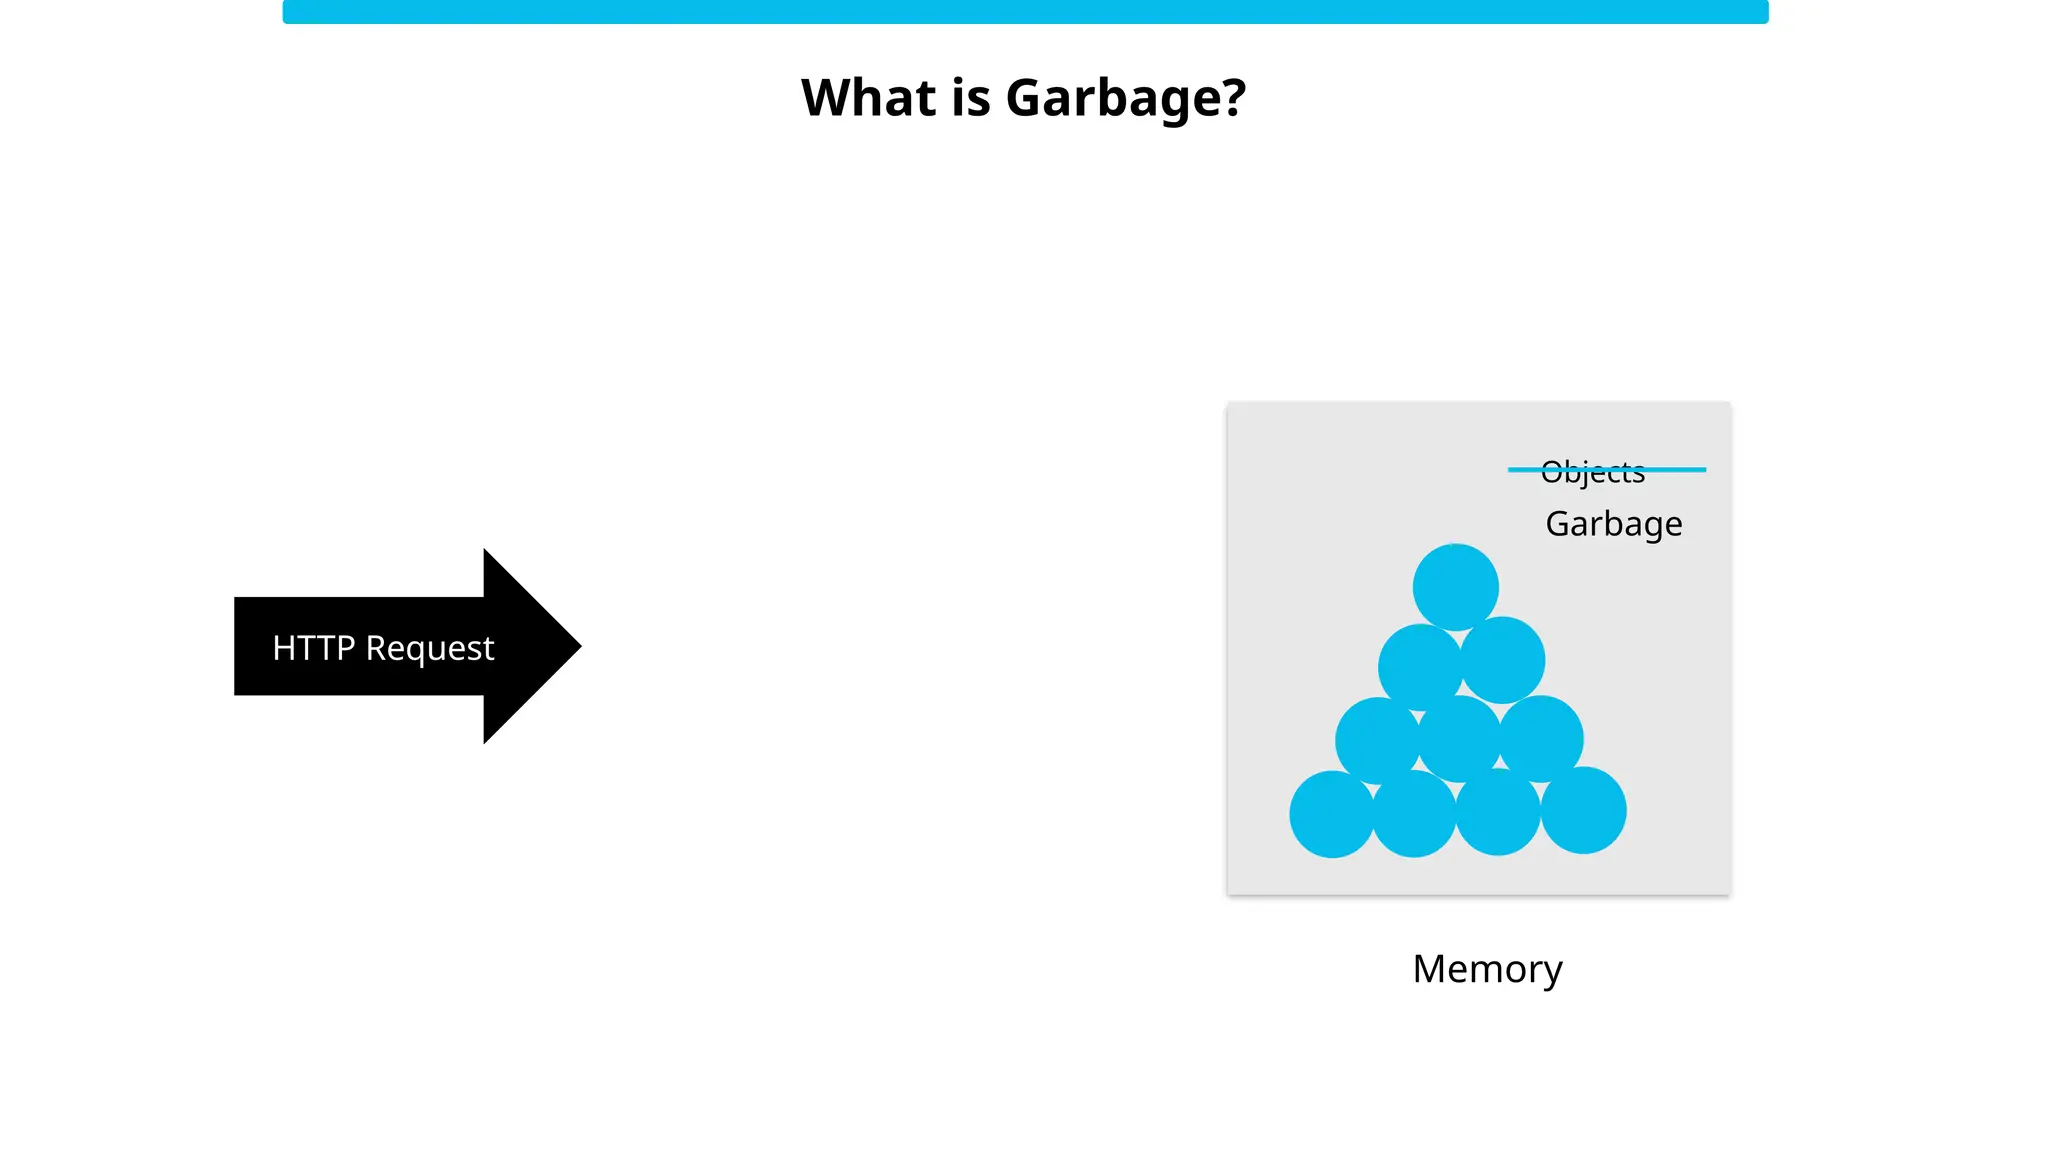
What is Garbage?
HTTP Request
Objects
Memory
Garbage
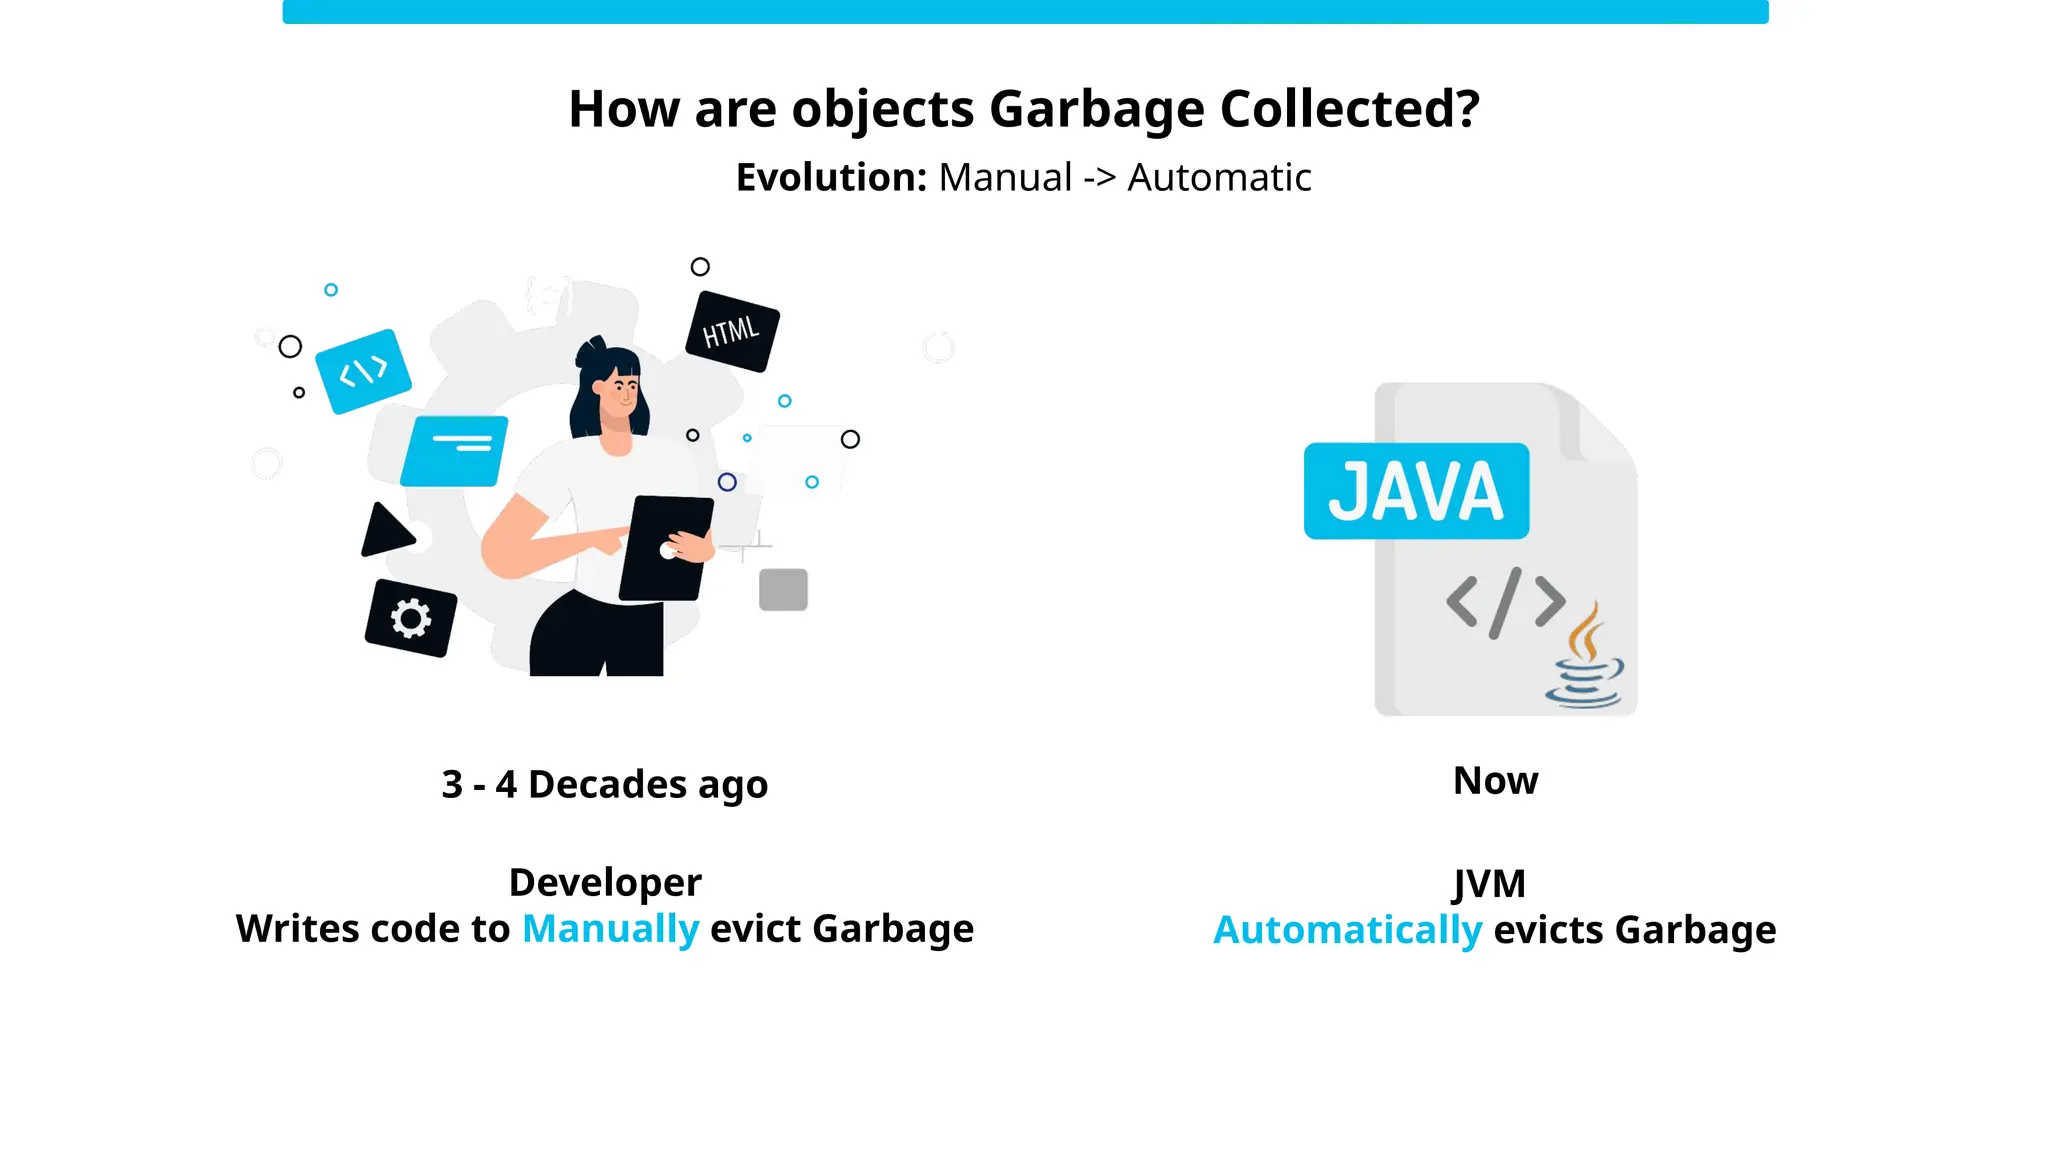
3 - 4 Decades ago
Developer
Writes code to Manually evict Garbage
JVM
Automatically evicts Garbage
Now
How are objects Garbage Collected?
Evolution: Manual -> Automatic
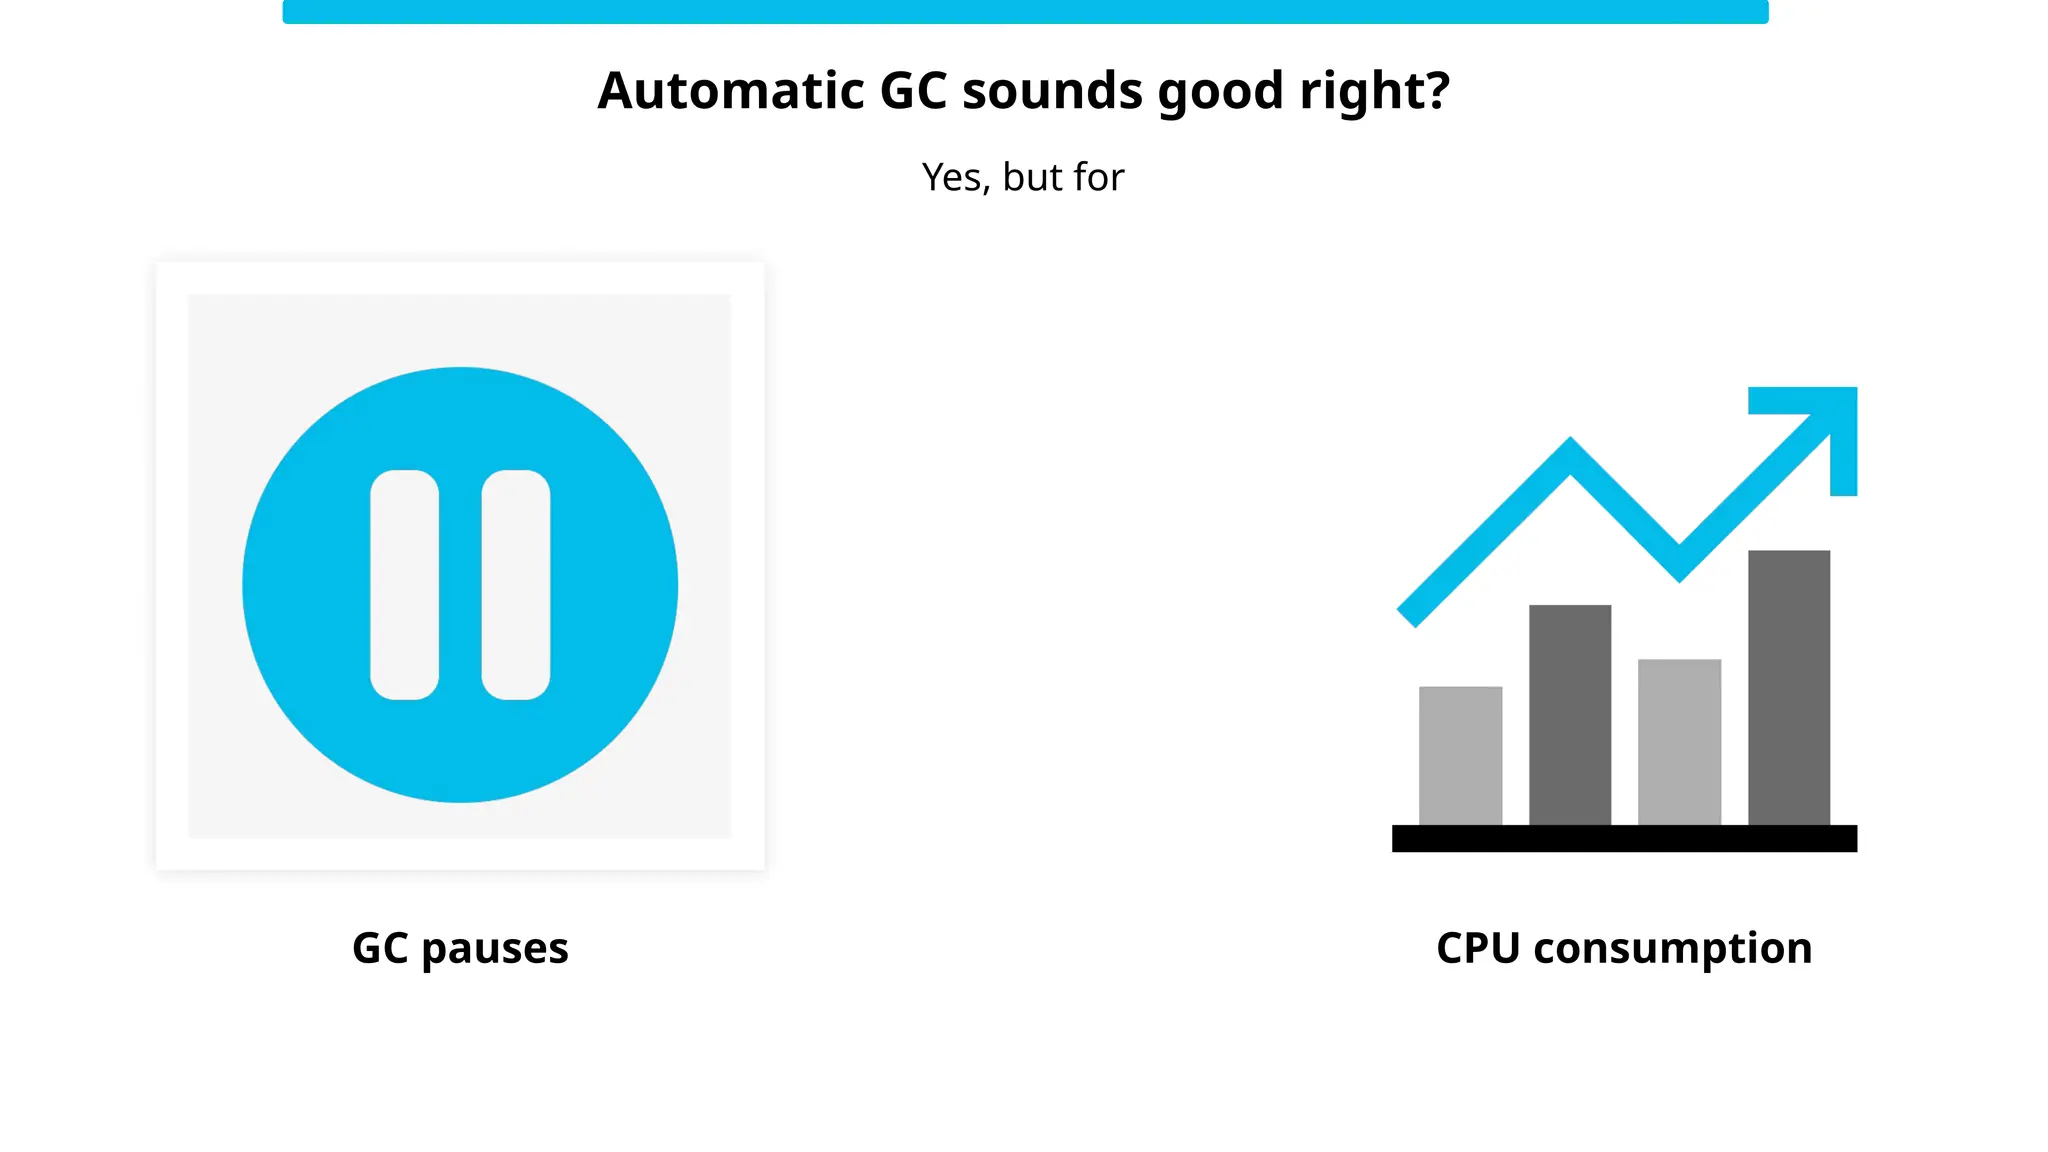
Automatic GC sounds good right?
Yes, but for
GC pauses CPU consumption
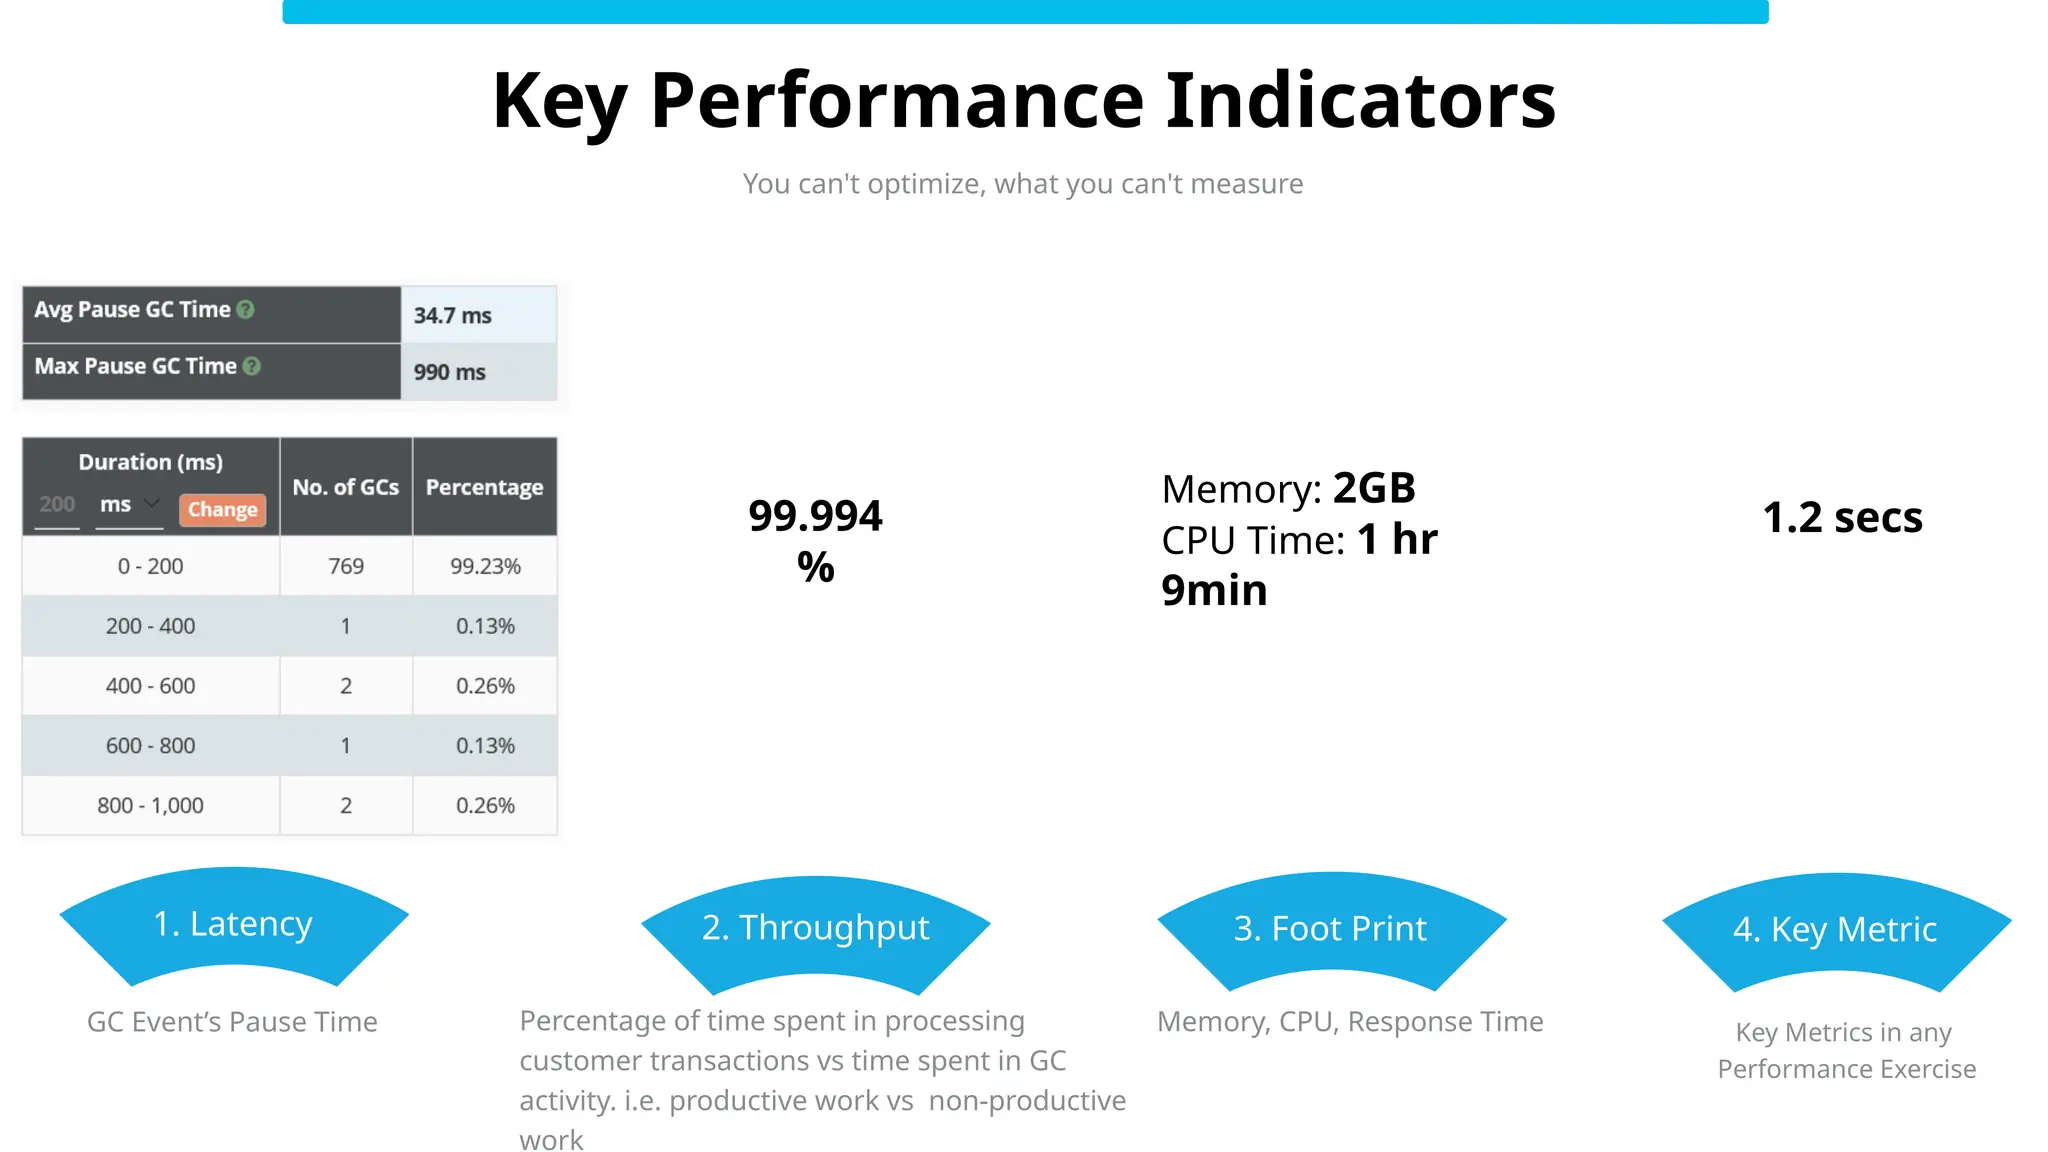
Key Performance Indicators
GC Event’s Pause Time
1. Latency
Percentage of time spent in processing
customer transactions vs time spent in GC
activity. i.e. productive work vs non-productive
work
2. Throughput
Memory, CPU, Response Time
3. Foot Print
99.994
%
Memory: 2GB
CPU Time: 1 hr
9min
You can't optimize, what you can't measure
1.2 secs
4. Key Metric
Key Metrics in any
Performance Exercise
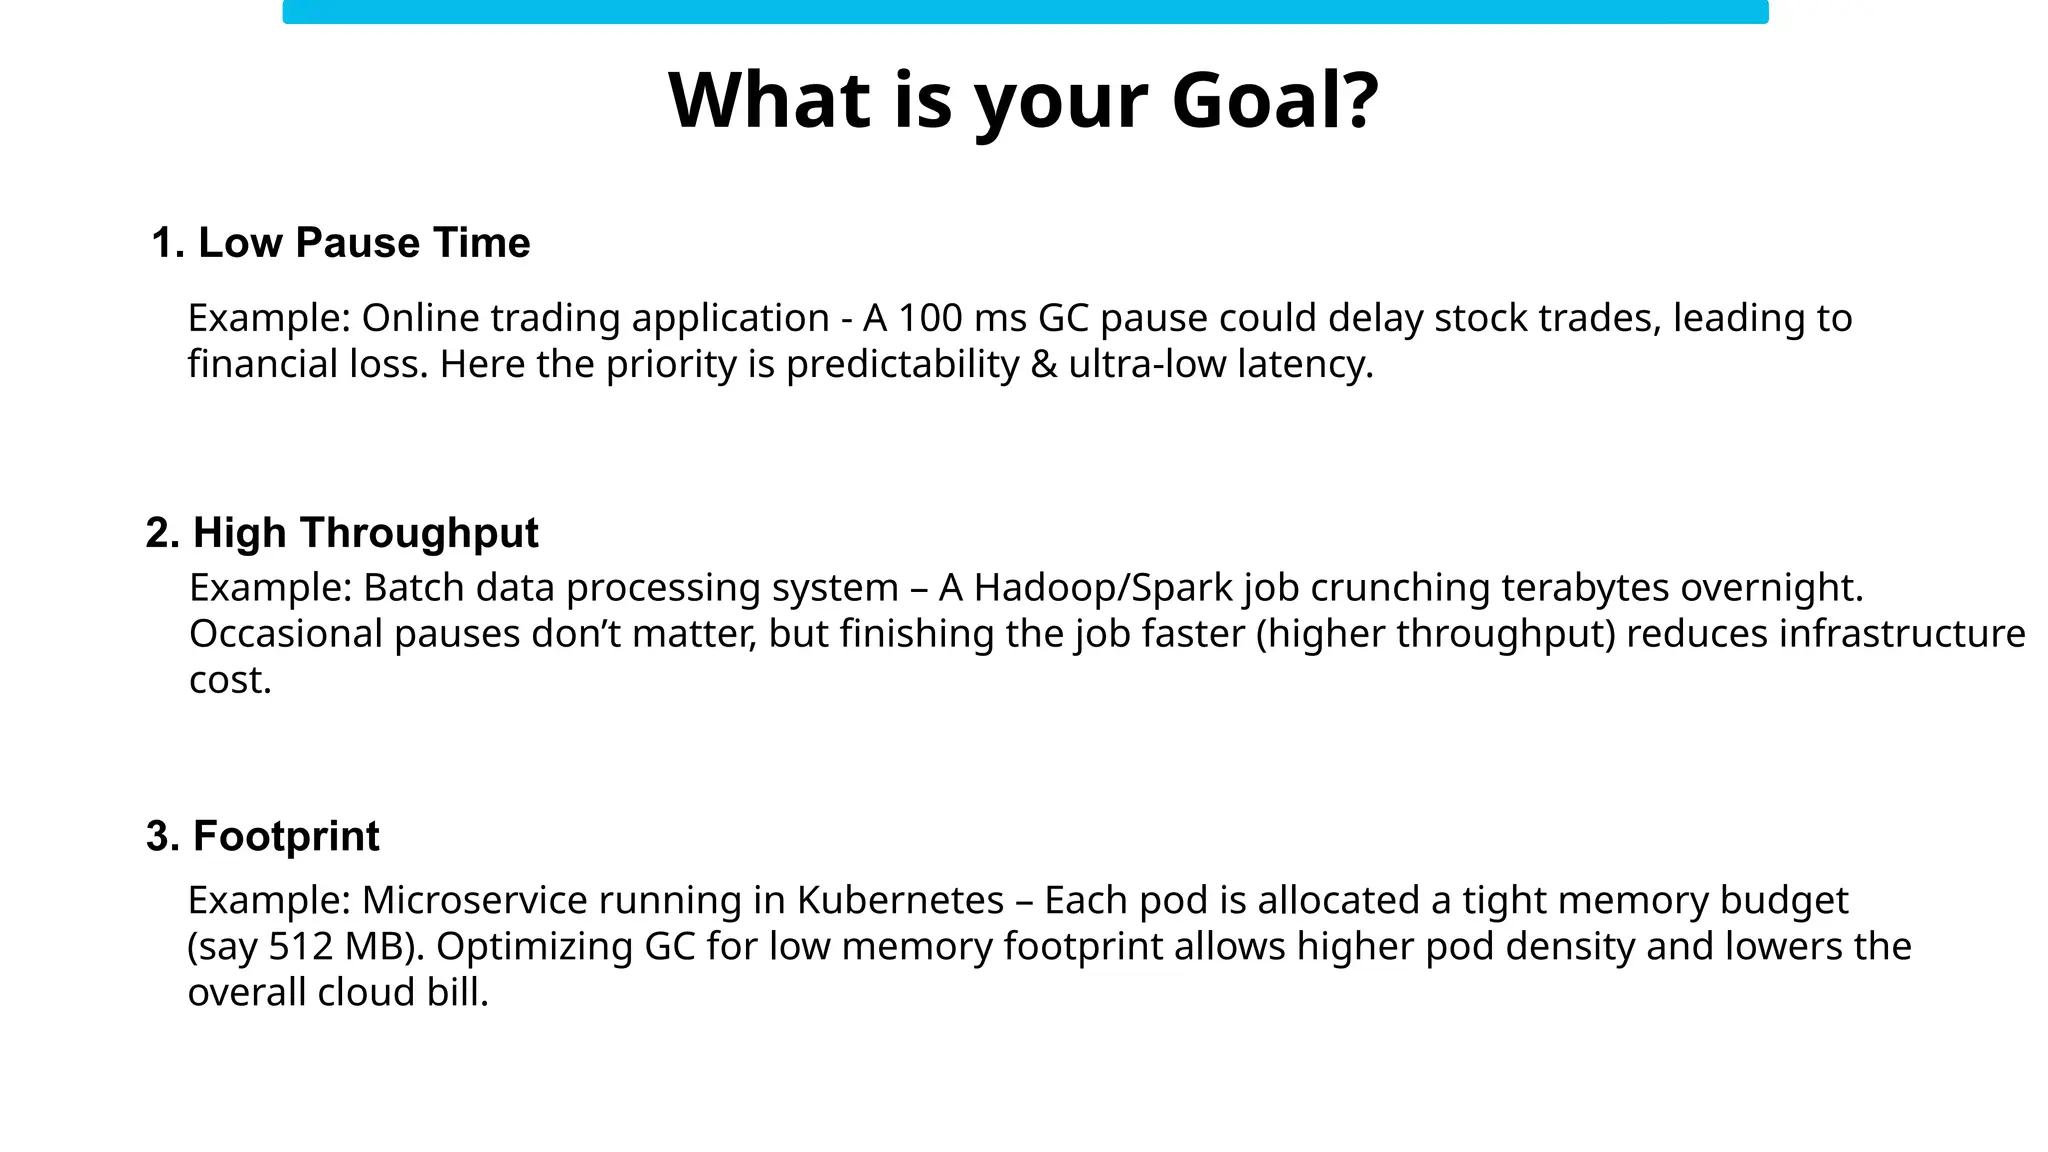
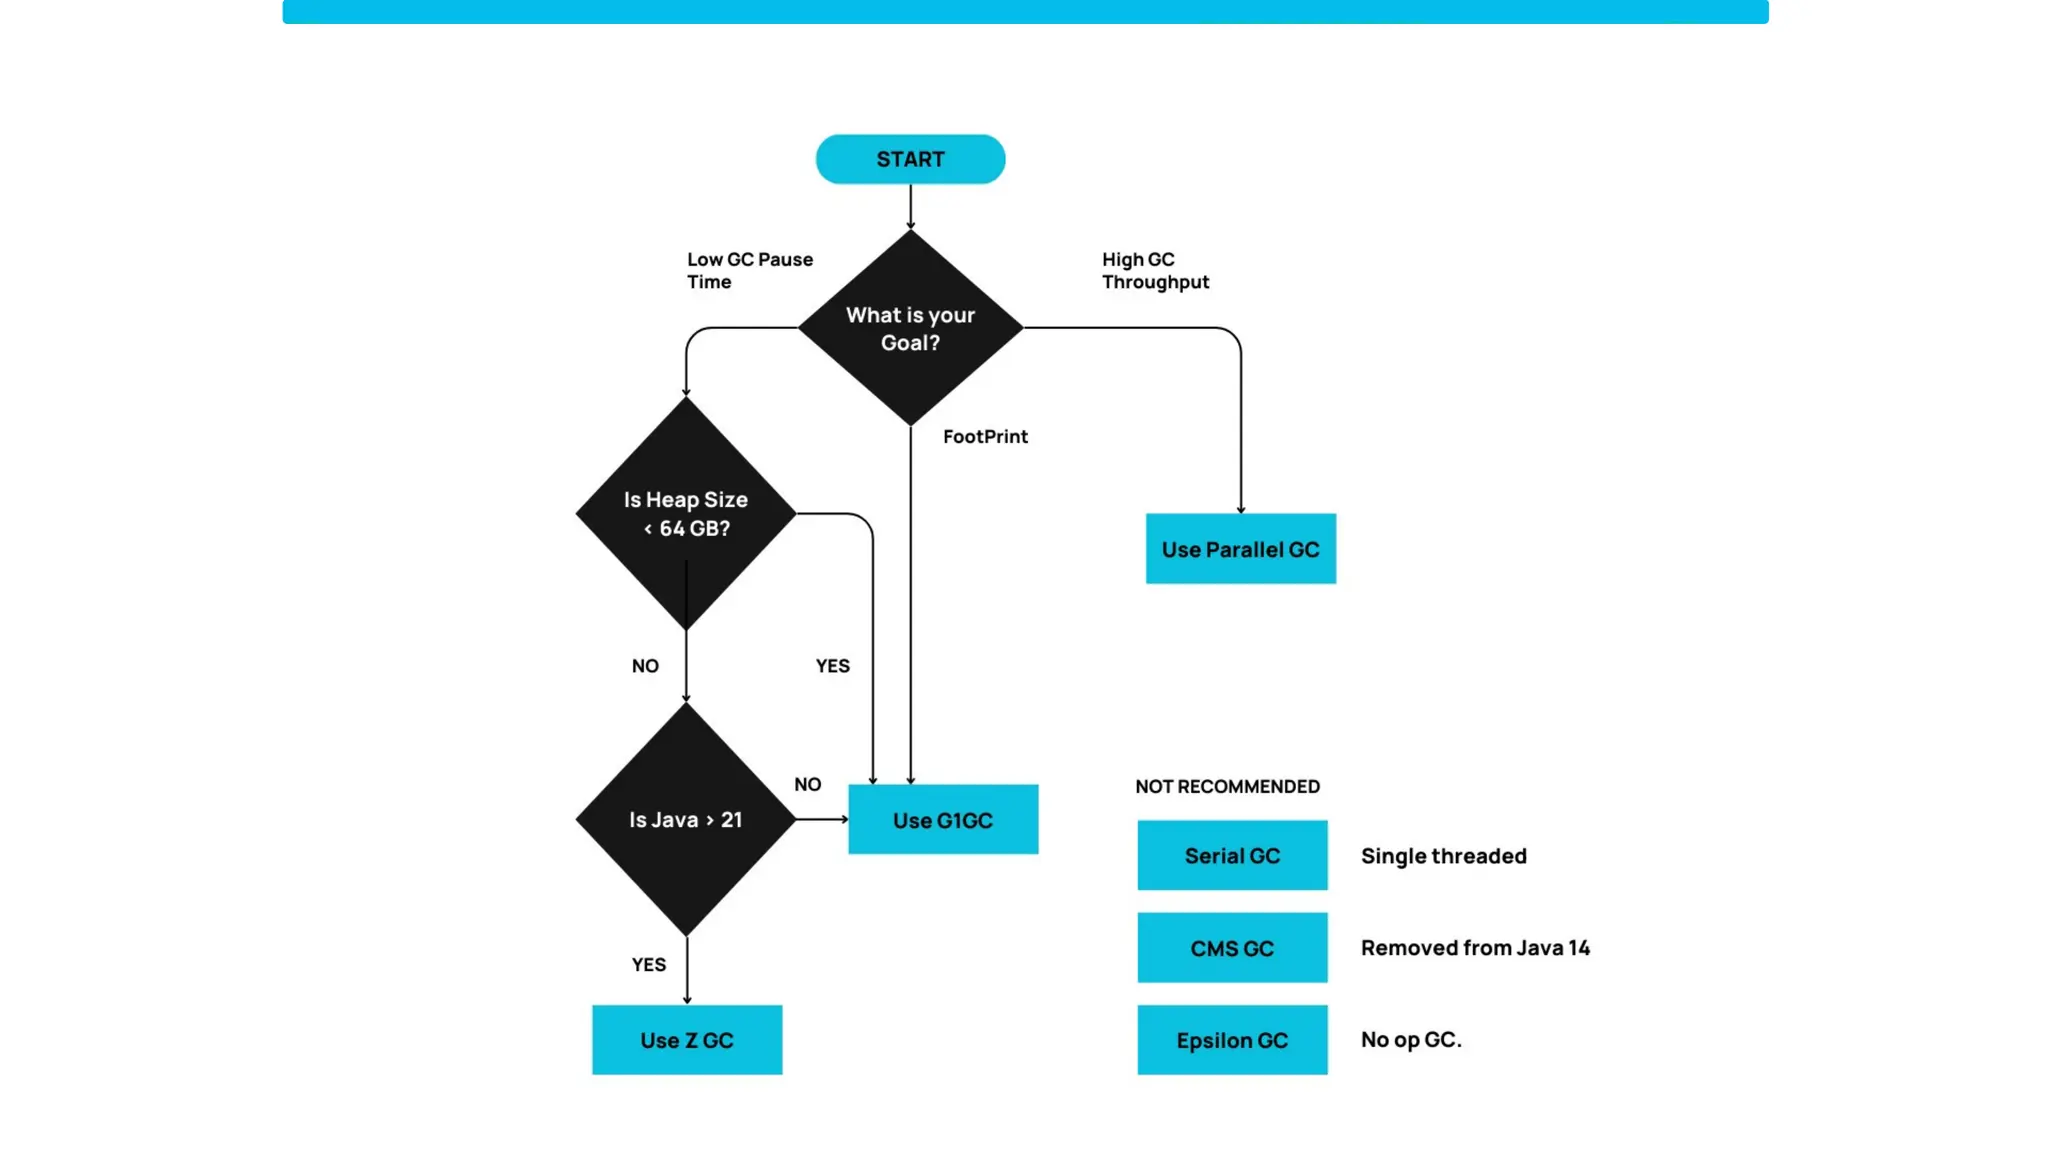
What is your Goal?
2. High Throughput
1. Low Pause Time
3. Footprint
Example: Online trading application - A 100 ms GC pause could delay stock trades, leading to
financial loss. Here the priority is predictability & ultra-low latency.
Example: Batch data processing system – A Hadoop/Spark job crunching terabytes overnight.
Occasional pauses don’t matter, but finishing the job faster (higher throughput) reduces infrastructure
cost.
Example: Microservice running in Kubernetes – Each pod is allocated a tight memory budget
(say 512 MB). Optimizing GC for low memory footprint allows higher pod density and lowers the
overall cloud bill.
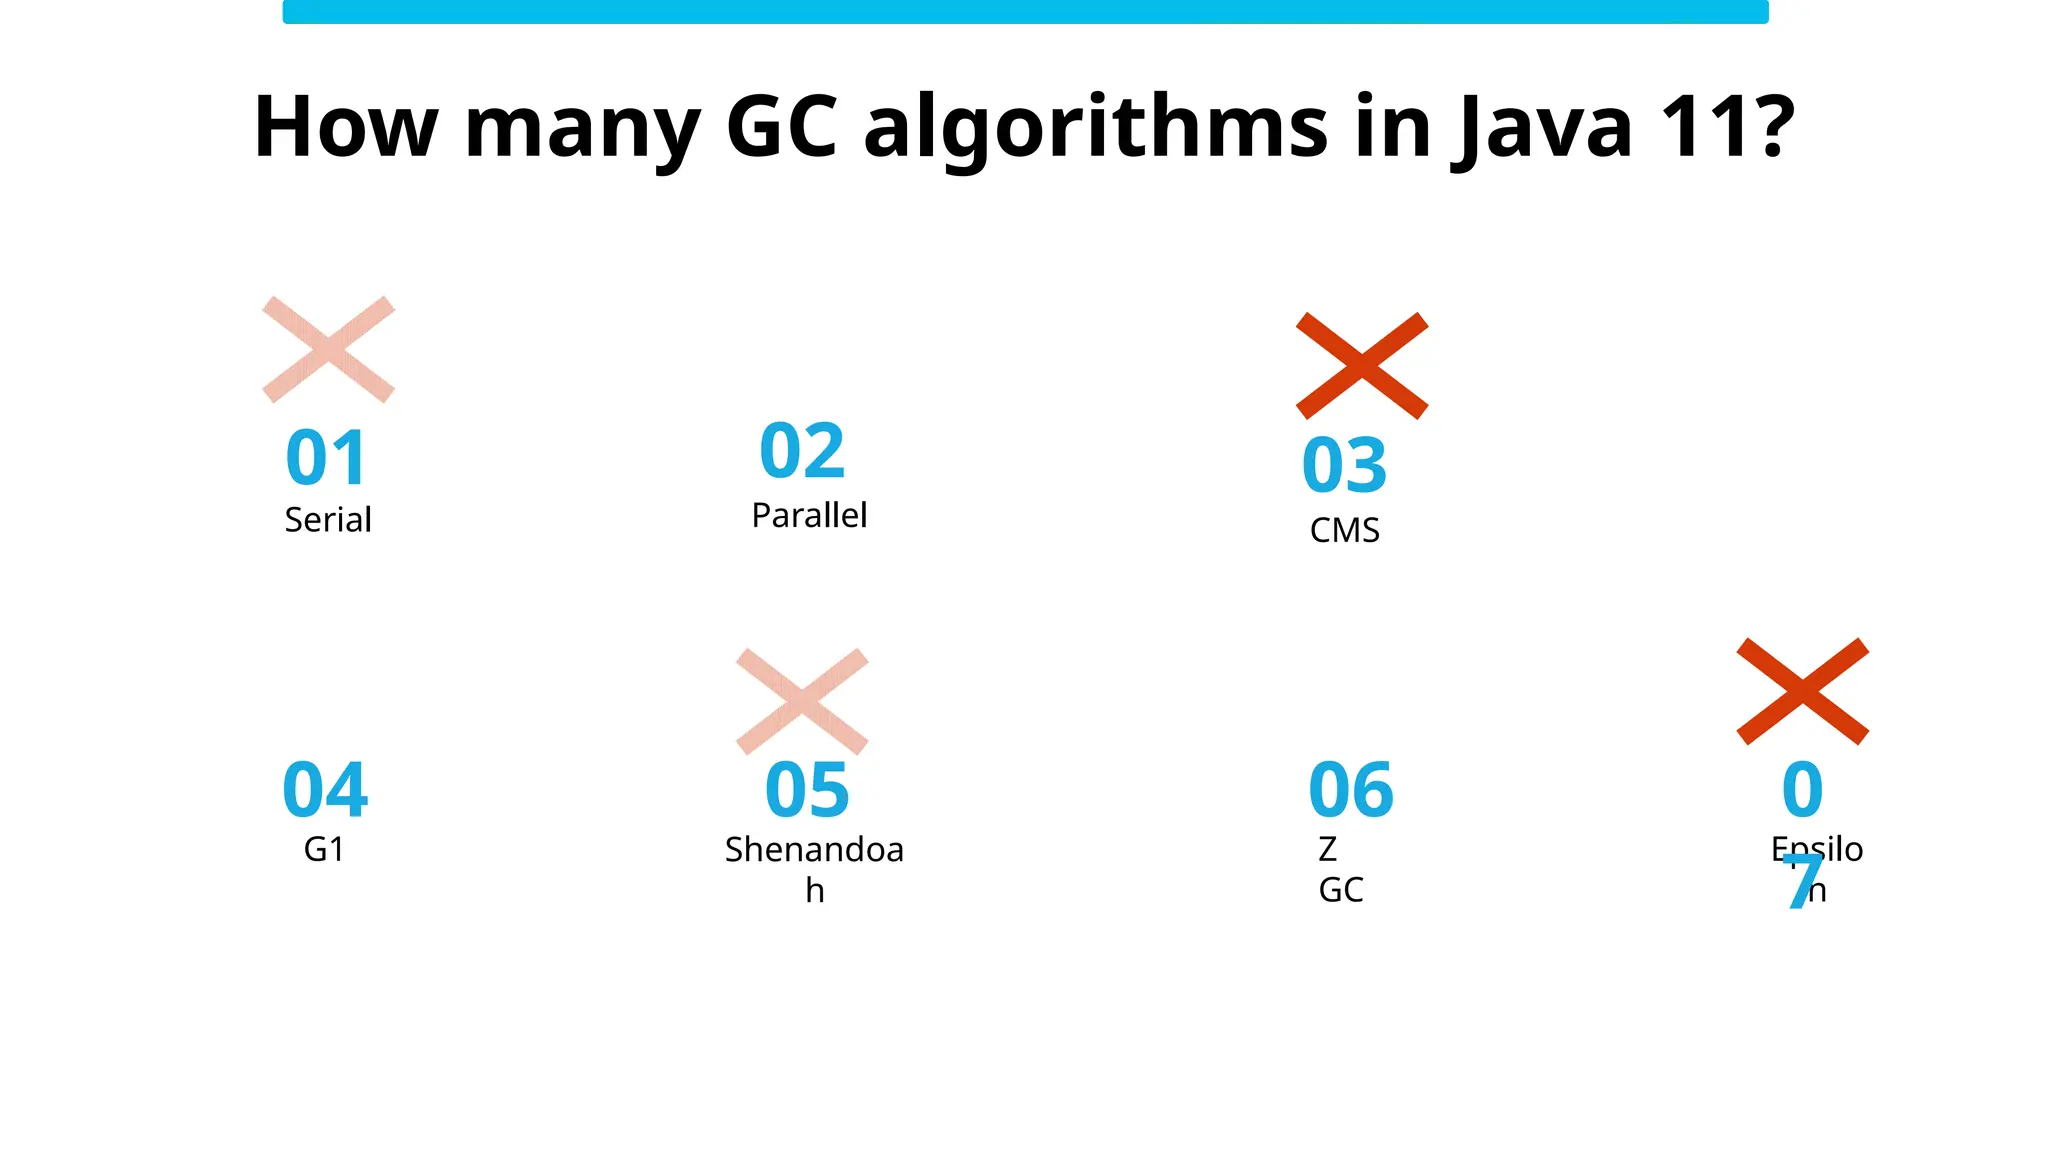
CMS
Parallel
Serial
Shenandoa
h
G1
03
02
01
05
04
Z
GC
06
Epsilo
n
0
7
How many GC algorithms in Java 11?
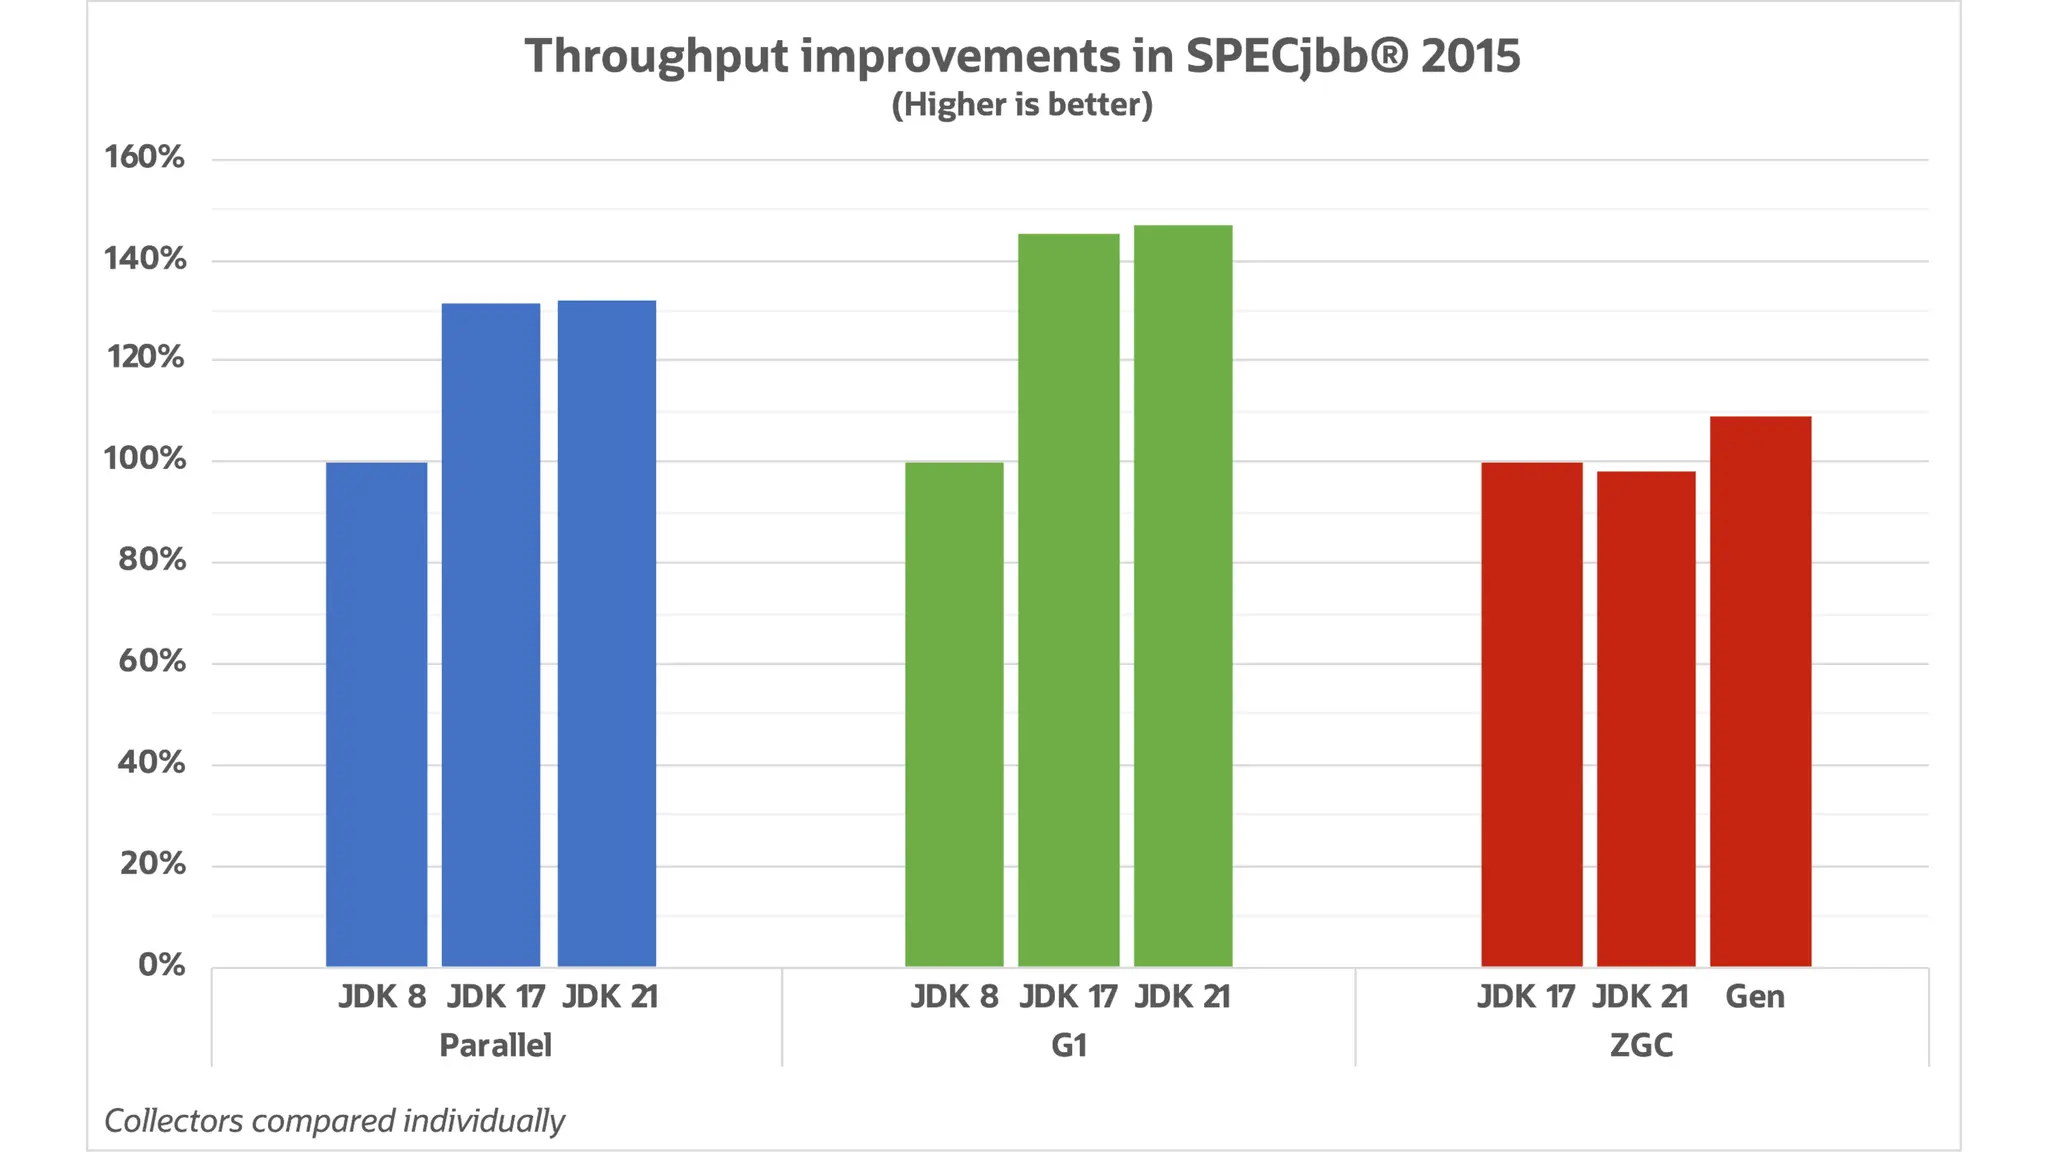
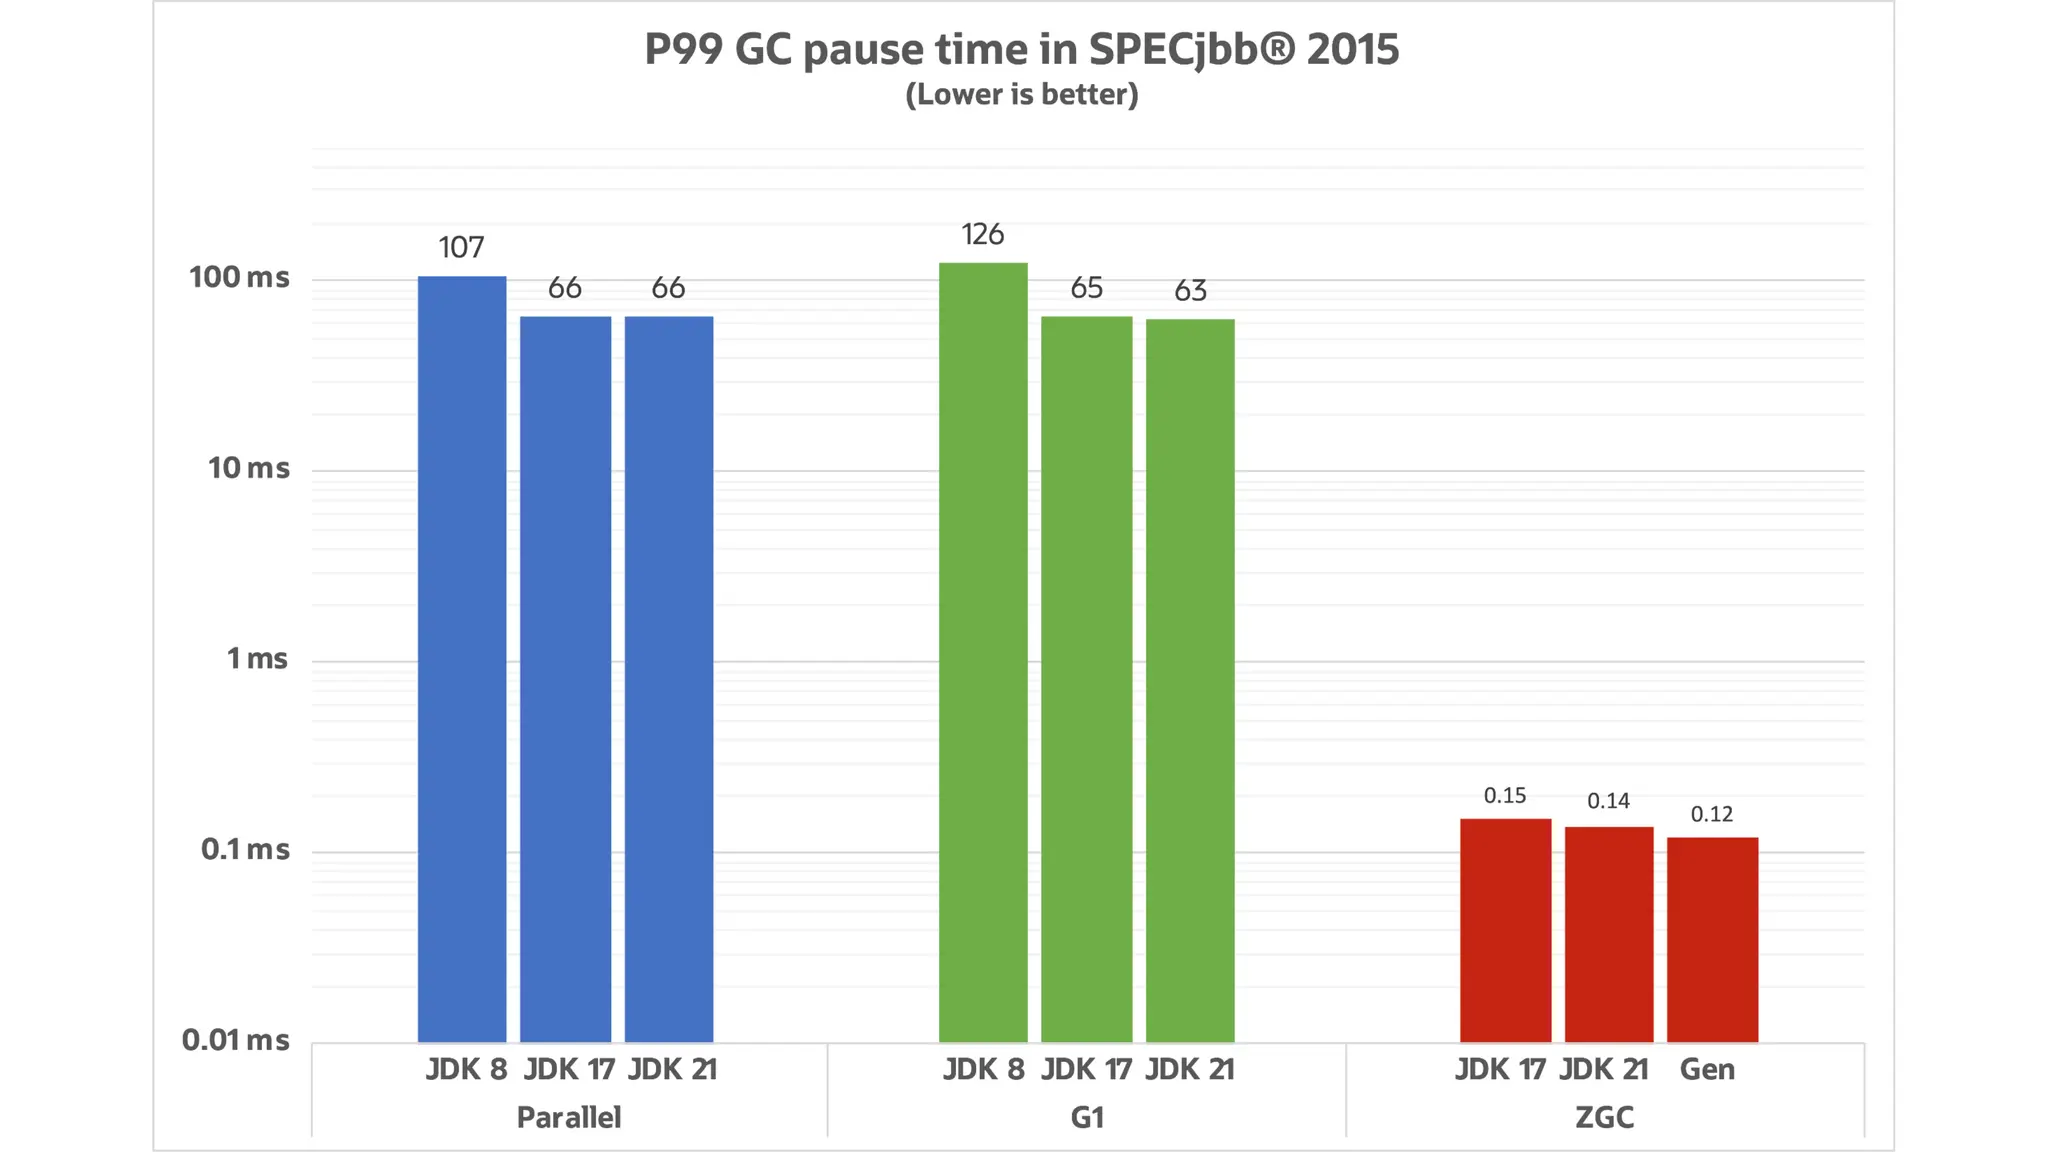
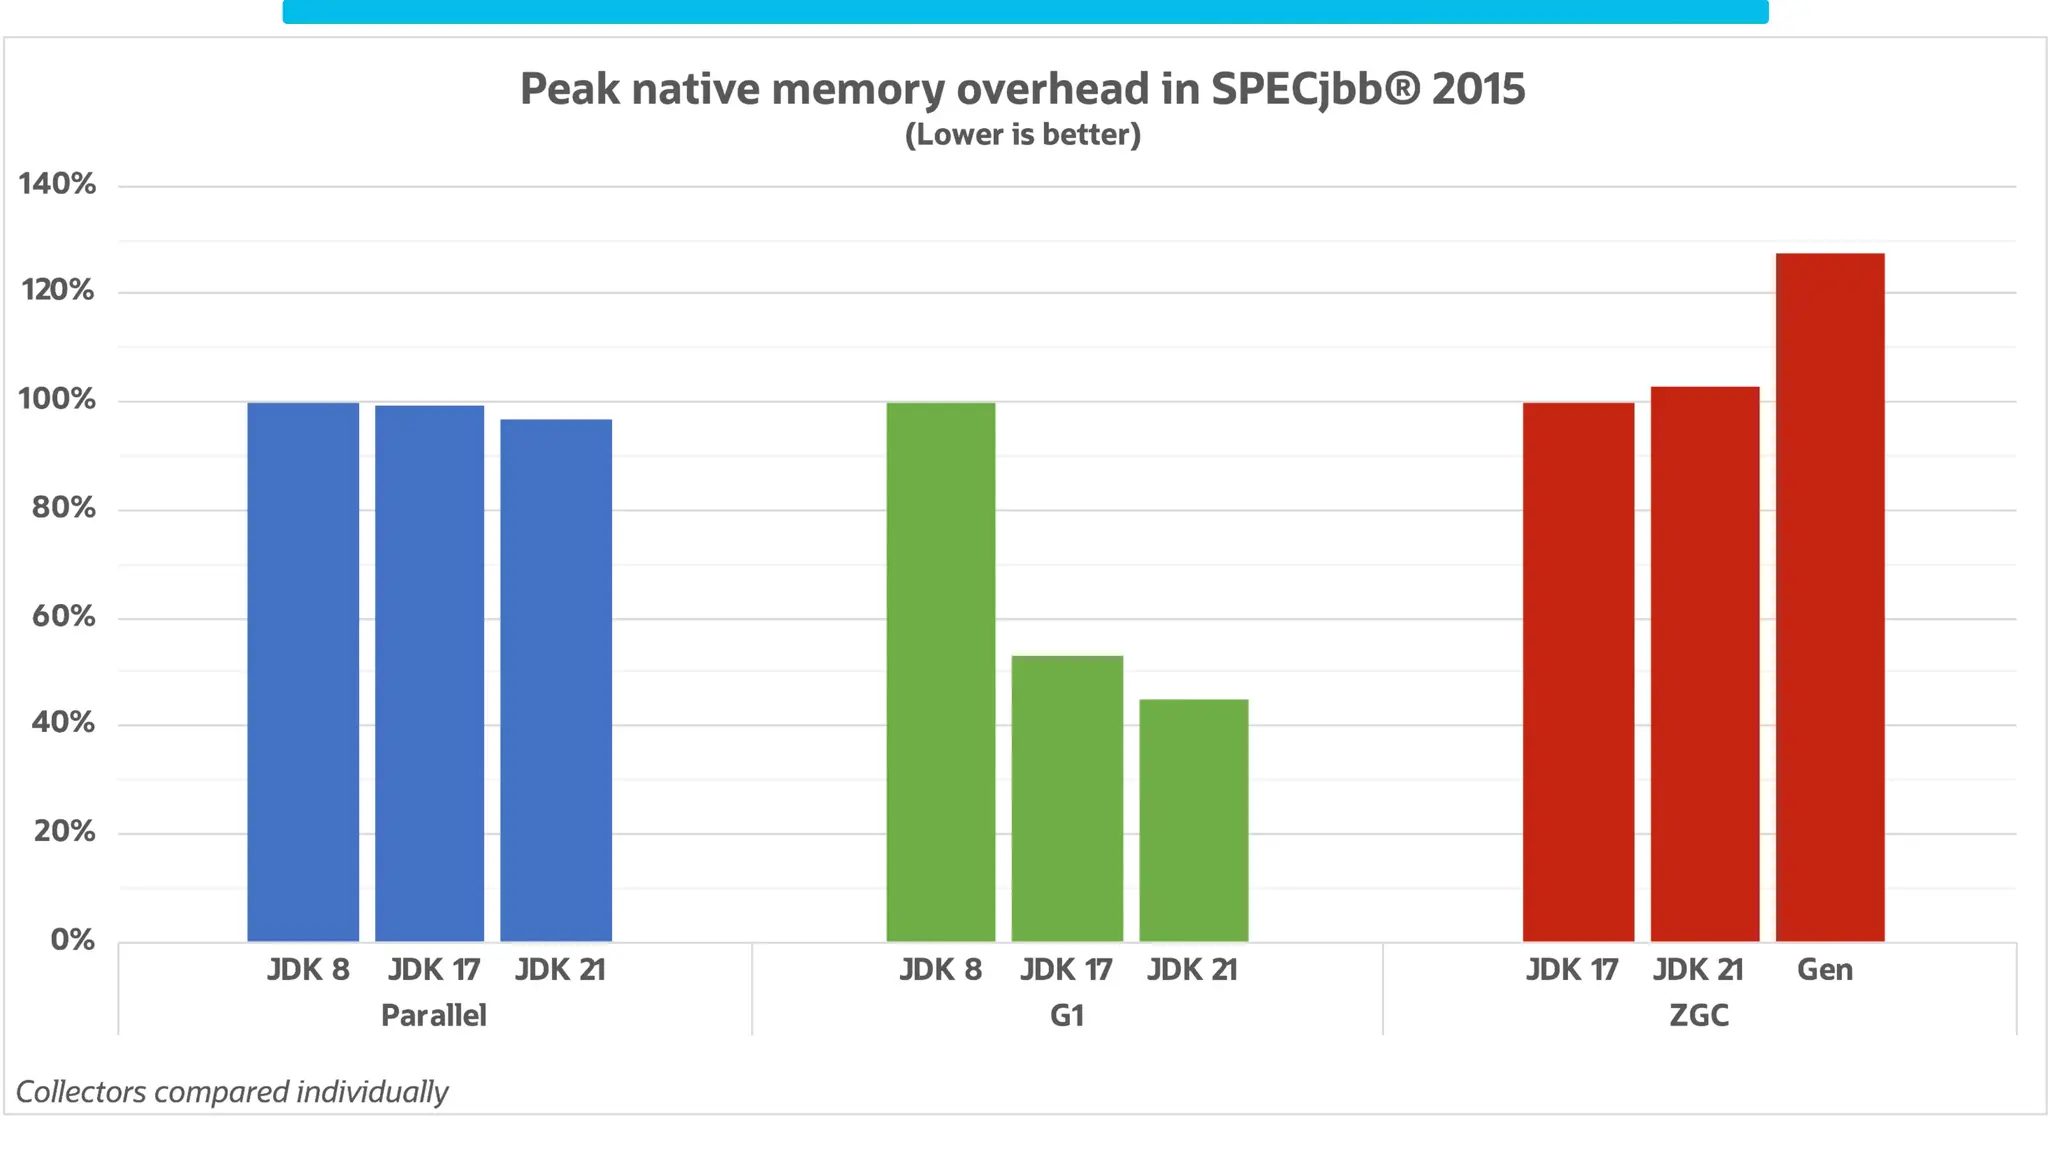
GC Algorithm Performance Comparison
Stefan Johanson, Oracle
Stefan’s Blog: https://kstefanj.github.io/
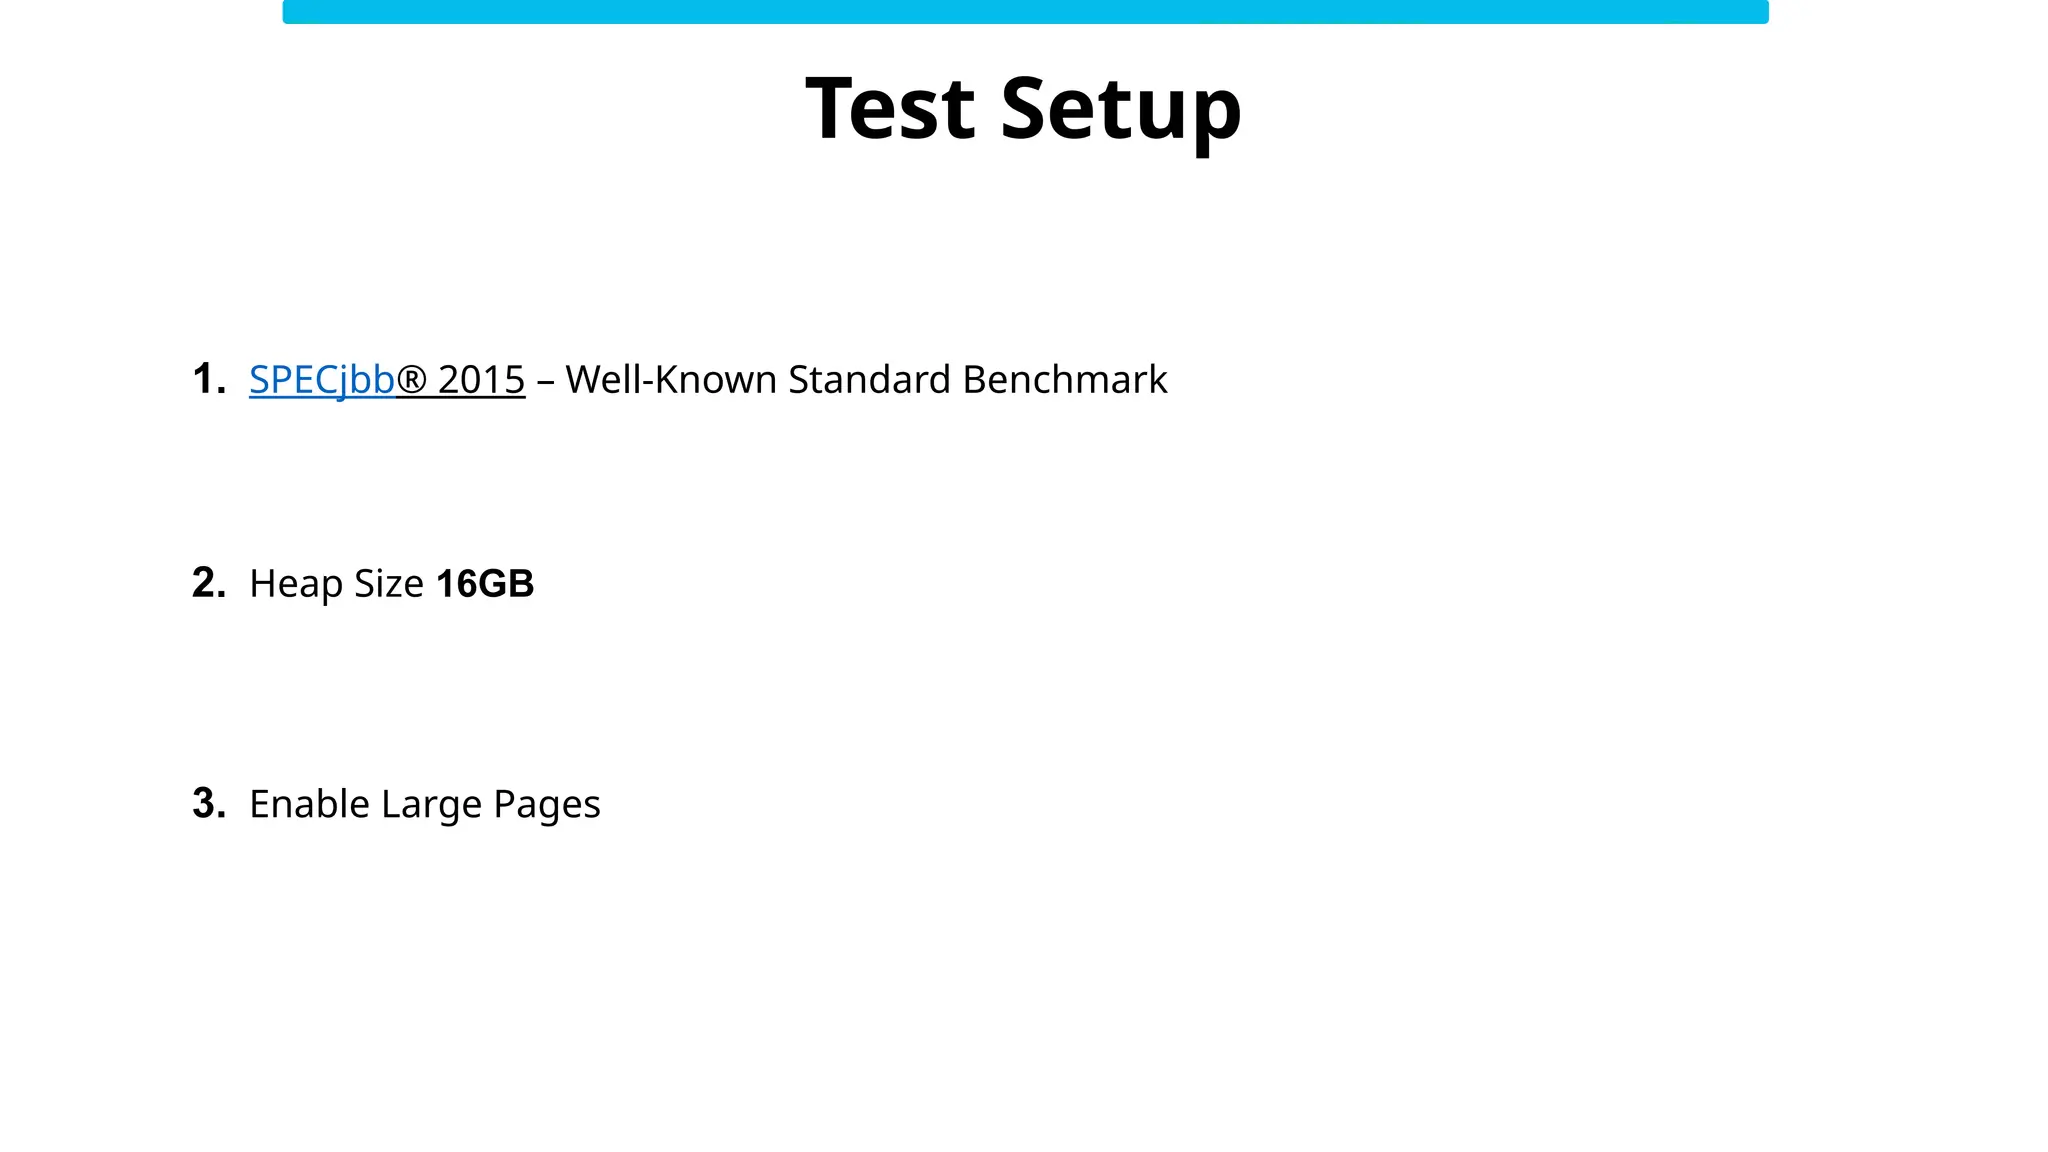
Test Setup
2. Heap Size 16GB
1. SPECjbb® 2015 – Well-Known Standard Benchmark
3. Enable Large Pages
How to find Right GC Algorithm for your Application?
Tools, Tips & Tricks
Key Performance Indicators
GC Event’s Pause Time
1. Latency
Percentage of time spent in processing
customer transactions vs time spent in GC
activity. i.e. productive work vs non-productive
work
2. Throughput
Memory, CPU, Response Time
3. Foot Print
99.994
%
Memory: 2GB
CPU Time: 1 hr
9min
You can't optimize, what you can't measure
1.2 secs
4. Key Metric
Key Metrics in any
Performance Exercise
17
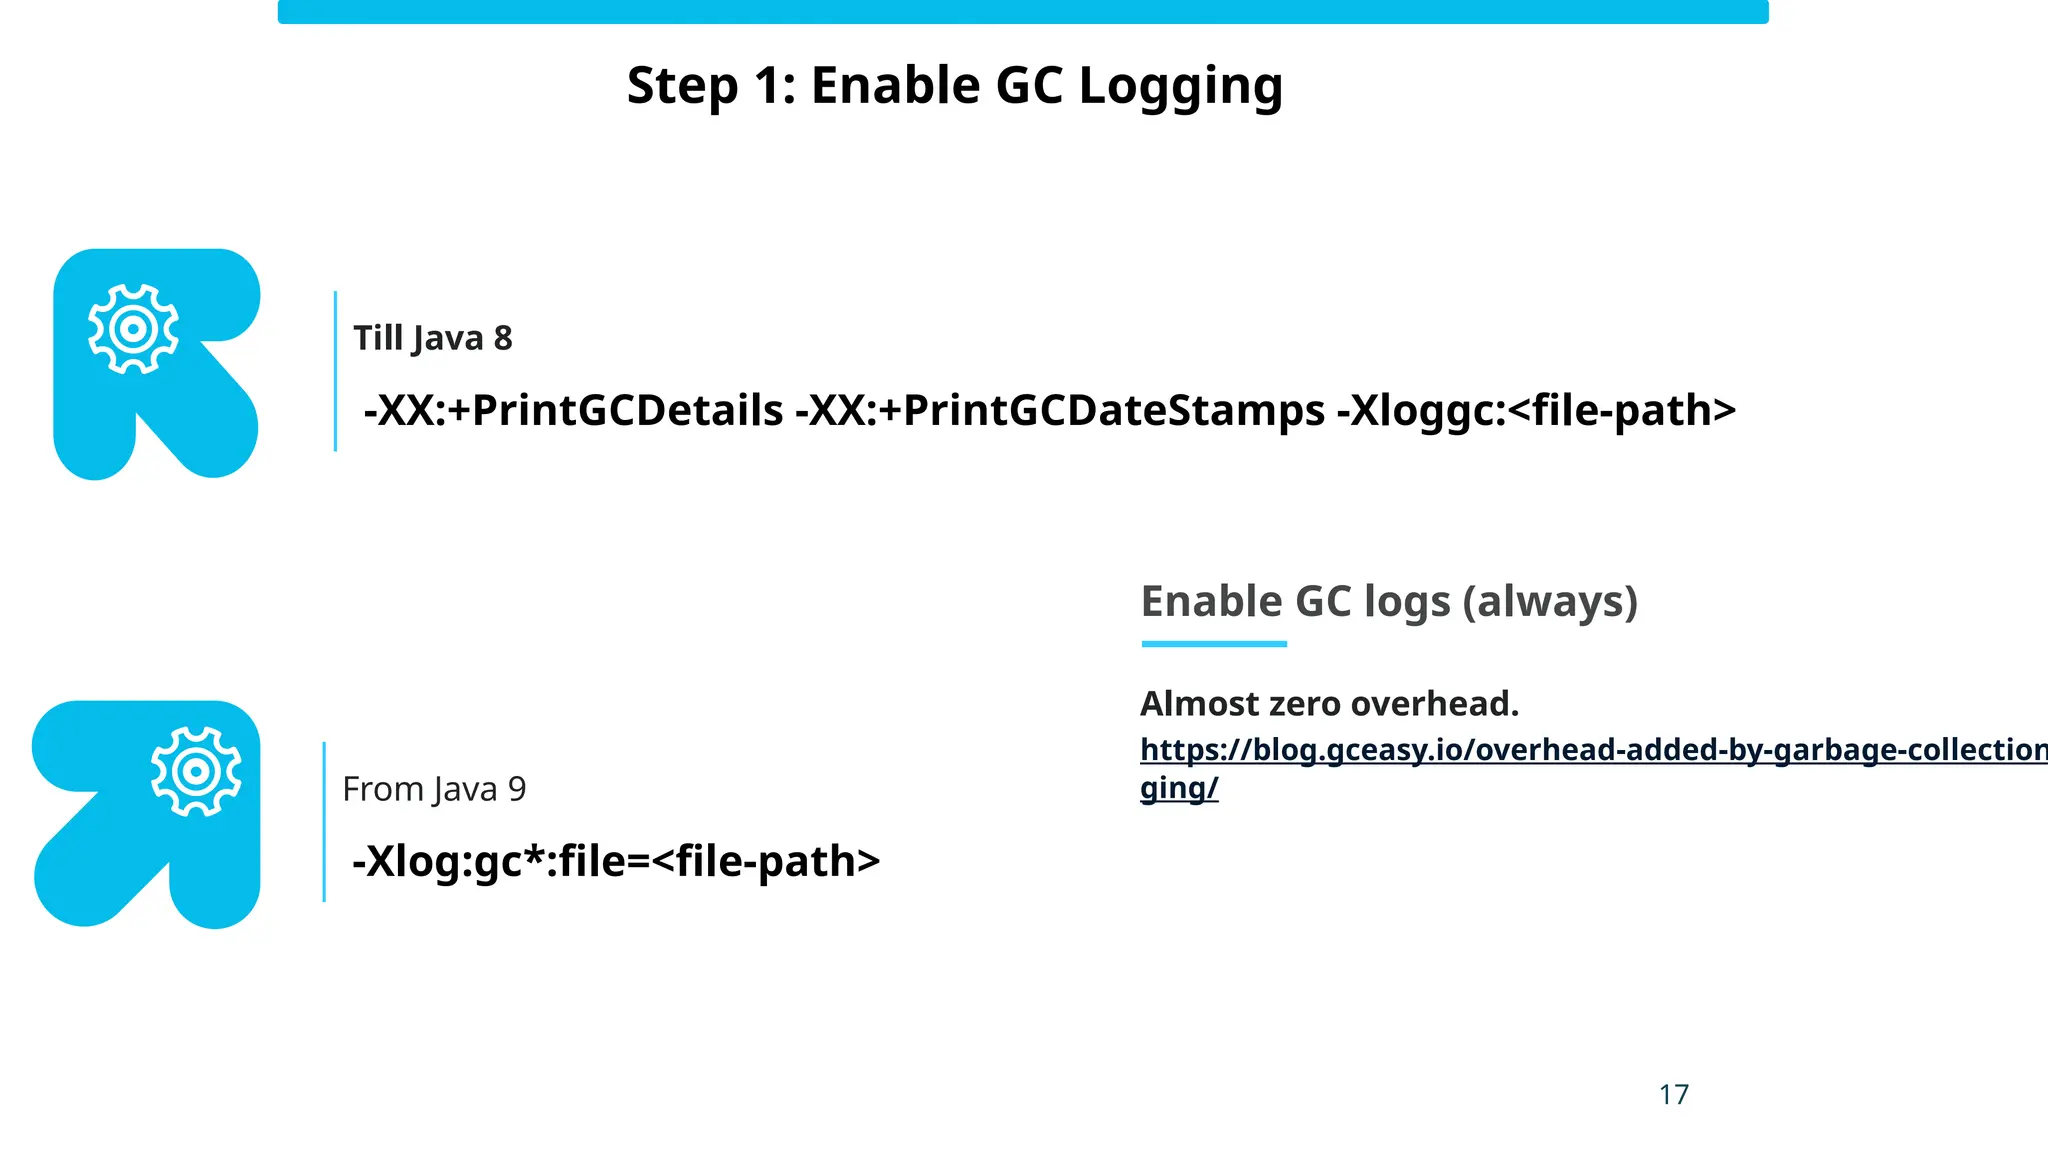
Step 1: Enable GC Logging
-XX:+PrintGCDetails -XX:+PrintGCDateStamps -Xloggc:<file-path>
Till Java 8
-Xlog:gc*:file=<file-path>
From Java 9
Enable GC logs (always)
Almost zero overhead.
https://blog.gceasy.io/overhead-added-by-garbage-collection
ging/
2019-08-31T01:09:19.397+0000: 1.606: [GC (Metadata GC Threshold) [PSYoungGen: 545393K->18495K(2446848K)] 545393K->18519K(8039424K),
0.0189376 secs] [Times: user=0.15 sys=0.01, real=0.02 secs]
2019-08-31T01:09:19.416+0000: 1.625: [Full GC (Metadata GC Threshold) [PSYoungGen: 18495K->0K(2446848K)] [ParOldGen: 24K->17366K(5592576K)]
18519K->17366K(8039424K), [Metaspace: 20781K->20781K(1067008K)], 0.0416162 secs] [Times: user=0.38 sys=0.03, real=0.04 secs]
2019-08-31T01:18:19.288+0000: 541.497: [GC (Metadata GC Threshold) [PSYoungGen: 1391495K->18847K(2446848K)] 1408861K->36230K(8039424K),
0.0568365 secs] [Times: user=0.31 sys=0.75, real=0.06 secs]
2019-08-31T01:18:19.345+0000: 541.554: [Full GC (Metadata GC Threshold) [PSYoungGen: 18847K->0K(2446848K)] [ParOldGen: 17382K-
>25397K(5592576K)] 36230K->25397K(8039424K), [Metaspace: 34865K->34865K(1079296K)], 0.0467640 secs] [Times: user=0.31 sys=0.08, real=0.04
secs]
2019-08-31T02:33:20.326+0000: 5042.536: [GC (Allocation Failure) [PSYoungGen: 2097664K->11337K(2446848K)] 2123061K->36742K(8039424K),
0.3298985 secs] [Times: user=0.00 sys=9.20, real=0.33 secs]
2019-08-31T03:40:11.749+0000: 9053.959: [GC (Allocation Failure) [PSYoungGen: 2109001K->15776K(2446848K)] 2134406K->41189K(8039424K),
0.0517517 secs] [Times: user=0.00 sys=1.22, real=0.05 secs]
2019-08-31T05:11:46.869+0000: 14549.079: [GC (Allocation Failure) [PSYoungGen: 2113440K->24832K(2446848K)] 2138853K->50253K(8039424K),
0.0392831 secs] [Times: user=0.02 sys=0.79, real=0.04 secs]
2019-08-31T06:26:10.376+0000: 19012.586: [GC (Allocation Failure) [PSYoungGen: 2122496K->25600K(2756096K)] 2147917K->58149K(8348672K),
0.0371416 secs] [Times: user=0.01 sys=0.75, real=0.04 secs]
2019-08-31T07:50:03.442+0000: 24045.652: [GC (Allocation Failure) [PSYoungGen: 2756096K->32768K(2763264K)] 2788645K->72397K(8355840K),
0.0709641 secs] [Times: user=0.16 sys=1.39, real=0.07 secs]
2019-08-31T09:04:21.406+0000: 28503.616: [GC (Allocation Failure) [PSYoungGen: 2763264K->32768K(2733568K)] 2802893K->83469K(8326144K),
0.0789178 secs] [Times: user=0.12 sys=1.59, real=0.08 secs]
Vanilla Format
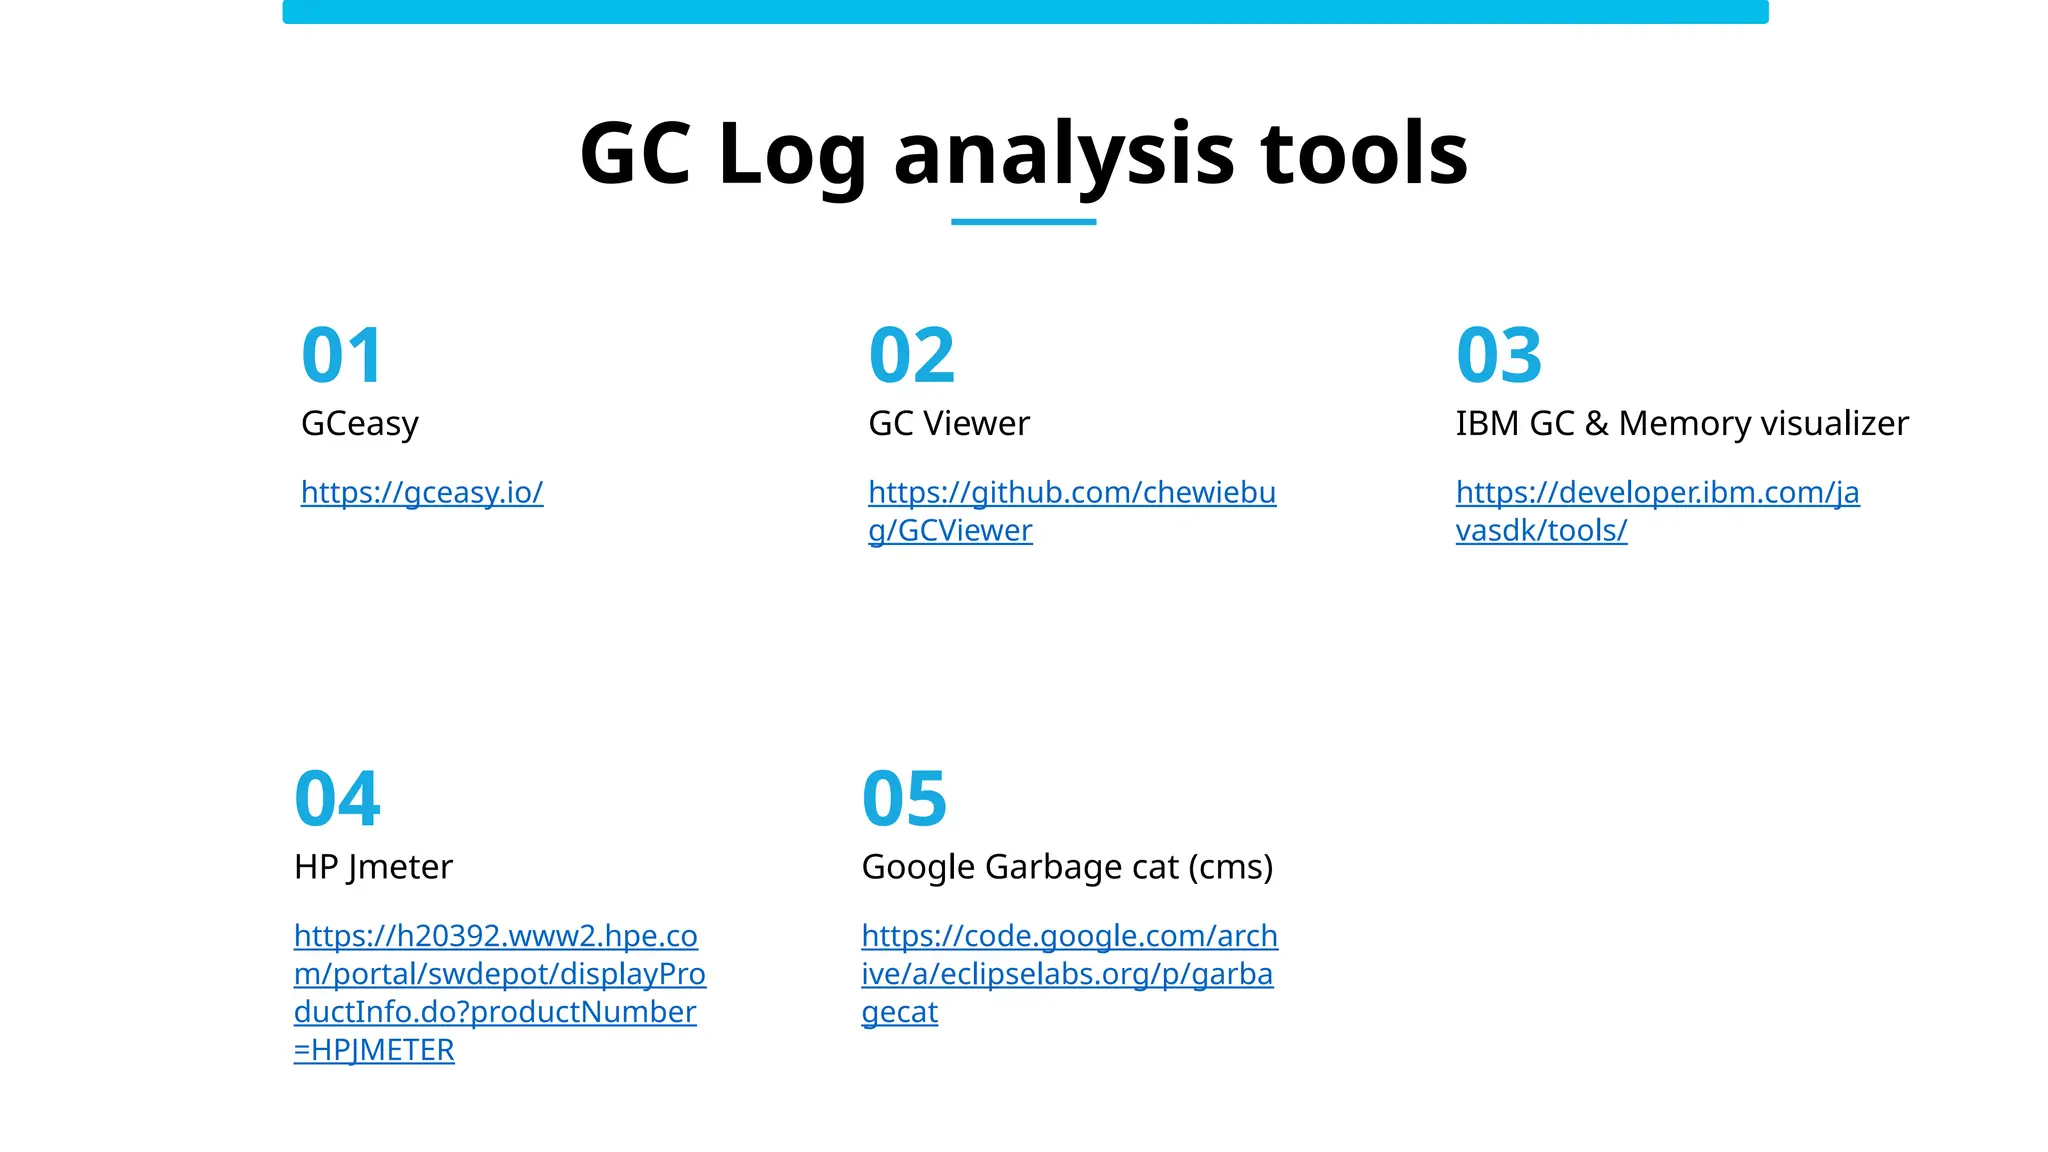
GC Log analysis tools
https://developer.ibm.com/ja
vasdk/tools/
IBM GC & Memory visualizer
GC Viewer
https://github.com/chewiebu
g/GCViewer
GCeasy
https://gceasy.io/
Google Garbage cat (cms)
https://code.google.com/arch
ive/a/eclipselabs.org/p/garba
gecat
HP Jmeter
https://h20392.www2.hpe.co
m/portal/swdepot/displayPro
ductInfo.do?productNumber
=HPJMETER
03
02
01
05
04
https://tinyurl.com/mw4kak4a
GC Tuning Worksheet
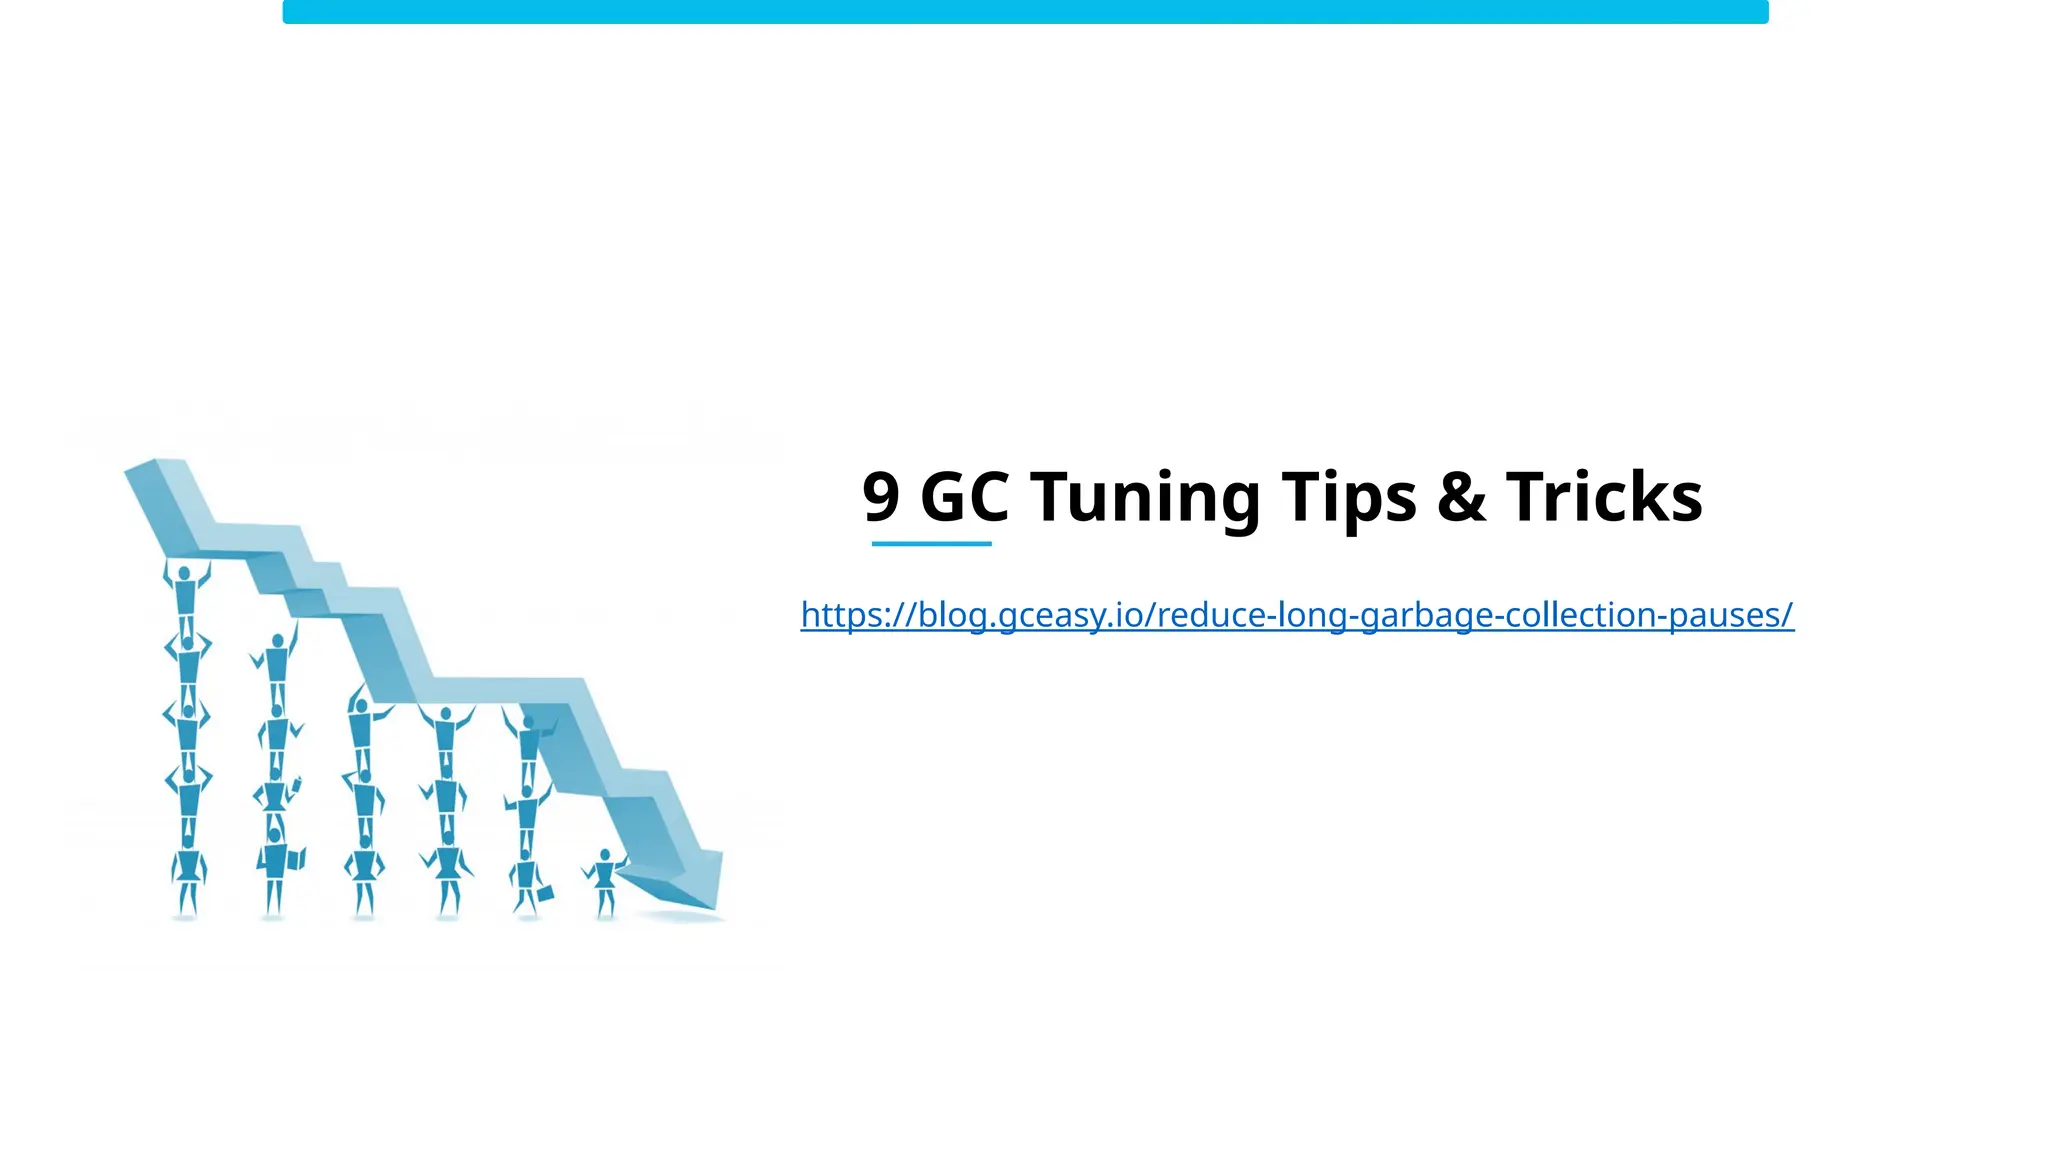
9 GC Tuning Tips & Tricks
https://blog.gceasy.io/reduce-long-garbage-collection-pauses/
https://blog.gceasy.io/automobile-company-optimizes-performance-using-gceasy/
Real case study: GC Performance of a one of the Largest Car Maker
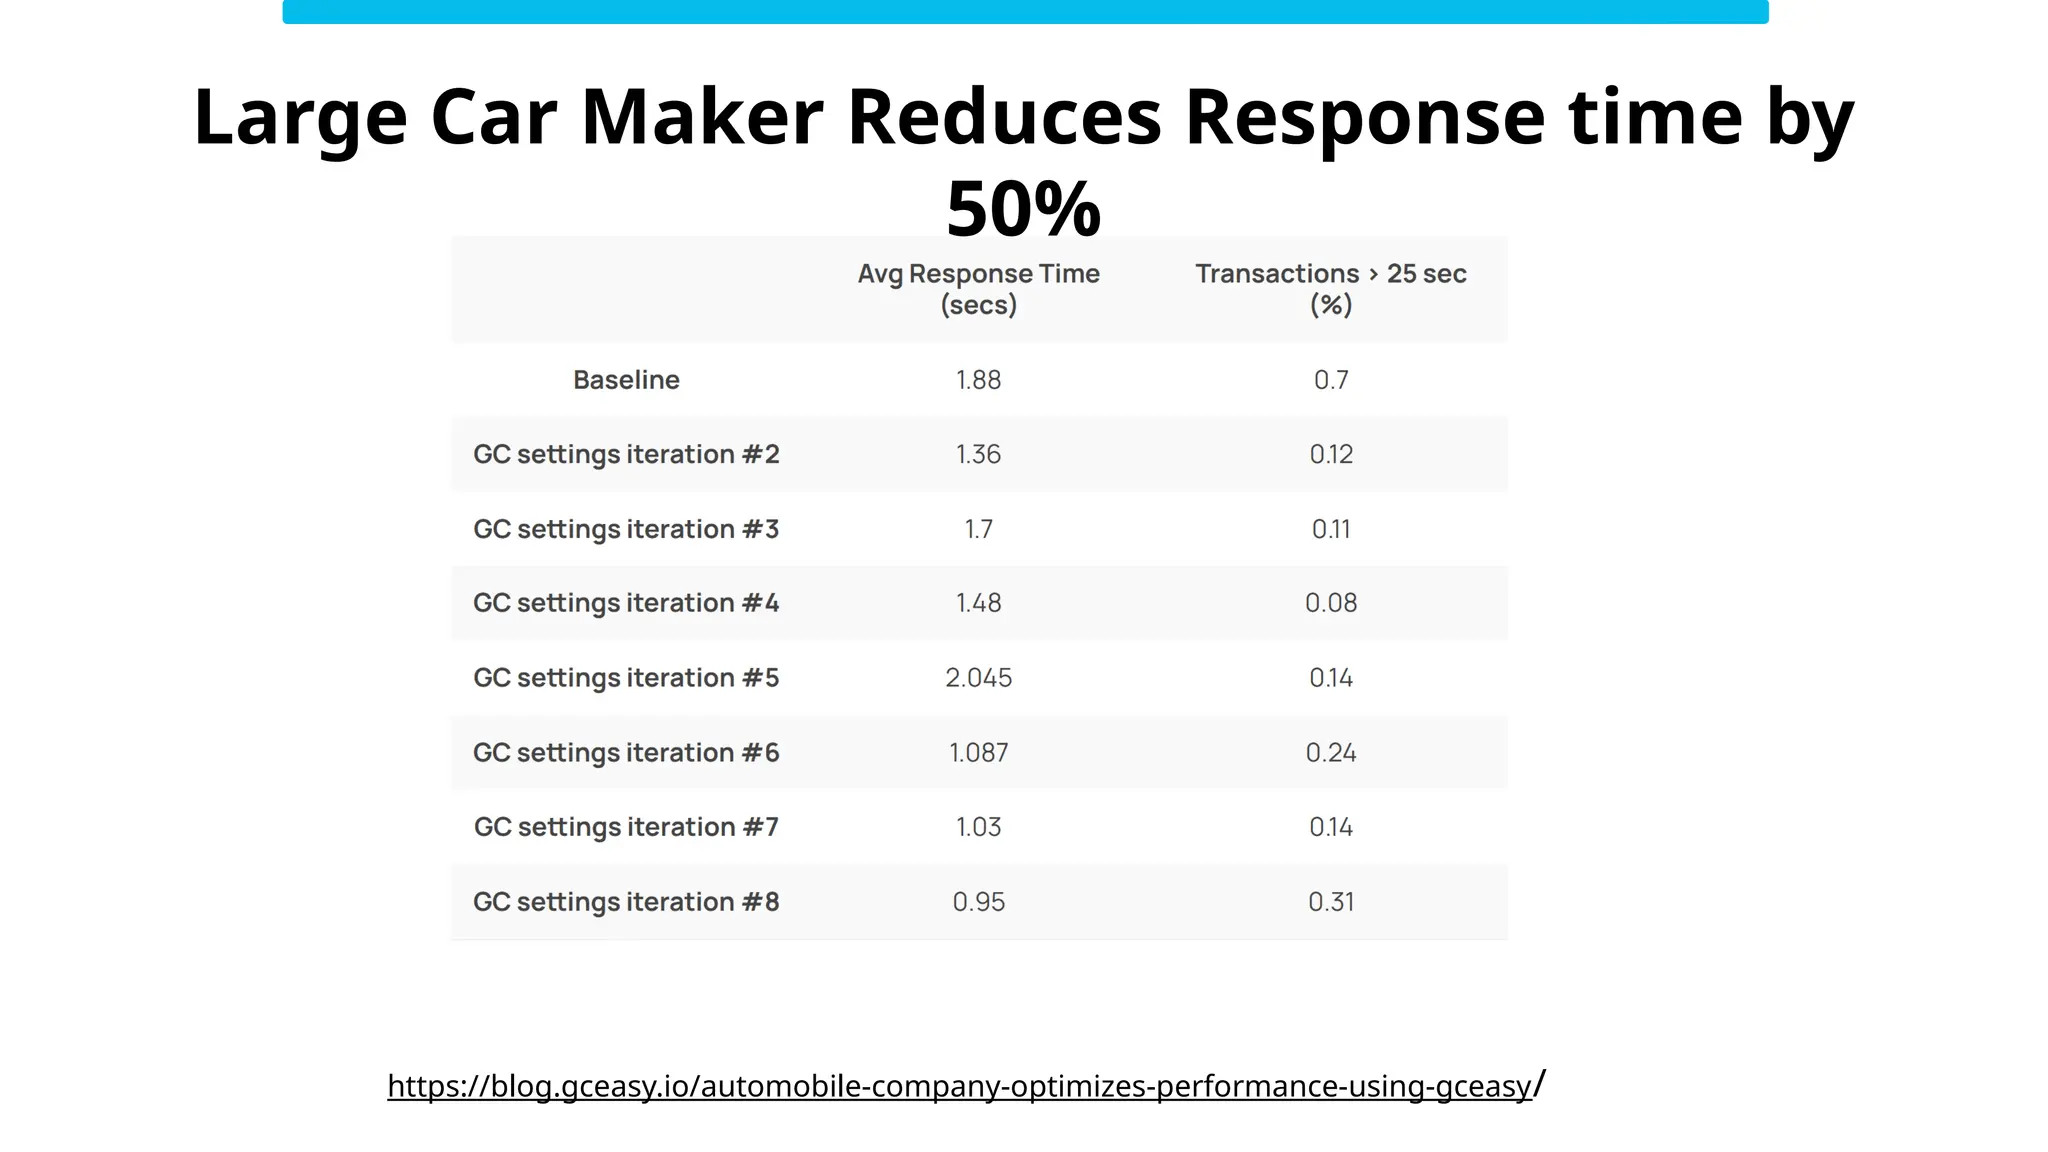
Large Car Maker Reduces Response time by
50%
https://blog.gceasy.io/automobile-company-optimizes-performance-using-gceasy/
Real case study: Warehouse Robotics App Poor Performance
https://blog.gceasy.io/2024/02/21/optimizing-robotics-applications-performance/
GC Tuning
How We Saved 70K Cores Across 30 Mission-Critical Services?
https://www.uber.com/en-IN/blog/how-we-saved-70k-cores-across-30-mission-critical-services/
More GC Tuning case studies
Uber Saves Millions of $
https://blog.gceasy.io/2022/03/04/garbage-collection-tuning-success-story-reducing-young-gen-siz
e/
Large Automobile Manufacturer Improves Response Time
https://blog.gceasy.io/2022/03/04/garbage-collection-tuning-success-story-reducing-young-gen-siz
e/
CloudBees (Jenkins Parent company) optimizes
https://blog.gceasy.io/2019/08/01/cloudbees-gc-performance-optimized-with-gceasy/
Oracle optimizes App performance by tuning GC
https://blog.gceasy.io/2022/12/06/oracle-architect-optimizes-performance-using-gceasy/
27
Thank you my friends!
Ram Lakshmanan
@ycrash_rca
This deck will be published in: https://blog.gceasy.io
https://www.linkedin.com/company/ycrash

Matchmaking for JVMs: How to Pick the Perfect GC Partner

  • 2.
    Choosing a GCAlgorithm = Choosing a Life Partner Coexist In The Same Roof (JVM) GC Cleans Up The Mess Your App Creates Aggressive App, Aggressive GC Competing For The Same Resources (CPU Cycles)
  • 3.
    What is Garbage? HTTPRequest Objects Memory Garbage
  • 4.
    3 - 4Decades ago Developer Writes code to Manually evict Garbage JVM Automatically evicts Garbage Now How are objects Garbage Collected? Evolution: Manual -> Automatic
  • 5.
    Automatic GC soundsgood right? Yes, but for GC pauses CPU consumption
  • 6.
    Key Performance Indicators GCEvent’s Pause Time 1. Latency Percentage of time spent in processing customer transactions vs time spent in GC activity. i.e. productive work vs non-productive work 2. Throughput Memory, CPU, Response Time 3. Foot Print 99.994 % Memory: 2GB CPU Time: 1 hr 9min You can't optimize, what you can't measure 1.2 secs 4. Key Metric Key Metrics in any Performance Exercise
  • 7.
    What is yourGoal? 2. High Throughput 1. Low Pause Time 3. Footprint Example: Online trading application - A 100 ms GC pause could delay stock trades, leading to financial loss. Here the priority is predictability & ultra-low latency. Example: Batch data processing system – A Hadoop/Spark job crunching terabytes overnight. Occasional pauses don’t matter, but finishing the job faster (higher throughput) reduces infrastructure cost. Example: Microservice running in Kubernetes – Each pod is allocated a tight memory budget (say 512 MB). Optimizing GC for low memory footprint allows higher pod density and lowers the overall cloud bill.
  • 8.
  • 9.
    GC Algorithm PerformanceComparison Stefan Johanson, Oracle Stefan’s Blog: https://kstefanj.github.io/
  • 10.
    Test Setup 2. HeapSize 16GB 1. SPECjbb® 2015 – Well-Known Standard Benchmark 3. Enable Large Pages
  • 15.
    How to findRight GC Algorithm for your Application? Tools, Tips & Tricks
  • 16.
    Key Performance Indicators GCEvent’s Pause Time 1. Latency Percentage of time spent in processing customer transactions vs time spent in GC activity. i.e. productive work vs non-productive work 2. Throughput Memory, CPU, Response Time 3. Foot Print 99.994 % Memory: 2GB CPU Time: 1 hr 9min You can't optimize, what you can't measure 1.2 secs 4. Key Metric Key Metrics in any Performance Exercise
  • 17.
    17 Step 1: EnableGC Logging -XX:+PrintGCDetails -XX:+PrintGCDateStamps -Xloggc:<file-path> Till Java 8 -Xlog:gc*:file=<file-path> From Java 9 Enable GC logs (always) Almost zero overhead. https://blog.gceasy.io/overhead-added-by-garbage-collection ging/
  • 18.
    2019-08-31T01:09:19.397+0000: 1.606: [GC(Metadata GC Threshold) [PSYoungGen: 545393K->18495K(2446848K)] 545393K->18519K(8039424K), 0.0189376 secs] [Times: user=0.15 sys=0.01, real=0.02 secs] 2019-08-31T01:09:19.416+0000: 1.625: [Full GC (Metadata GC Threshold) [PSYoungGen: 18495K->0K(2446848K)] [ParOldGen: 24K->17366K(5592576K)] 18519K->17366K(8039424K), [Metaspace: 20781K->20781K(1067008K)], 0.0416162 secs] [Times: user=0.38 sys=0.03, real=0.04 secs] 2019-08-31T01:18:19.288+0000: 541.497: [GC (Metadata GC Threshold) [PSYoungGen: 1391495K->18847K(2446848K)] 1408861K->36230K(8039424K), 0.0568365 secs] [Times: user=0.31 sys=0.75, real=0.06 secs] 2019-08-31T01:18:19.345+0000: 541.554: [Full GC (Metadata GC Threshold) [PSYoungGen: 18847K->0K(2446848K)] [ParOldGen: 17382K- >25397K(5592576K)] 36230K->25397K(8039424K), [Metaspace: 34865K->34865K(1079296K)], 0.0467640 secs] [Times: user=0.31 sys=0.08, real=0.04 secs] 2019-08-31T02:33:20.326+0000: 5042.536: [GC (Allocation Failure) [PSYoungGen: 2097664K->11337K(2446848K)] 2123061K->36742K(8039424K), 0.3298985 secs] [Times: user=0.00 sys=9.20, real=0.33 secs] 2019-08-31T03:40:11.749+0000: 9053.959: [GC (Allocation Failure) [PSYoungGen: 2109001K->15776K(2446848K)] 2134406K->41189K(8039424K), 0.0517517 secs] [Times: user=0.00 sys=1.22, real=0.05 secs] 2019-08-31T05:11:46.869+0000: 14549.079: [GC (Allocation Failure) [PSYoungGen: 2113440K->24832K(2446848K)] 2138853K->50253K(8039424K), 0.0392831 secs] [Times: user=0.02 sys=0.79, real=0.04 secs] 2019-08-31T06:26:10.376+0000: 19012.586: [GC (Allocation Failure) [PSYoungGen: 2122496K->25600K(2756096K)] 2147917K->58149K(8348672K), 0.0371416 secs] [Times: user=0.01 sys=0.75, real=0.04 secs] 2019-08-31T07:50:03.442+0000: 24045.652: [GC (Allocation Failure) [PSYoungGen: 2756096K->32768K(2763264K)] 2788645K->72397K(8355840K), 0.0709641 secs] [Times: user=0.16 sys=1.39, real=0.07 secs] 2019-08-31T09:04:21.406+0000: 28503.616: [GC (Allocation Failure) [PSYoungGen: 2763264K->32768K(2733568K)] 2802893K->83469K(8326144K), 0.0789178 secs] [Times: user=0.12 sys=1.59, real=0.08 secs] Vanilla Format
  • 19.
    GC Log analysistools https://developer.ibm.com/ja vasdk/tools/ IBM GC & Memory visualizer GC Viewer https://github.com/chewiebu g/GCViewer GCeasy https://gceasy.io/ Google Garbage cat (cms) https://code.google.com/arch ive/a/eclipselabs.org/p/garba gecat HP Jmeter https://h20392.www2.hpe.co m/portal/swdepot/displayPro ductInfo.do?productNumber =HPJMETER 03 02 01 05 04
  • 20.
  • 21.
    9 GC TuningTips & Tricks https://blog.gceasy.io/reduce-long-garbage-collection-pauses/
  • 22.
  • 23.
    Large Car MakerReduces Response time by 50% https://blog.gceasy.io/automobile-company-optimizes-performance-using-gceasy/
  • 24.
    Real case study:Warehouse Robotics App Poor Performance https://blog.gceasy.io/2024/02/21/optimizing-robotics-applications-performance/
  • 25.
    GC Tuning How WeSaved 70K Cores Across 30 Mission-Critical Services? https://www.uber.com/en-IN/blog/how-we-saved-70k-cores-across-30-mission-critical-services/
  • 26.
    More GC Tuningcase studies Uber Saves Millions of $ https://blog.gceasy.io/2022/03/04/garbage-collection-tuning-success-story-reducing-young-gen-siz e/ Large Automobile Manufacturer Improves Response Time https://blog.gceasy.io/2022/03/04/garbage-collection-tuning-success-story-reducing-young-gen-siz e/ CloudBees (Jenkins Parent company) optimizes https://blog.gceasy.io/2019/08/01/cloudbees-gc-performance-optimized-with-gceasy/ Oracle optimizes App performance by tuning GC https://blog.gceasy.io/2022/12/06/oracle-architect-optimizes-performance-using-gceasy/
  • 27.
  • 28.
    Thank you myfriends! Ram Lakshmanan @ycrash_rca This deck will be published in: https://blog.gceasy.io https://www.linkedin.com/company/ycrash
Editor's Notes

  • #19 Demo: GCeasy - C:\workspace\speeches\9-types-oom\gc-memory-leak.zip
  • #20 https://docs.google.com/spreadsheets/d/1EEfqs0rfEQR2MsfwpX_f_1vgyx75HKdm/edit?gid=540467667#gid=540467667
  • #22 https://gceasy.io/my-gc-report.jsp?p=c2hhcmVkLzIwMjEvMDQvOC8tLWdjLTIwMjEtMDQtMDZfMjAtMTgtNTRfbm9kZTYxLmxvZy0tMTUtMjgtMw==&s=t&channel=WEB&s=t Baseline: http://localhost:8080/yc-report.jsp?ou=SAP&de=192.168.56.170&app=yc&ts=2024-04-21T11-43-54 Benchmark: http://localhost:8080/yc-report.jsp?ou=SAP&de=192.168.56.170&app=yc&ts=2024-04-21T11-45-24
  • #24 CMS GC: https://gceasy.io/my-gc-report.jsp?p=c2hhcmVkLzIwMjQvMDIvNi9nYy4yMDIzMTIxNC5sb2ctLTIzLTU5LTY=&channel=WEB&s=t G1 GC: https://gceasy.io/my-gc-report.jsp?p=c2hhcmVkLzIwMjMvMTIvMjEvZ2MubG9nLS01LTIxLTU0&channel=WEB&s=t