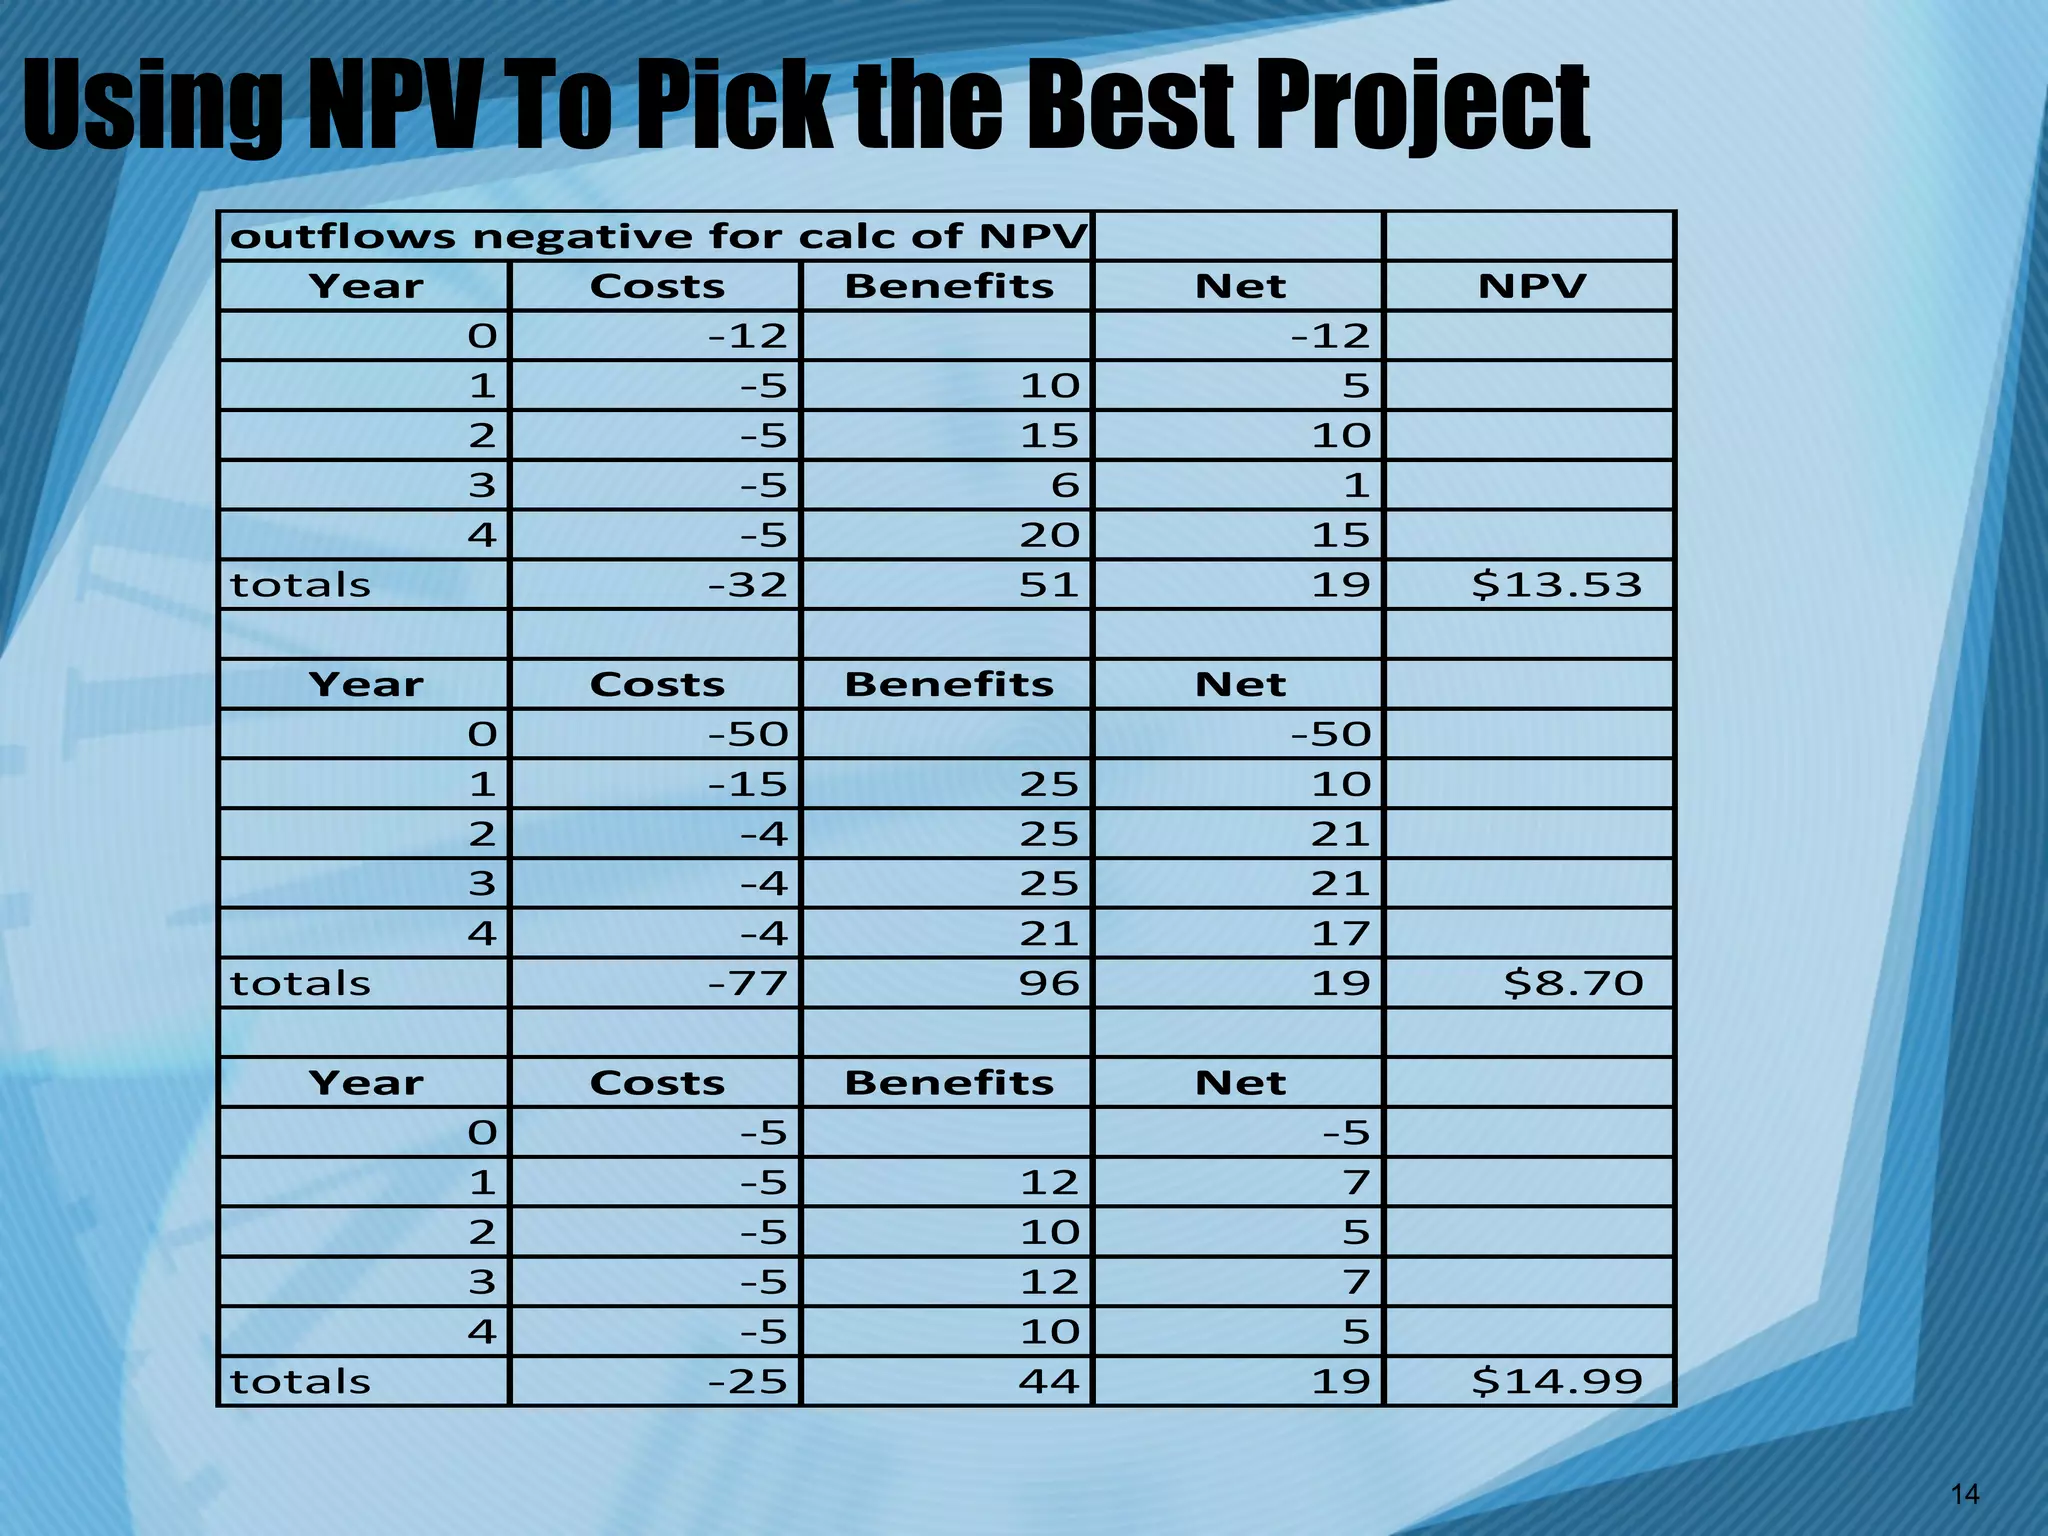
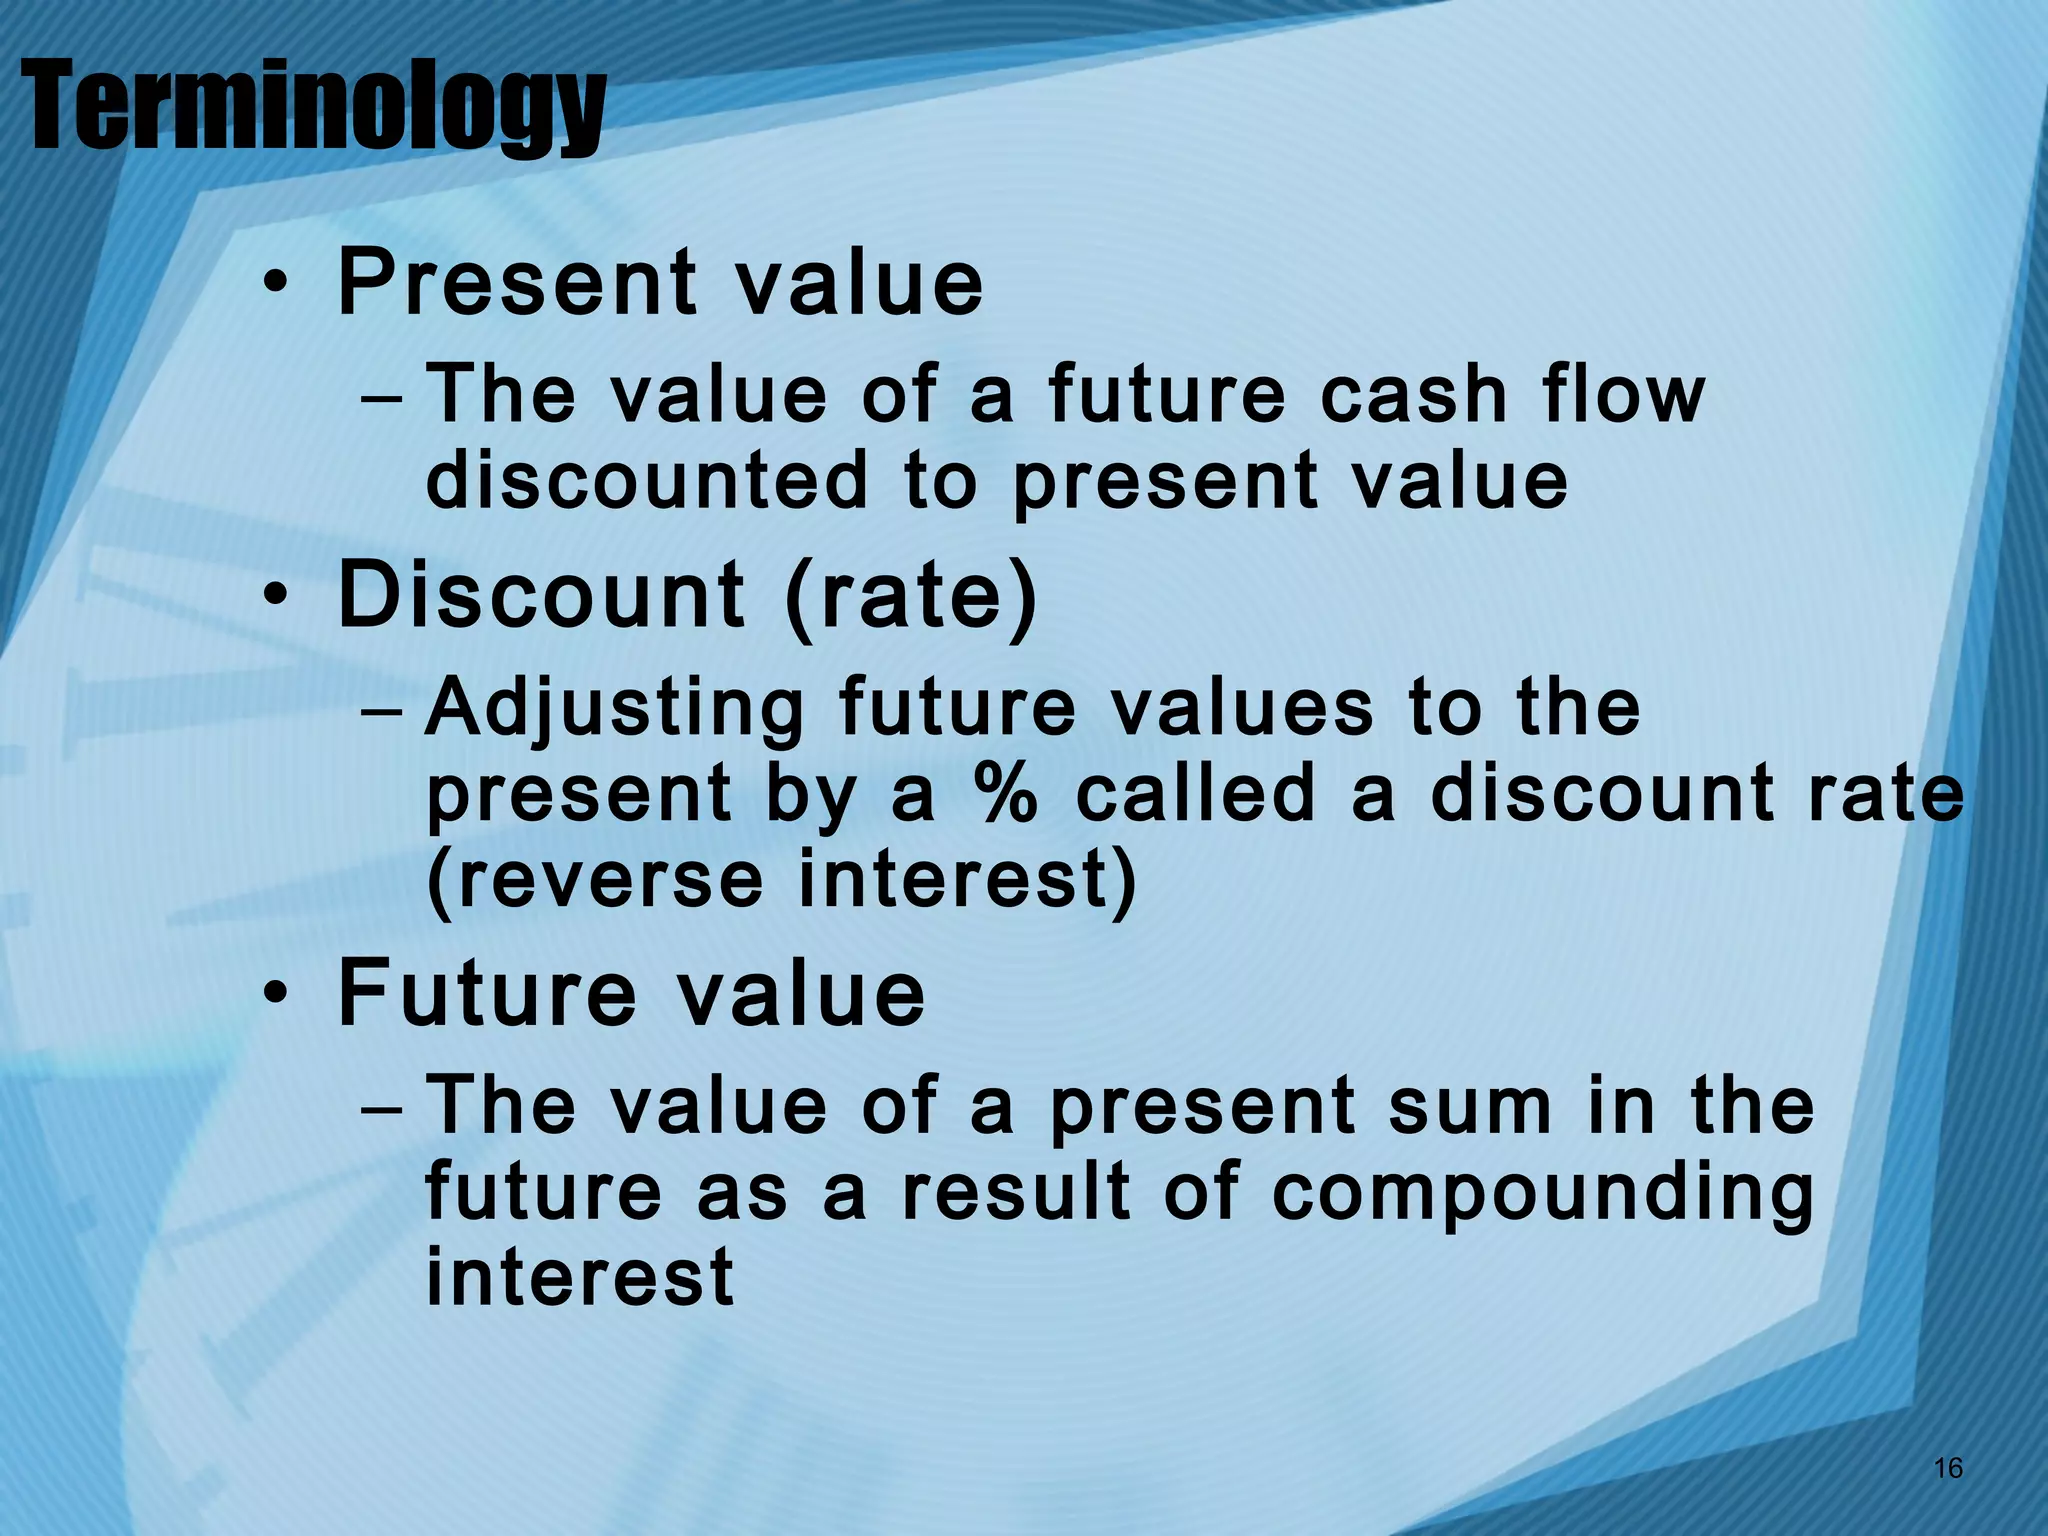
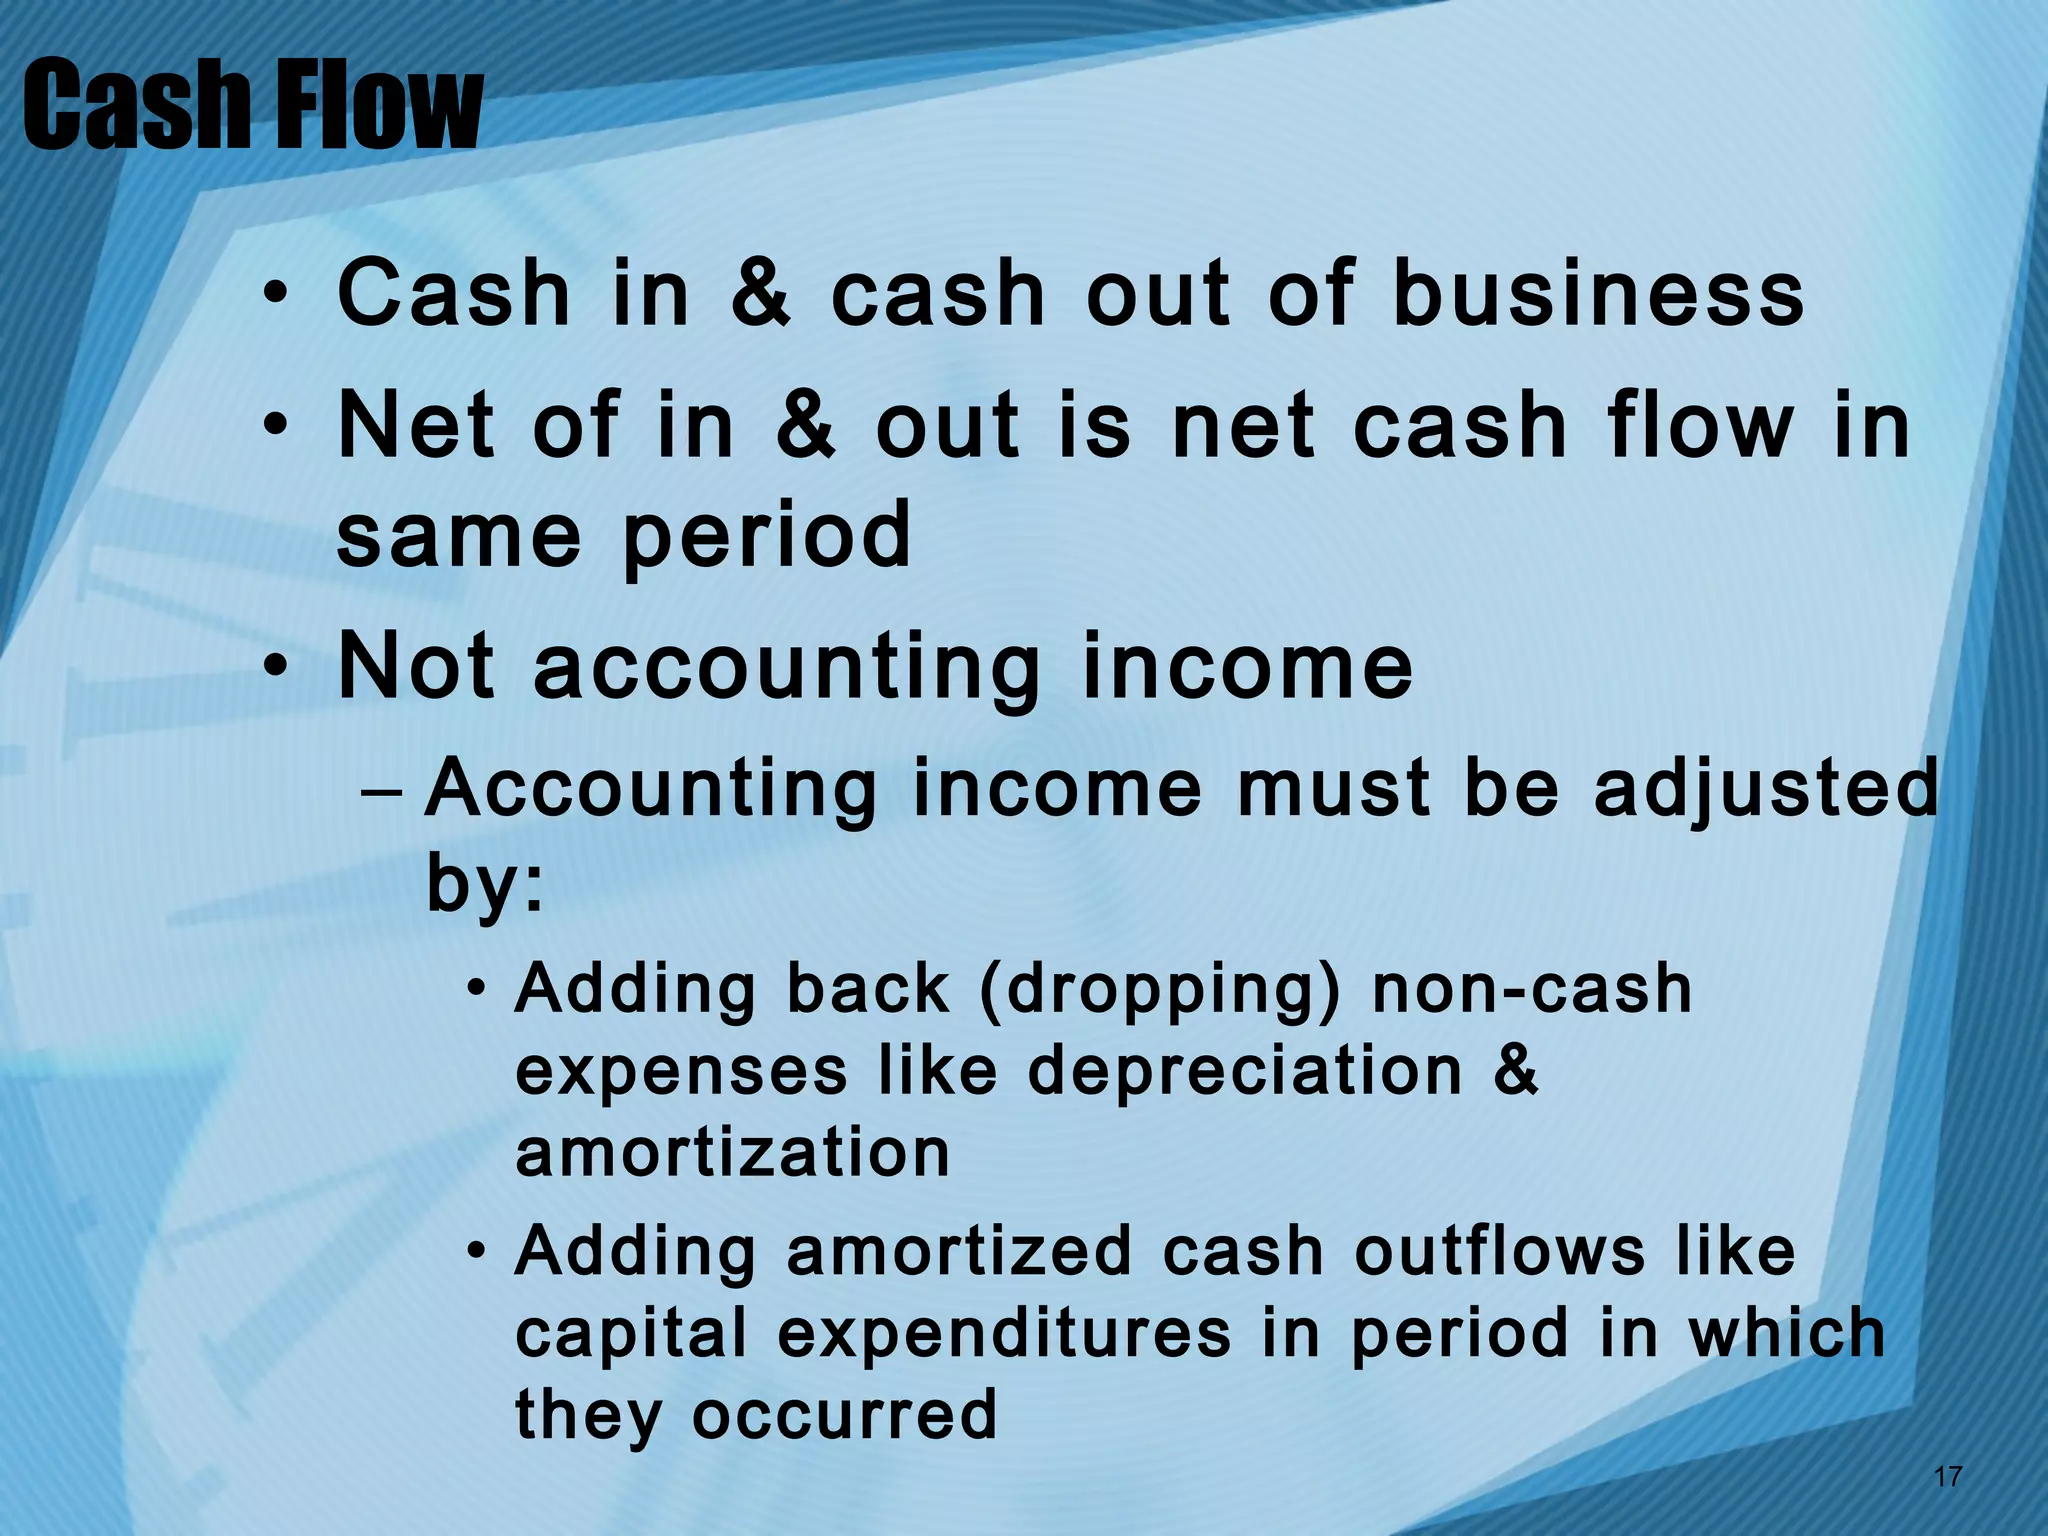
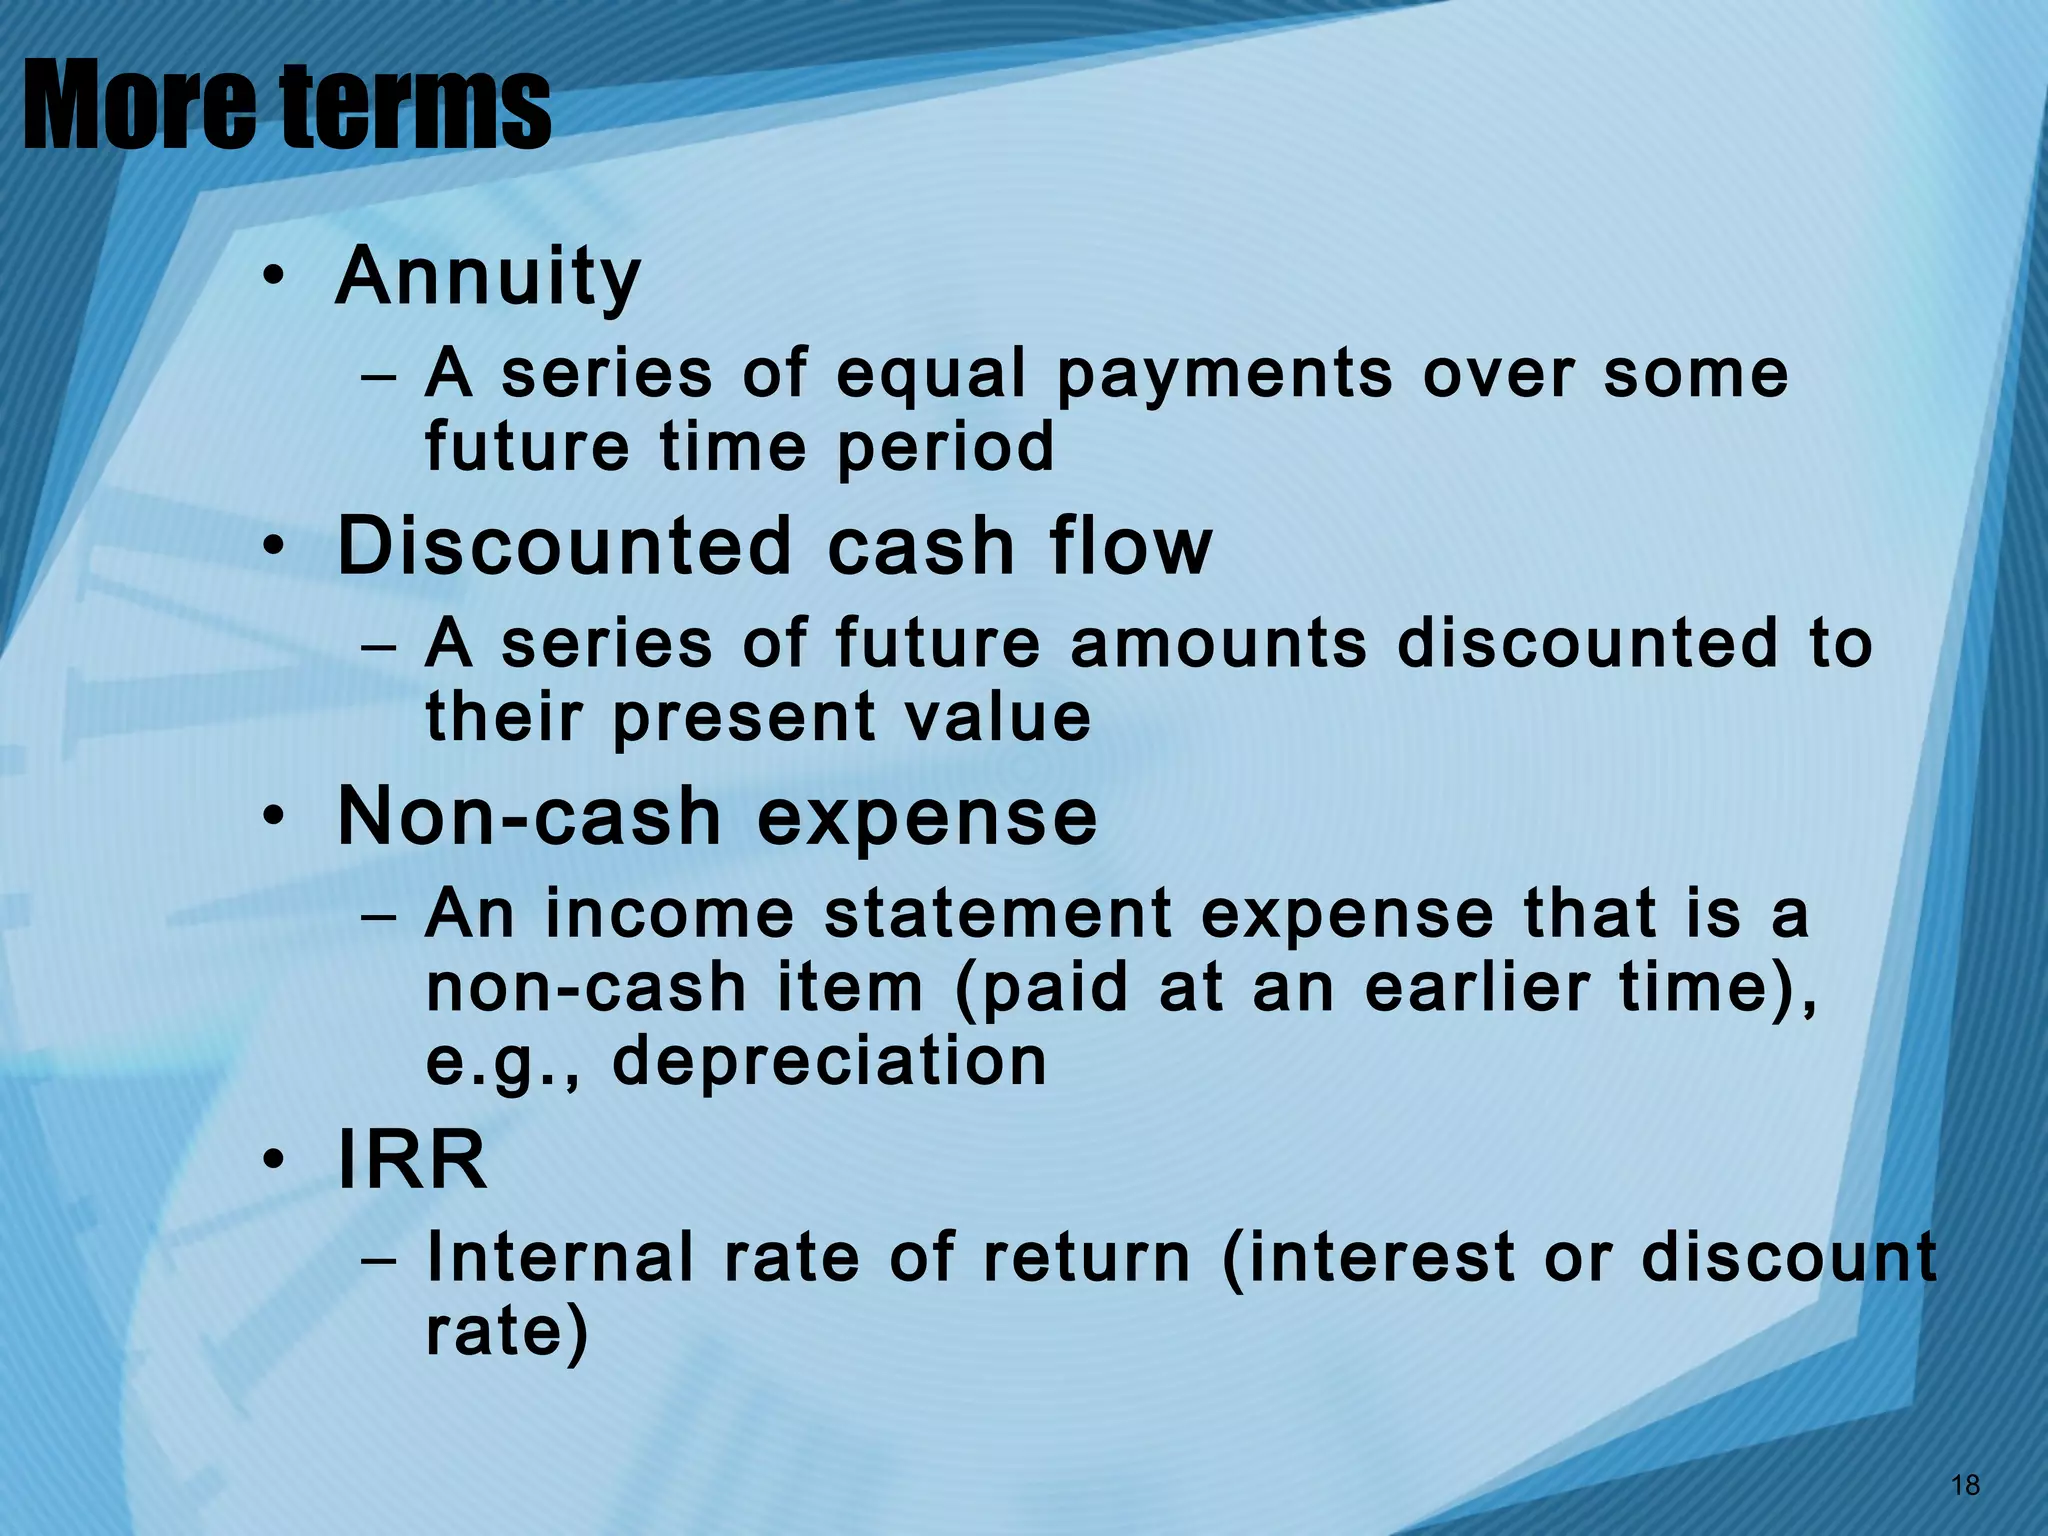
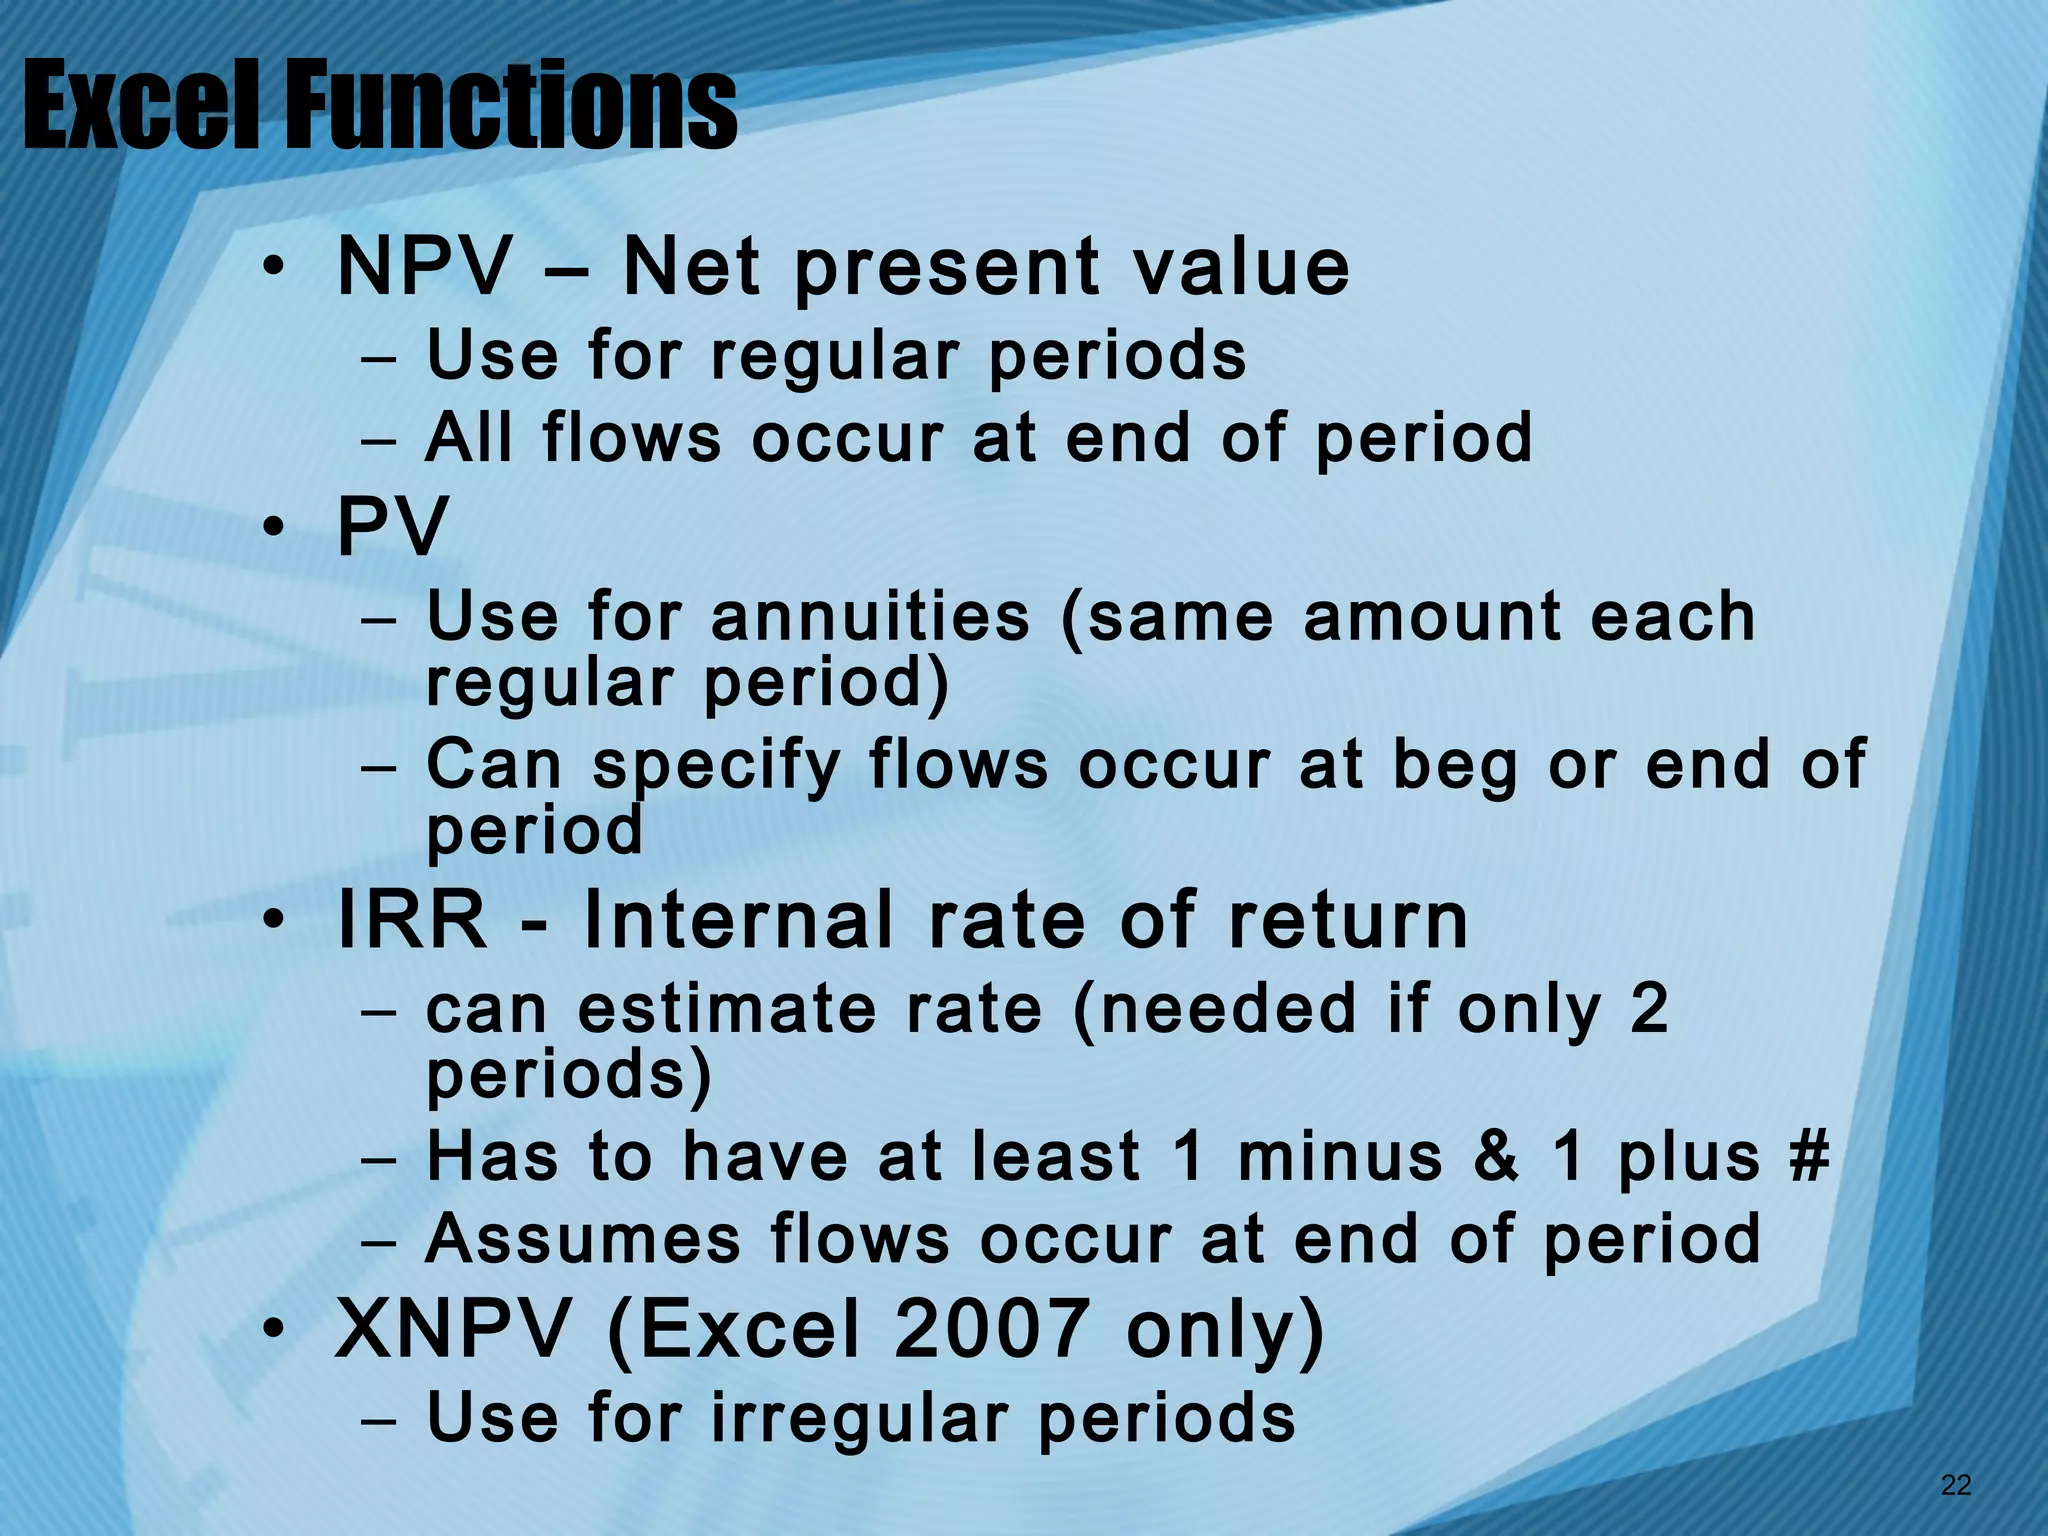
Time Value of Money
Important to Project Finance
Why Time Value of Money Is Important
in Project Mgmt
 • If we can’t fund all the projects,
   we need a way to compare, rank
   & choose
 • Which is the best project?
Best Way to Evaluate & Choose I.T. Projects
     • How well does this project align
       with the company’s strategic plan
       & goals?
Strategic Planning
    • Corp asks:
       – Where are we? (status)
       – Where are we going? (goals)
       – How do we get there (tactical
         planning)
    • Try to Identify:
       –   Corp   strengths
       –   Corp   weaknesses
       –   Corp   opportunities
       –   Corp   threats
Ways to Compare, Rank & Choose Projects
         • Focus on broad organizational
           needs
         • Categorize information technology
           projects
         • Use a weighted scoring model
         • Implement a balanced scorecard
         • Perform net present value or
           other financial analyses
   from Schwalbe, IT Project Mgmt, 6th edition
Focus on Broad Organizational Needs

         • Is there a need?
         • Are funds available?
         • Is there a strong will (or a strong
           mgr) to make the project
           succeed?


   from Schwalbe, IT Project Mgmt, 6th edition
Categorize I.T. Projects
        • Does the project address
               • A problem?
               • An opportunity?
               • A directive?


   from Schwalbe, IT Project Mgmt, 6th edition
Use a Weighted Scoring Model
         • identify criteria important to
           project success
         • assign weights to each
         • assign scores to each criterion for
           each project
         • multiply scores by weights to get
           total weighted scores
         • rank projects according to total
           weighted scores
   from Schwalbe, IT Project Mgmt, 6th edition
Implement a Balanced Scorecard
        • convert an organization’s value
          drivers, such as
               •   customer service
               •   innovation
               •   operational efficiency
               •   financial performance, etc.
        • to a series of defined metrics
        • and rank accordingly

  from Schwalbe, IT Project Mgmt, 6th edition
Perform NPV or other Financial Analyses
     • Project costs & benefits often
       have
       – Long durations (years)
       – Very different cost & benefit cash
         flow patterns
       – Irregular patterns, sign switching
     • Makes them difficult to compare &
       rank
     • NPV addresses this issue
Which is the Best Project?
         All amounts positive for graphing
     Year        Costs     Benefits      Net
             0        12                     -12
             1         5          10           5
             2         5          15          10
             3         5            6          1
             4         5          20          15
  totals              32          51          19

     Year       Costs   Benefits        Net
            0        50                       -50
            1        15       25               10
            2         4       25               21
            3         4       25               21
            4         4       21               17
  totals                                       19

     Year       Costs       Benefits    Net
            0           5                     -5
            1           5         12           7
            2           5         10           5
            3           5         12           7
            4           5         10           5
  totals                                      19
What do we need to do to compare these
very different cashflow streams?
        • We need to measure the costs and
          benefits with the timing differences
          removed but altering the value based on
          how far in the future they occur
        • We do that by adjusting the cashflows
          back to a single value at a point in time,
          the present time or time zero
        • We call this net present value or NPV
        • We do this by discounting each cashflow
          stream by a discount rate (sort of a
          reverse interest rate)


                                                       12
Is there a math formula which will do the
discounting for us?
     • Yes, here it is:
     NPV=net present value=∑ t=0…n A t /(1+r) t
          • where:
             –   t=period of the cash flow
             –   n=last period of the cash flow
             –   A=amount of cash flow each period
             –   R=discount rate per period

     • Don’t panic – Excel will do the
       math for us


                                                     13
Using NPV To Pick the Best Project
    outflows negative for calc of NPV
       Year      Costs      Benefits    Net         NPV
             0        -12                     -12
             1         -5          10           5
             2         -5          15          10
             3         -5           6           1
             4         -5          20          15
    totals            -32          51          19   $13.53

       Year       Costs      Benefits   Net
              0       -50                     -50
              1       -15          25          10
              2         -4         25          21
              3         -4         25          21
              4         -4         21          17
    totals            -77          96          19    $8.70

       Year       Costs      Benefits   Net
              0        -5                     -5
              1        -5          12          7
              2        -5          10          5
              3        -5          12          7
              4        -5          10          5
    totals            -25          44         19    $14.99

                                                             14
Time Value of Money - The Concept
     • What would you rather have?
       – $100 today or
       – $100 one year from now
     • Why?
       – Because $100 today is worth more than
         $100 one year from now
     • How?
       – You could invest the $100 now and have
         more in a year due to a return (interest)
     • How much more?
       – The amount you could earn in one year on
         the money received today


                                                     15
Terminology
    • Present value
      – The value of a future cash flow
        discounted to present value
    • Discount (rate)
      – Adjusting future values to the
        present by a % called a discount rate
        (reverse interest)
    • Future value
      – The value of a present sum in the
        future as a result of compounding
        interest

                                            16
Cash Flow
    • Cash in & cash out of business
    • Net of in & out is net cash flow in
      same period
    • Not accounting income
      – Accounting income must be adjusted
        by:
        • Adding back (dropping) non-cash
          expenses like depreciation &
          amortization
        • Adding amortized cash outflows like
          capital expenditures in period in which
          they occurred
                                                    17
More terms
    • Annuity
      – A series of equal payments over some
        future time period
    • Discounted cash flow
      – A series of future amounts discounted to
        their present value
    • Non-cash expense
      – An income statement expense that is a
        non-cash item (paid at an earlier time),
        e.g., depreciation
    • IRR
      – Internal rate of return (interest or discount
        rate)

                                                        18
More terms
    • Payback period
      – How long it takes to get your initial
        investment back
    • ROI
      – Return on investment
    • Cost of capital
      – The cost of financing, e.g., via
        bonds, loans, stock
    • Opportunity cost
      – What return you lose by not
        investing the money
                                                19
Applications
    • Compound interest
        – Bonds
        – Mortgages & loans
    •   Lease vs. buy decisions
    •   Annuities
    •   Life insurance
    •   Project costs
    •   Capital budgeting/allocation
    •   Investment returns
    •   Lease comparisons
                                       20
You Won the Lottery
         •Payout Options
                 –Lump Sum of $1,000,000 now
                 –$75,000/yr for 20 yrs ($1.5 million)
                                   Lottery Payout Choices

                              Lump Sum of $1 million          $75,000/yr for 20 yrs


         1,200
         1,000
          800
  $000


          600
          400
          200
           -
                  1   2   3   4   5   6   7   8   9 10 11 12 13 14 15 16 17 18 19 20
                                                       Year


                                  Which is the better deal?                            21
Excel Functions
    • NPV – Net present value
       – Use for regular periods
       – All flows occur at end of period
    • PV
       – Use for annuities (same amount each
         regular period)
       – Can specify flows occur at beg or end of
         period
    • IRR - Internal rate of return
       – can estimate rate (needed if only 2
         periods)
       – Has to have at least 1 minus & 1 plus #
       – Assumes flows occur at end of period
    • XNPV (Excel 2007 only)
       – Use for irregular periods
                                                    22
Excel Tips
     • Remember to state disc rate in
       same period as cashflows
       – e.g., if cashflows in months, state
         rate per month (annual rate/12)
     • Remember that outflows are
       negative, inflows are positive
        -10,000 is an outflow
        +10,000 is an inflow


                                               23
More Excel Tips
     • Think about whether the initial cash
       outflow should be discounted or not
       – without evidence that it is spread over
         time, assume it is all spent up front and,
         therefore, does not need to be discounted;
       – but don't forget to include it in the net
         present value at full value and as a
         negative (cash outflow).
     • If you are not discounting the initial
       cash outflow,
       – place it in a period called Time Zero (Yr 0
         or Month 0), so it is evident you are
         treating it as an upfront outlay & not
         discounting it;
       – this will also help to remind you not to
         discount it
                                                       24
Evaluating Excel NPV Results
                          Evaluating NPV Results


       100

       50

        0

       -50

      -100
                Positive          Zero          Negative
             Good Investment     Neutral     Bad Investment


                                                              25
Evaluating Excel IRR Results
                              Evaluating IRR Results
                          Assume Cost of Capital (CC) = 10%


      30%
      20%
      10%
       0%
      -10%
      -20%
      -30%
                IRR=>CC         IRR=CC        IRR=<CC         IRR=neg
             Good Investment     Neutral    Bad Investment Worse Investment


                                                                              26
Payback Period
    •set up net cash flow stream, including initial
    outlay
    •net outflows as negatives, net inflows as
    positives
    •set up cumulative value for each period,
    starting with initial outlay
    •when cumulative net cash flow goes positive,
    that is the payback period


                                  Yr 0       Yr 1      Yr 2      Yr 3
  Discounted benefits - costs   (100,000)    51,150    47,300    43,450
  Cumulative benefits - costs   (100,000)   (48,850)   (1,550)   41,900


                                                                          27
Return on Investment (ROI)
• (Total Benefits – Total Costs)/Total
  Costs
• Discounted or not discounted, can
  compute either way, but don’t mix the
  two
• Label whether you computed it on
  discounted or undiscounted net
  cashflows


                                          28
Endnotes
    • Date: Sep 21, 2011
    • Title: Time Value of Money – Important to Project
      Finance
    • File name: Time Value of Money Lecture
      2011jSE21.ppt
    • Author: Ron Gottardi
    • © 2010, 2011 Ron Gottardi


                                                          29

Time value of money lecture 2011j se21 w script

  • 1.
    Time Value ofMoney Important to Project Finance
  • 2.
    Why Time Valueof Money Is Important in Project Mgmt • If we can’t fund all the projects, we need a way to compare, rank & choose • Which is the best project?
  • 3.
    Best Way toEvaluate & Choose I.T. Projects • How well does this project align with the company’s strategic plan & goals?
  • 4.
    Strategic Planning • Corp asks: – Where are we? (status) – Where are we going? (goals) – How do we get there (tactical planning) • Try to Identify: – Corp strengths – Corp weaknesses – Corp opportunities – Corp threats
  • 5.
    Ways to Compare,Rank & Choose Projects • Focus on broad organizational needs • Categorize information technology projects • Use a weighted scoring model • Implement a balanced scorecard • Perform net present value or other financial analyses from Schwalbe, IT Project Mgmt, 6th edition
  • 6.
    Focus on BroadOrganizational Needs • Is there a need? • Are funds available? • Is there a strong will (or a strong mgr) to make the project succeed? from Schwalbe, IT Project Mgmt, 6th edition
  • 7.
    Categorize I.T. Projects • Does the project address • A problem? • An opportunity? • A directive? from Schwalbe, IT Project Mgmt, 6th edition
  • 8.
    Use a WeightedScoring Model • identify criteria important to project success • assign weights to each • assign scores to each criterion for each project • multiply scores by weights to get total weighted scores • rank projects according to total weighted scores from Schwalbe, IT Project Mgmt, 6th edition
  • 9.
    Implement a BalancedScorecard • convert an organization’s value drivers, such as • customer service • innovation • operational efficiency • financial performance, etc. • to a series of defined metrics • and rank accordingly from Schwalbe, IT Project Mgmt, 6th edition
  • 10.
    Perform NPV orother Financial Analyses • Project costs & benefits often have – Long durations (years) – Very different cost & benefit cash flow patterns – Irregular patterns, sign switching • Makes them difficult to compare & rank • NPV addresses this issue
  • 11.
    Which is theBest Project? All amounts positive for graphing Year Costs Benefits Net 0 12 -12 1 5 10 5 2 5 15 10 3 5 6 1 4 5 20 15 totals 32 51 19 Year Costs Benefits Net 0 50 -50 1 15 25 10 2 4 25 21 3 4 25 21 4 4 21 17 totals 19 Year Costs Benefits Net 0 5 -5 1 5 12 7 2 5 10 5 3 5 12 7 4 5 10 5 totals 19
  • 12.
    What do weneed to do to compare these very different cashflow streams? • We need to measure the costs and benefits with the timing differences removed but altering the value based on how far in the future they occur • We do that by adjusting the cashflows back to a single value at a point in time, the present time or time zero • We call this net present value or NPV • We do this by discounting each cashflow stream by a discount rate (sort of a reverse interest rate) 12
  • 13.
    Is there amath formula which will do the discounting for us? • Yes, here it is: NPV=net present value=∑ t=0…n A t /(1+r) t • where: – t=period of the cash flow – n=last period of the cash flow – A=amount of cash flow each period – R=discount rate per period • Don’t panic – Excel will do the math for us 13
  • 14.
    Using NPV ToPick the Best Project outflows negative for calc of NPV Year Costs Benefits Net NPV 0 -12 -12 1 -5 10 5 2 -5 15 10 3 -5 6 1 4 -5 20 15 totals -32 51 19 $13.53 Year Costs Benefits Net 0 -50 -50 1 -15 25 10 2 -4 25 21 3 -4 25 21 4 -4 21 17 totals -77 96 19 $8.70 Year Costs Benefits Net 0 -5 -5 1 -5 12 7 2 -5 10 5 3 -5 12 7 4 -5 10 5 totals -25 44 19 $14.99 14
  • 15.
    Time Value ofMoney - The Concept • What would you rather have? – $100 today or – $100 one year from now • Why? – Because $100 today is worth more than $100 one year from now • How? – You could invest the $100 now and have more in a year due to a return (interest) • How much more? – The amount you could earn in one year on the money received today 15
  • 16.
    Terminology • Present value – The value of a future cash flow discounted to present value • Discount (rate) – Adjusting future values to the present by a % called a discount rate (reverse interest) • Future value – The value of a present sum in the future as a result of compounding interest 16
  • 17.
    Cash Flow • Cash in & cash out of business • Net of in & out is net cash flow in same period • Not accounting income – Accounting income must be adjusted by: • Adding back (dropping) non-cash expenses like depreciation & amortization • Adding amortized cash outflows like capital expenditures in period in which they occurred 17
  • 18.
    More terms • Annuity – A series of equal payments over some future time period • Discounted cash flow – A series of future amounts discounted to their present value • Non-cash expense – An income statement expense that is a non-cash item (paid at an earlier time), e.g., depreciation • IRR – Internal rate of return (interest or discount rate) 18
  • 19.
    More terms • Payback period – How long it takes to get your initial investment back • ROI – Return on investment • Cost of capital – The cost of financing, e.g., via bonds, loans, stock • Opportunity cost – What return you lose by not investing the money 19
  • 20.
    Applications • Compound interest – Bonds – Mortgages & loans • Lease vs. buy decisions • Annuities • Life insurance • Project costs • Capital budgeting/allocation • Investment returns • Lease comparisons 20
  • 21.
    You Won theLottery •Payout Options –Lump Sum of $1,000,000 now –$75,000/yr for 20 yrs ($1.5 million) Lottery Payout Choices Lump Sum of $1 million $75,000/yr for 20 yrs 1,200 1,000 800 $000 600 400 200 - 1 2 3 4 5 6 7 8 9 10 11 12 13 14 15 16 17 18 19 20 Year Which is the better deal? 21
  • 22.
    Excel Functions • NPV – Net present value – Use for regular periods – All flows occur at end of period • PV – Use for annuities (same amount each regular period) – Can specify flows occur at beg or end of period • IRR - Internal rate of return – can estimate rate (needed if only 2 periods) – Has to have at least 1 minus & 1 plus # – Assumes flows occur at end of period • XNPV (Excel 2007 only) – Use for irregular periods 22
  • 23.
    Excel Tips • Remember to state disc rate in same period as cashflows – e.g., if cashflows in months, state rate per month (annual rate/12) • Remember that outflows are negative, inflows are positive  -10,000 is an outflow  +10,000 is an inflow 23
  • 24.
    More Excel Tips • Think about whether the initial cash outflow should be discounted or not – without evidence that it is spread over time, assume it is all spent up front and, therefore, does not need to be discounted; – but don't forget to include it in the net present value at full value and as a negative (cash outflow). • If you are not discounting the initial cash outflow, – place it in a period called Time Zero (Yr 0 or Month 0), so it is evident you are treating it as an upfront outlay & not discounting it; – this will also help to remind you not to discount it 24
  • 25.
    Evaluating Excel NPVResults Evaluating NPV Results 100 50 0 -50 -100 Positive Zero Negative Good Investment Neutral Bad Investment 25
  • 26.
    Evaluating Excel IRRResults Evaluating IRR Results Assume Cost of Capital (CC) = 10% 30% 20% 10% 0% -10% -20% -30% IRR=>CC IRR=CC IRR=<CC IRR=neg Good Investment Neutral Bad Investment Worse Investment 26
  • 27.
    Payback Period •set up net cash flow stream, including initial outlay •net outflows as negatives, net inflows as positives •set up cumulative value for each period, starting with initial outlay •when cumulative net cash flow goes positive, that is the payback period Yr 0 Yr 1 Yr 2 Yr 3 Discounted benefits - costs (100,000) 51,150 47,300 43,450 Cumulative benefits - costs (100,000) (48,850) (1,550) 41,900 27
  • 28.
    Return on Investment(ROI) • (Total Benefits – Total Costs)/Total Costs • Discounted or not discounted, can compute either way, but don’t mix the two • Label whether you computed it on discounted or undiscounted net cashflows 28
  • 29.
    Endnotes • Date: Sep 21, 2011 • Title: Time Value of Money – Important to Project Finance • File name: Time Value of Money Lecture 2011jSE21.ppt • Author: Ron Gottardi • © 2010, 2011 Ron Gottardi 29

Editor's Notes

  • #2 This is Goodwin College of Drexel University, course number CT431 IT Project Management, Time Value of Money, Project Finance; coordinates with Chapter 4 of the text, Project Integration Mgmt. Slides, script and narration by Ron Gottardi, Adjunct Faculty, Drexel University. A few slides are from Schwalbe, IT Project Mgmt, 6 th edition .
  • #3 Let’s talk about why the concept of the time value of money is important in project finance. It is usual for a company to have more potential projects than they can fund. The difficulty then becomes which project(s) to fund and start and which ones to leave on the drawing board. How can we compare and measure the different projects in an attempt to identify the best opportunities for the company.
  • #4 The Best Way to Evaluate &amp; Choose I.T. Projects is to ask: How well does this project align with the company’s strategic plan &amp; goals?
  • #5 In corporate strategic planning, the Corp asks: Where are we? (status) Where are we going? (goals, objectives) How do we get there (tactical planning) And tries to identify: Corp strengths Corp weaknesses Corp opportunities (including project opportunities) Corp threats
  • #6 Your text talks about some of the ways that companies compare and rank projects in order to select the best, such as: Focus on broad organizational needs Categorize information technology projects Use a weighted scoring model Implement a balanced scorecard Perform net present value or other financial analyses
  • #7 Focusing on broad organizational needs (Is there a need? are funds available? Is there a strong will (or a strong mgr) to make the project succeed?
  • #8 Categorizing information technology projects (Does the project address a problem? An opportunity? A directive?)
  • #9 Using a weighted scoring model (identify criteria important to project success, assign weights to each, assign scores to each criterion for each project, multiply scores by weights to get total weighted scores, rank projects according to total wtd scores)
  • #10 Implementing a balanced scorecard (convert an org’s value drivers, such as customer service, innovation, operational efficiency, financial performance, etc., to a series of defined metrics and rank accordingly)
  • #11 The net present values &amp; other financial analysis techniques are more complicated mathematically, so we will look at them in more detail.
  • #12 You are the CEO of a company and have the following three project opportunities but insufficient funds to fund all 3. Take a look at these 3 projects and try to identify the best one. Each has a very different cash flow pattern of costs and benefits and net cashflow. Note that the aggregate net cashflow for all 3 is the same: $19 zillion. Not obvious, is it?
  • #13 What do we need to do to compare these very different cashflow streams? We need to measure the costs and benefits with the timing differences removed but altering the value based on how far in the future they occur We do that by adjusting the cashflows back to a single value at a point in time, the present time or time zero We call this net present value We do this by discounting each cashflow stream by a discount rate (sort of a reverse interest rate)
  • #14 Is there a math formula which will do the discounting for us? Yes, here it is: NPV=net present value=∑ t=0…n A t /(1+r) t where: t=period of the cash flow n=last period of the cash flow A=amount of cash flow each period R=discount rate per period Don’t panic – Excel will do the math for us.
  • #15 Here are those same 3 projects with NPV calculated for each. Even though the aggregate net cashflows are the same, the NPV’s are significantly different. Which is the best project after this analysis? The one with the highest NPV, project number 3, with an NPV of $14.99.