Download as PDF, PPTX


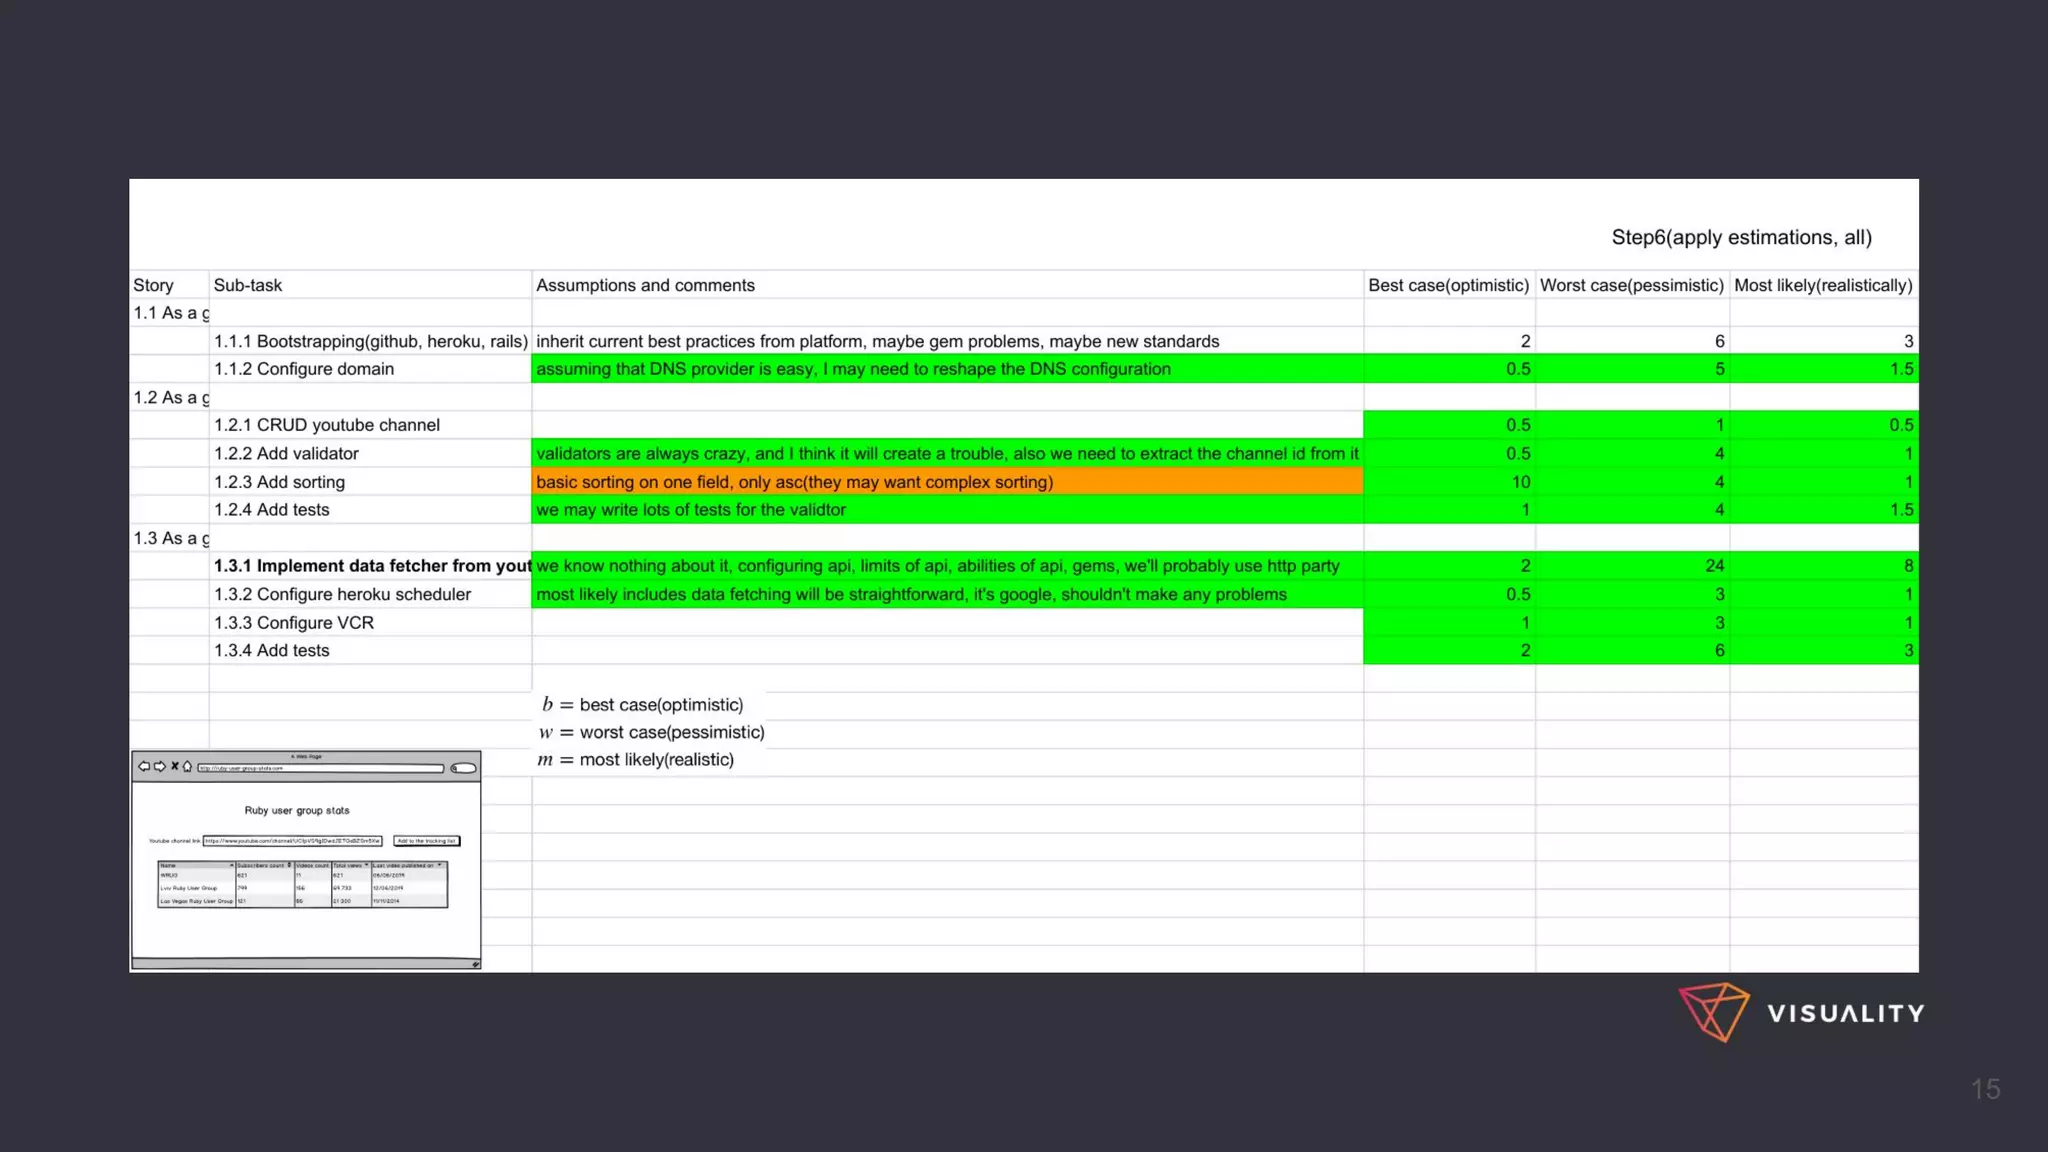
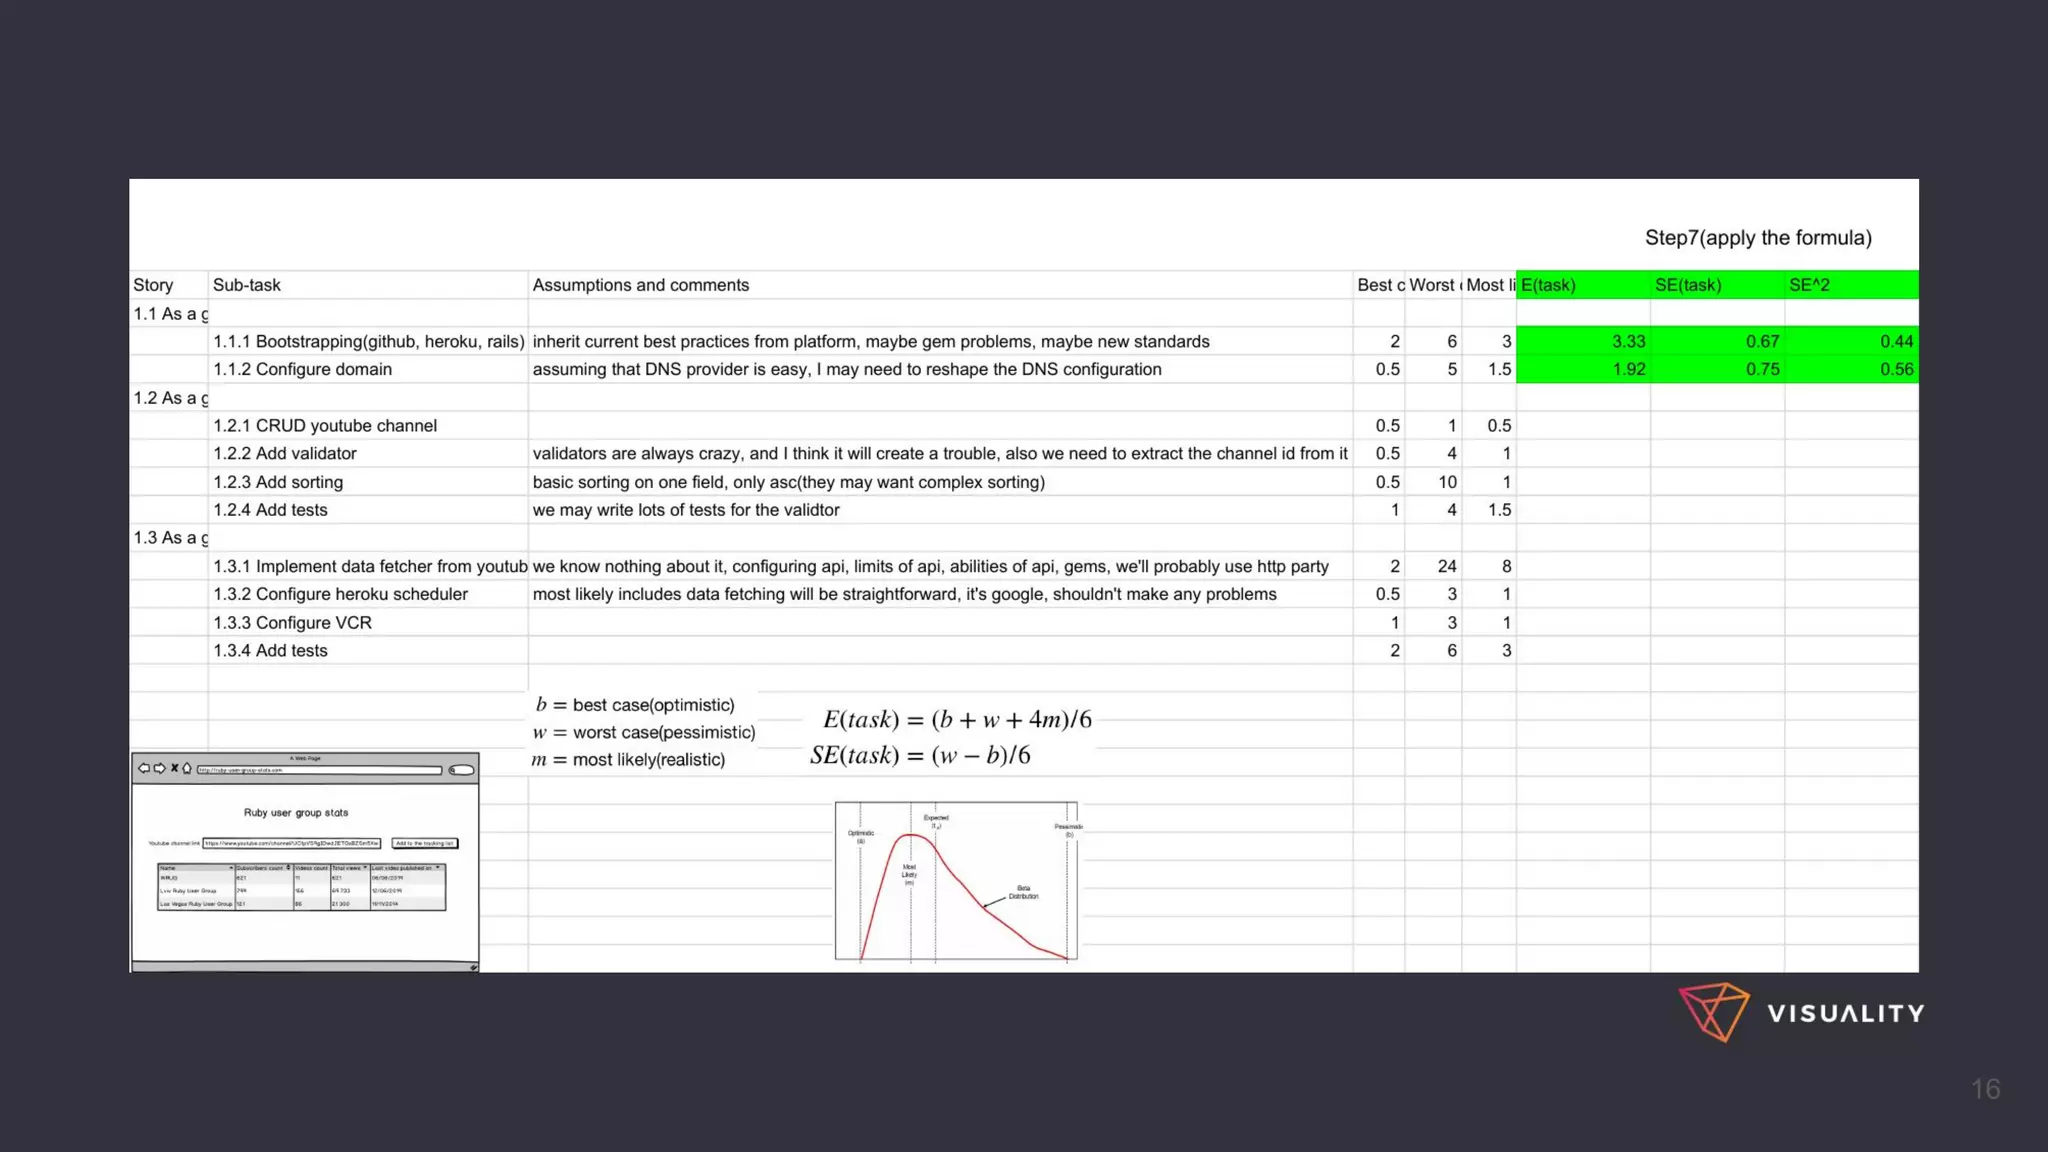
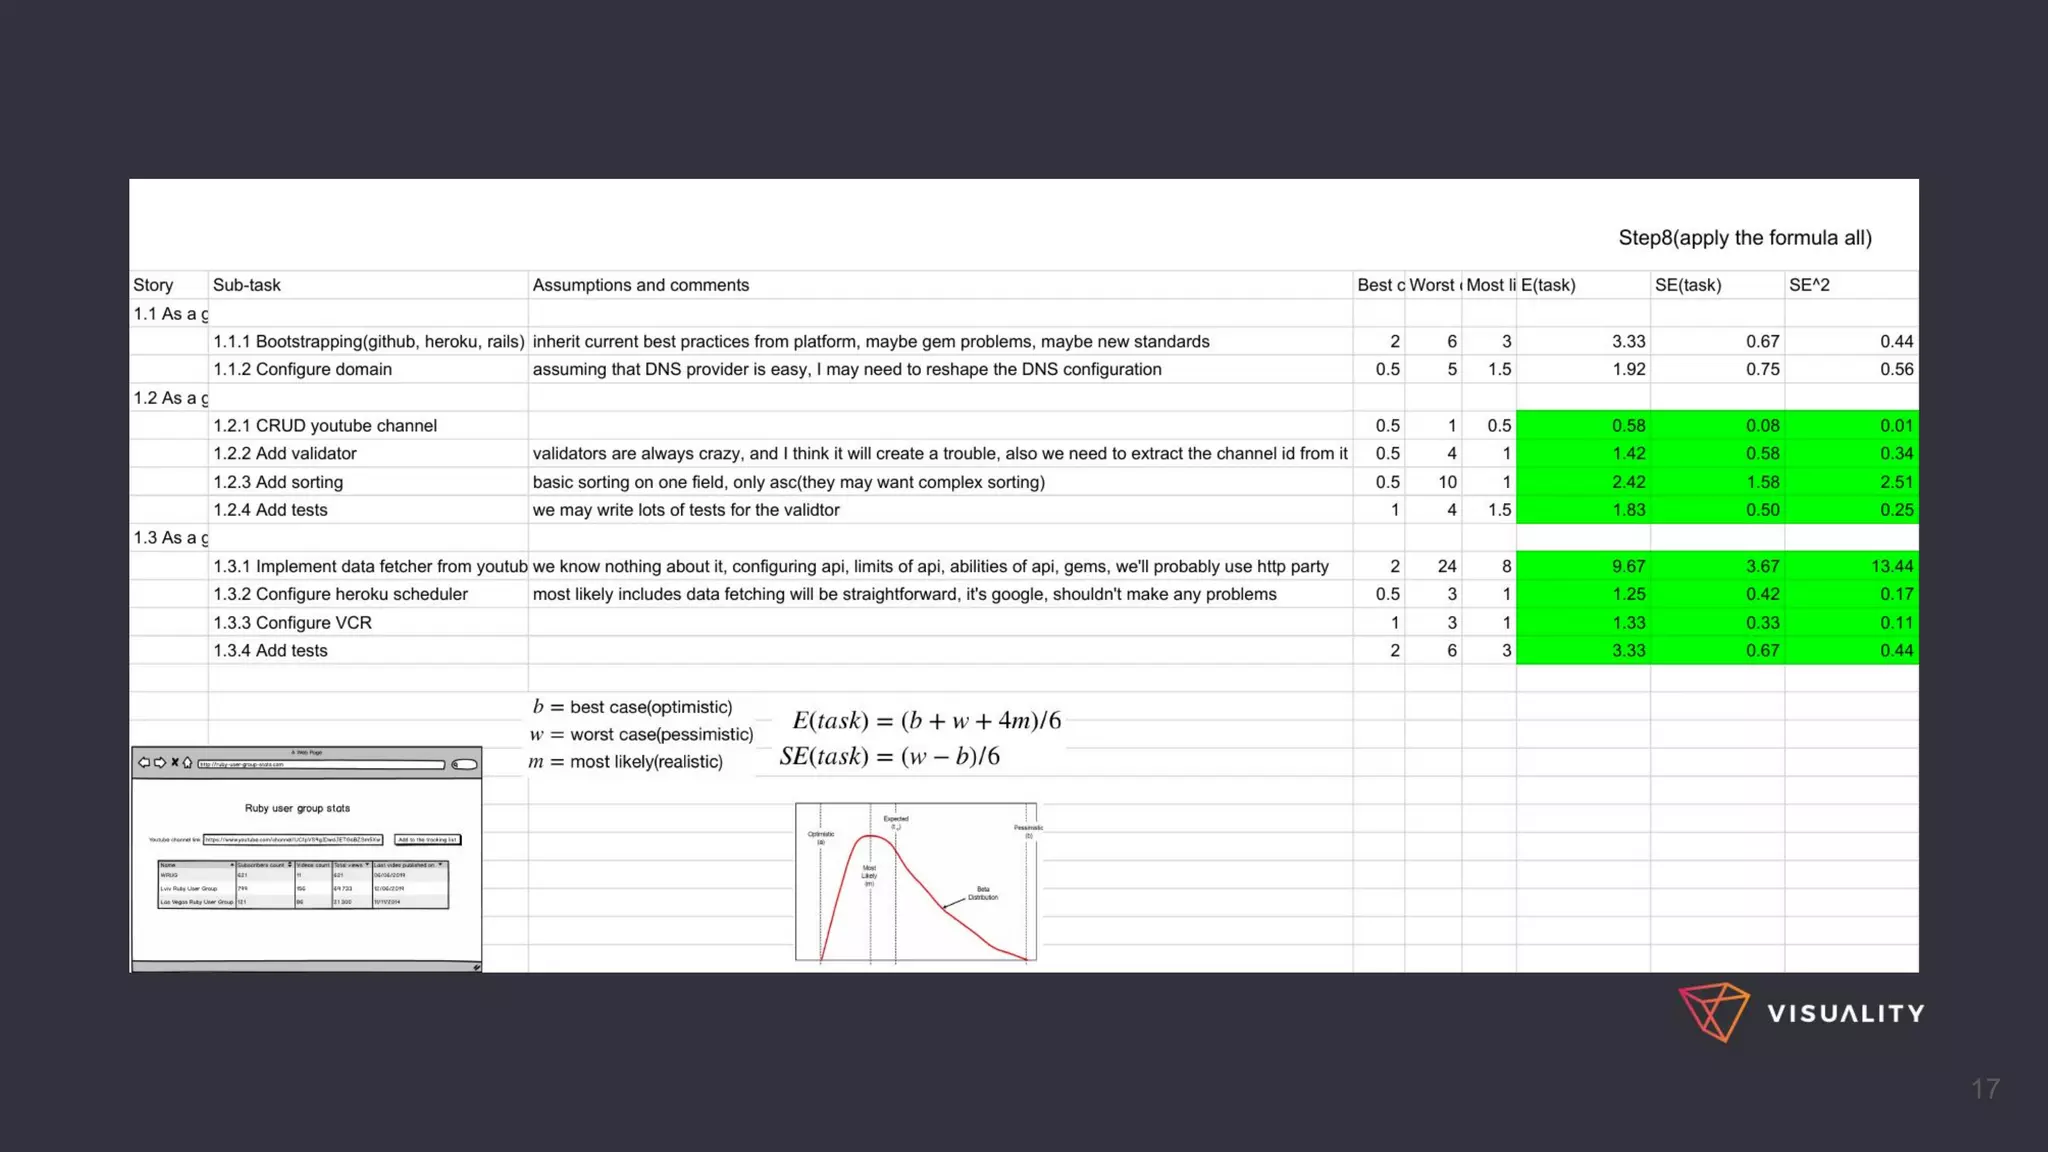
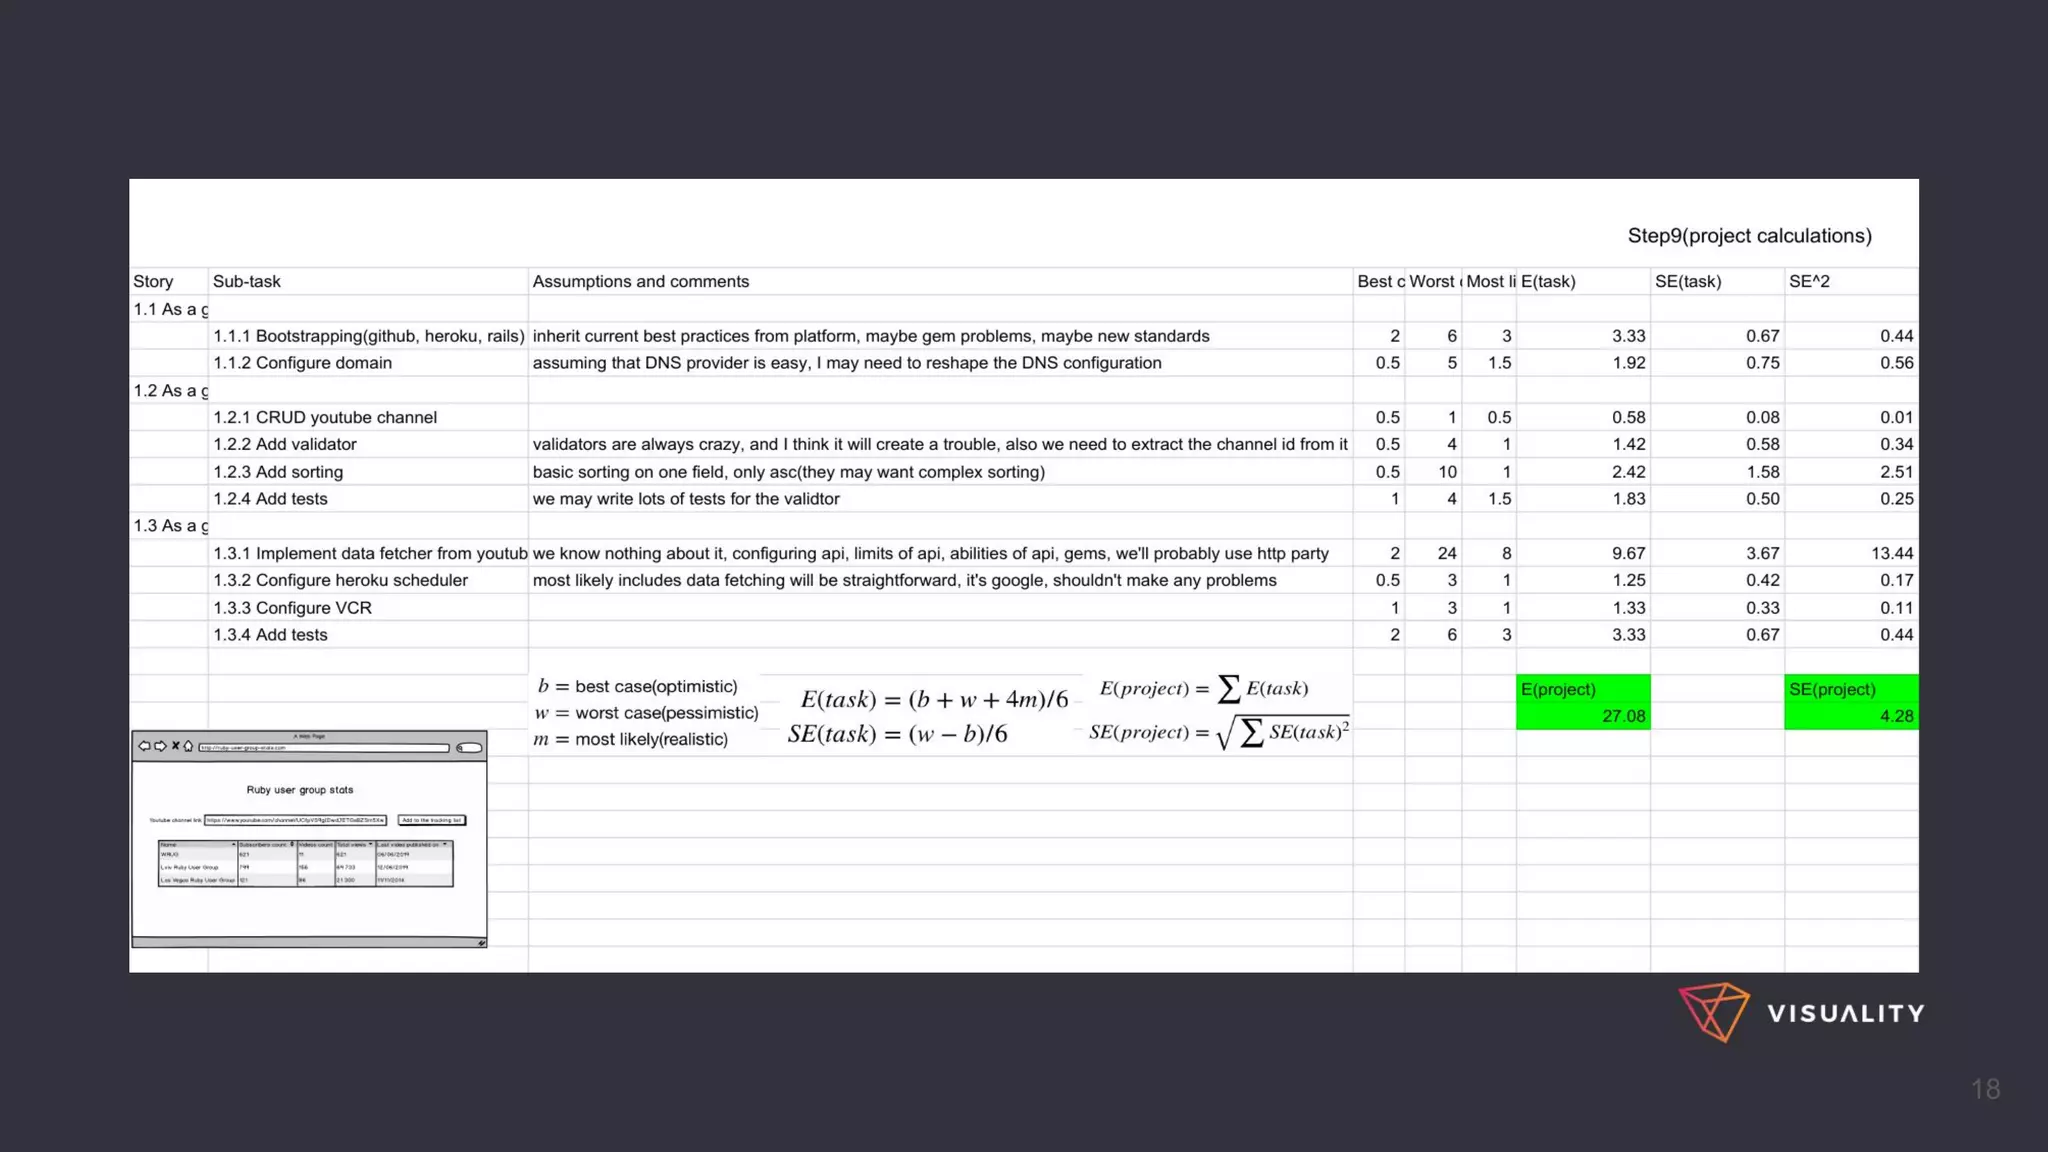


The document outlines the three-point estimation technique applied to project estimations by Sakir Temel, highlighting its importance and methods over his extensive experience with over 130 project estimations. It emphasizes understanding how to implement this technique effectively, the role of teamwork, and the need for realistic estimations across diverse projects. Recommendations include making the estimation process transparent and using techniques as aids in decision-making rather than definitive solutions.


