SlideShare a Scribd company logo
1 of 8
Download to read offline
Ranjana Chowdhury, Amitabha Barua / International Journal of Engineering Research and
                Applications (IJERA) ISSN: 2248-9622 www.ijera.com
                 Vol. 2, Issue 5, September- October 2012, pp.1831-1838
    Identification Of Some Of The Factors In The Formation Of
                   Attitude Towards Mathematics
                          Ranjana Chowdhury, Amitabha Barua
          Department of Computer Application Assam Engineering College Guwahati 781013, Assam


Abstract
          This paper reveals the results of the         Council of Teachers of Mathematics (1989) and
investigation carried out to study some sort of         National Research Council have urged educationists
possible relationship that might occur in case of       of the country to incorporate effective factors in the
formation of attitude towards mathematics and           cognitive domain of school children, [ 1,4,5,6,10] .
to find the factors that are responsible for the                 It appears sometimes that brilliant students
purpose . The investigation mainly deals with           possess a good attitude towards learning
“attitude - factors” related to parents together        mathematics. But the same has not yet been fully
with the medium of instruction and also                 and scientifically established. It is also observed that
considering “sex- factors” as another one . For         researchers in India and abroad give much emphasis
this purpose, a sample of two hundred secondary         on the relationship between attitude towards
school students have been chosen so as to study         mathematics (ATM) and achievements in
such relation where the variables are chosen            mathematics (AIM).
above – type of “ attitude factors” together with
the others mentioned above .The correlation             2. Significance of Study
technique and “ t- statistics” are playing key role     Some of the studies in this area are mentioned
in our investigation . and thereby we estimate          below:
direct and indirect influence of independent                      Pinkrah’s, in the year 1989 studied about
variables on the dependent one .Interestingly, we       pupils      „„Attitude    towards    understanding
find the direct effect on the formation of attitude     mathematics‟‟ and revealed that, enjoyment with
towards mathematics.                                    mathematics and liking of mathematics were
Key words: Attitude –factors Statistical Correlation    stronger determinants for learning the subject with
/ t- test                                               less difficulty.

1. Introduction                                                   Armstrong, in the year 1993 conducted a
          We all know that from the time of antiquity   descriptive study of the „„interrelationship of parent,
mathematics has been playing a vital role in            teacher and student attitude towards mathematics
upgrading human culture and civilization in addition    and school achievement of selected eight grade
to developing science and technology. Its use in        students in the Inglewood Unified School District.‟‟
expanding human knowledge and thought is                A significant relationship was found between
immense. For over all uplift of the human society,      attitude towards mathematics of students and
the mankind needs skilled and trained persons in        parents, but not of students and their mathematics
mathematics.       Mathematics has through the ages,    teachers.
produced men of quality. E.T.Bell, in his books
Men of Mathematics, observes- “As a group the                    Pal, A. in the year 1989 considered „„the
great mathematicians have been men of all round         dependence of achievement in mathematics on four
ability, vigorous, alert, keenly interested in many     variables of the effective dimension viz. (i) self
things outside mathematics.                  .          concept, (ii) anxiety, (iii) attitude and (iv) academic
          However, now a day instead of getting         motivation‟‟.
increasingly interested in learning mathematics, our             He formulated 56 hypotheses with these
school students have been found lacking in aptitude     variables and classified the students into urban,
to be As such it has become the necessity of the        semi-urban and rural and male and female groups.
hour to identify the causes responsible for large       He found the regression equation to predict the
scale failures in the subject. Otherwise within a       performance in mathematics as a linear combination
short span of time, skilful and trained persons in      of the four affective variables.
mathematics will vanish from our country. It will
then be a disaster for us.                                      Chel in the year 1990 in his study
          A number of researchers in India and          examined „„the problem of underachievement in
abroad have investigated into the relationship          compulsory        mathematics     in    Madhyamic
between the effective and the cognitive domains of      Examination of West Bengal‟‟. He found the
teaching and learning mathematics. National             following causes responsible for underachievement:


                                                                                              1831 | P a g e
Ranjana Chowdhury, Amitabha Barua / International Journal of Engineering Research and
                Applications (IJERA) ISSN: 2248-9622 www.ijera.com
                 Vol. 2, Issue 5, September- October 2012, pp.1831-1838
 (i) Gaps in knowledge of mathematics concepts.           examining the responses of 545 students. The data
 (ii) Difficulties in understanding mathematical          represent all grade levels and subject of the
language.                                                 secondary mathematics curriculum. This reliability
 (iii) Lack of openness and flexibility in teaching.      coefficient alpha was ·97. A maximum likelihood
 (iv) Difficulties in mathematization of verbal           factor analysis with a varimax rotation yielded four
problems and interpretation of mathematical results.      factors; self-confidence; value of mathematics;
 (v) Abstract nature of mathematics.                      enjoyment of mathematics; and motivation.
 (vi) Fear and anxiety on the part of the students.       Psychometric properties were sound and the
           The study suggests greater motivation of       instrument. Attitude toward Mathematics Inventory
the students for learning mathematics, removal of         (ATMI), can be recommended for use in the
fear of mathematics and clearer presentation of           investigation of students‟ ATM
subject based on the need of the children.                Pierce, R., Stacy, K., Borkortsas, A., in the year
Rosaly, A., in the year 1992 had studied on „„the         2005 studied about “A scale for monitoring
relationship between attitude of students towards         student‟s attitudes to learning mathematics with
mathematics and achievement.‟‟ The investigator           technology.” This paper presents a model of how
showed the following major            findings:           technology use can enhance mathematics
 (i)The attitude of high school students towards          achievement, a review of other instruments and a
learning mathematics and their achievement in             psychometric analysis of the MTAS. It also reports
mathematics were related.                                 the responses of 350 students from six schools to
 (ii)Urban girls had a more positive attitude towards     demonstrate the power of the MTAS to provide
mathematics. Similarly, urban boys had a more             useful insights for teacher and researchers. „Attitude
positive attitude towards mathematics than rural          to learning mathematics with technology‟ had a
boys.                                                     wider range of scores from other variables studied.
 (iii)Girls were higher than boys in their                For boys, this attitude is correlated only with
achievement in mathematics.                               confidence in using technology, but for girls the
 (iv)Urban girls were higher than rural boys in           only relationship found was a negative correlation
mathematics .                                             with mathematics confidence. These difference need
Hariharan, D., in the year 1992 studied on „„the          to be taken into account when planning instruction, [
attitude of high school students towards home work        2, 3, 4, 7, 8, 9 ] ..
and their achievement in mathematics.‟‟                          It is observed that though achievement in
The following were showed in his thesis:                  mathematics seems to be positively related to
 (i)Girls were higher than boys in their attitude         attitude towards mathematics, but little effort has
towards home work.                                        been made to investigate how that attitude is
 (ii)Urban students were students were higher than        formed.
rural students in their attitude      towards home
work.                                                     3. Problems of the Investigation:
 (iii)Private school attitude students were higher                 In this study we want to identify some of
than the government school            students in their   the factors responsible for formation of attitude of
attitude towards home work.                               the pupils in secondary stage towards mathematics
           It is observed that though achievement in      in relation to 1. home environment, 2. father‟s
mathematics seems to be positively related to             attitude towards mathematics, 3. mother‟s attitude
attitude towards mathematics. But little effort has       towards mathematics, 4. pupils achievement in
been made to investigate how that attitude is             mathematics in school internal examinations, 5.
formed.                                                   medium of instruction, 6. class environment, 7.
Mohammad Miyan in a trend report Survey of                some social factors, 8. sex.
Research in Mathematics Education edited by Buch           Objective of the Study:
remarks “Though attitude towards mathematics              1. To enquire into the relationship between attitude
seems to be positively related to achievement, no         towards mathematics and achievement in
effort has been made to investigate how that attitude     mathematics.
is formed” .                  We through this study       2. To investigate into the relationship between home
want to identify some of the factors responsible for      environment and attitude towards mathematics.
formation of attitude towards mathematics and             3. To identify relationship between father‟s attitude
select the following topic for the present study.         towards mathematics and pupil‟s attitude towards
Tapia, M., Marsh II, George E., in the year 2004          mathematics.
in the Academic Exchange Quarterly, Vol. 8, and           4. To identify relationship between mother‟s attitude
Issue 2 studied about “An instrument to measure           towards mathematics and pupil‟s attitude towards
mathematics attitudes.” This research paper to            mathematics.
reports of the development of a new instrument to         5. To investigate the relationship between attitude
measure students‟ ATM, and to determine the               towards mathematics and pupils of Assamese and
underlying dimensions of the instrument by                English medium schools.


                                                                                               1832 | P a g e
Ranjana Chowdhury, Amitabha Barua / International Journal of Engineering Research and
                Applications (IJERA) ISSN: 2248-9622 www.ijera.com
                 Vol. 2, Issue 5, September- October 2012, pp.1831-1838
6. To establish a relationship between classroom                   schools from the population of standard
environment and attitude towards mathematics.             VIII of secondary schools of Greater Guwahati of
7. To establish a relationship between pupils belief      Assam.
about    mathematics      and     attitude towards
mathematics.
8. To study the attitude towards mathematics as a         c. Tools to be used in the collection of data
function of sex.                                                    To measure the variables undertaken and to
                                                          collect the data for the study, the researcher intends
Hypotheses:                                               to use the following tools.
We formulate the following hypotheses for the             (i) Attitude scale towards mathematics to measure
present study–                                            the attitude towards mathematics of the       pupil.
H1        :There is no significant relationship           (ii)To enquire about the home environment and
between attitude towards mathematics and                  parent‟s attitude towards mathematics.
achievement in                mathematics of the          From the parents a questionnaire is constructed in
pupil.                                                    the following steps.
H2        : There is no significant relationship                    To know the status of parents & their (a)
between home environment and development of               occupation,      (b) educational qualification, (c)
attitude towards      mathematics.                        attitude towards mathematics. It is for guardians
H3        :There is no significant relationship           also for home environment.
between father‟s attitude towards mathematics and         (iii)To enquire about the classroom environment a
pupil‟s attitude     towards mathematics.                 questionnaire on classroom environment is
H4        :There is no significant relationship           constructed.
between mother‟s attitude towards mathematics and         (iv)To assess achievement in mathematics each
pupil‟s attitude     towards mathematics.                 pupil, data will be collected from the records of
H5         :There is no significant difference between    school annual examinations for promotion from
the attitude towards mathematics of pupils of             standard VIII to standard IX.
English and          Assamese medium schools.
H6         :There is no significant difference between    5. System of Analysis of Data:
the classroom environment and attitude towards                     In order to draw fruitful outcomes and
mathematics.                                              derive effective measures, the data are analysed by
H7         :There is no significant relationship          using sophisticated statistical methods and formulae,
between attitude towards mathematics and their            viz., skewness, kurtosis, correlation, regression
belief about          mathematics.                        analysis, normal distribution, binomial distribution,
H8        :There is no significant relationship           etc. and their graphical representation. For validity
between attitude towards mathematics and sex of the       and consistency, we use Hypothesis testing theory,
pupils.                                                   Estimation theory, and Non-parametric tests. Linear
                                                          & non-linear programming, numerical analysis &
4. Research Design and Methodology:                       computation will be another useful tool for our
a. Sampling                                               effective investigation.
 (i) Sampling space: The study will be conducted in        Software Used:
Greater Guwahati of Assam.                                SPSS (Statistical Package for Social Science),
 (ii) Sample: The sample consists of students of          Version 13.0
standard VIII, their respective parents and
guardians.                                                6. RESULTS & DISCUSSIONS
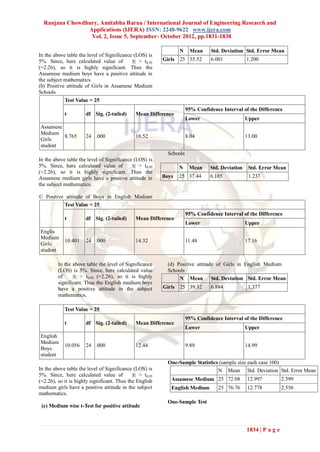
                                                          1(a) Positive attitude of Boys in Assamese Medium
b. Selection of samples                                   Schools
         We intend to use normative survey method              N Mean Std. Deviation Std. Error Mean
for the present study. For this purpose it is targeted
to select a sample of 250 boys and 250 girls from        Boys 25 36.56      7.736              1.547
both English and Assamese medium secondary

            Test Value = 25
                                                                  95% Confidence Interval of the Difference
            t         df Sig. (2-tailed)      Mean Difference
                                                                  Lower                       Upper
Assamese
Medium
         7.472        24 .000                 11.56               8.37                        14.75
Boys
student


                                                                                               1833 | P a g e
Ranjana Chowdhury, Amitabha Barua / International Journal of Engineering Research and
                Applications (IJERA) ISSN: 2248-9622 www.ijera.com
                 Vol. 2, Issue 5, September- October 2012, pp.1831-1838

                                                                  N     Mean     Std. Deviation Std. Error Mean
In the above table the level of Significance (LOS) is
5%. Since, here calculated value of         |t| > t0.05    Girls 25 35.52        6.001            1.200
(=2.26), so it is highly significant. Thus the
Assamese medium boys have a positive attitude in
the subject mathematics.
(b) Positive attitude of Girls in Assamese Medium
Schools
            Test Value = 25
                                                                       95% Confidence Interval of the Difference
            t          df Sig. (2-tailed)      Mean Difference
                                                                       Lower                      Upper
Assamese
Medium
         8.765         24 .000                 10.52                   8.04                       13.00
Girls
student
                                                             Schools
In the above table the level of Significance (LOS) is
5%. Since, here calculated value of         |t| > t0.05           N     Mean     Std. Deviation    Std. Error Mean
(=2.26), so it is highly significant. Thus the
Assamese medium girls have a positive attitude in          Boys   25 37.44       6.185             1.237
the subject mathematics.

© Positive attitude of Boys in English Medium
          Test Value = 25
                                                                       95% Confidence Interval of the Difference
            t          df Sig. (2-tailed)      Mean Difference
                                                                       Lower                      Upper
Englis
Medium
            10.401     24 .000                 14.32                   11.48                      17.16
Girls
student

         In the above table the level of Significance        (d) Positive attitude of Girls in English Medium
         (LOS) is 5%. Since, here calculated value           Schools
         of     |t| > t0.05 (=2.26), so it is highly              N Mean Std. Deviation Std. Error Mean
         significant. Thus the English medium boys
         have a positive attitude in the subject           Girls 25 39.32        6.884             1.377
         mathematics.

            Test Value = 25
                                                                       95% Confidence Interval of the Difference
            t          df Sig. (2-tailed)      Mean Difference
                                                                       Lower                      Upper
English
Medium
            10.056     24 .000                 12.44                   9.89                       14.99
Boys
student
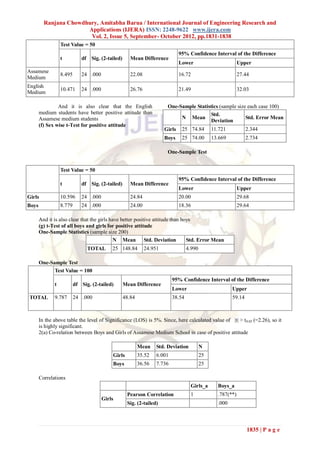
                                                             One-Sample Statistics (sample size each case 100)
In the above table the level of Significance (LOS) is                             N Mean Std. Deviation Std. Error Mean
5%. Since, here calculated value of          |t| > t0.05
(=2.26), so it is highly significant. Thus the English        Assamese Medium 25 72.08            12.997           2.599
medium girls have a positive attitude in the subject          English Medium        25 76.76      12.778           2.556
mathematics.
                                                             One-Sample Test
 (e) Medium wise t-Test for positive attitude


                                                                                                  1834 | P a g e
Ranjana Chowdhury, Amitabha Barua / International Journal of Engineering Research and
                       Applications (IJERA) ISSN: 2248-9622 www.ijera.com
                        Vol. 2, Issue 5, September- October 2012, pp.1831-1838
                  Test Value = 50
                                                                              95% Confidence Interval of the Difference
                  t          df Sig. (2-tailed)      Mean Difference
                                                                              Lower                         Upper
Assamese
                  8.495      24 .000                 22.08                    16.72                         27.44
Medium
English
                  10.471     24 .000                 26.76                    21.49                         32.03
Medium

                And it is also clear that the English                  One-Sample Statistics (sample size each case 100)
       medium students have better positive attitude than                                Std.
       Assamese medium students                                             N Mean                       Std. Error Mean
                                                                                         Deviation
       (f) Sex wise t-Test for positive attitude
                                                                      Girls    25 74.84        11.721           2.344
                                                                      Boys     25 74.00        13.669           2.734

                                                                       One-Sample Test


                  Test Value = 50
                                                                              95% Confidence Interval of the Difference
                  t          df Sig. (2-tailed)      Mean Difference
                                                                              Lower                         Upper
Girls             10.596     24 .000                 24.84                    20.00                         29.68
Boys              8.779      24 .000                 24.00                    18.36                         29.64

       And it is also clear that the girls have better positive attitude than boys
       (g) t-Test of all boys and girls for positive attitude
       One-Sample Statistics (sample size 200)
                                             N Mean Std. Deviation              Std. Error Mean
                                TOTAL      25 148.84         24.951               4.990

       One-Sample Test
             Test Value = 100
                                                                          95% Confidence Interval of the Difference
              t           df Sig. (2-tailed)      Mean Difference
                                                                          Lower                         Upper
TOTAL         9.787       24 .000                 48.84                   38.54                         59.14


       In the above table the level of Significance (LOS) is 5%. Since, here calculated value of |t| > t 0.05 (=2.26), so it
       is highly significant.
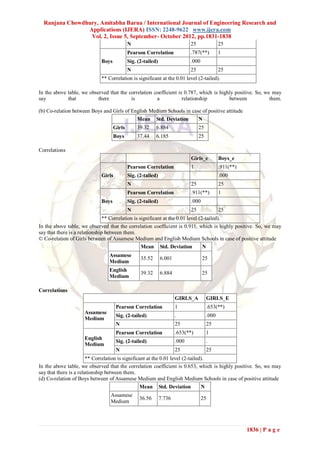
       2(a) Co-relation between Boys and Girls of Assamese Medium School in case of positive attitude

                                                          Mean    Std. Deviation          N
                                           Girls          35.52   6.001                   25
                                           Boys           36.56   7.736                   25

       Correlations
                                                                                   Girls_a       Boys_a
                                                   Pearson Correlation             1             .787(**)
                                       Girls
                                                   Sig. (2-tailed)                               .000


                                                                                                                1835 | P a g e
Ranjana Chowdhury, Amitabha Barua / International Journal of Engineering Research and
                Applications (IJERA) ISSN: 2248-9622 www.ijera.com
                 Vol. 2, Issue 5, September- October 2012, pp.1831-1838
                                           N                                25               25
                                           Pearson Correlation              .787(**)         1
                            Boys           Sig. (2-tailed)                  .000
                                           N                                25               25
                            ** Correlation is significant at the 0.01 level (2-tailed).

In the above table, we observed that the correlation coefficient is 0.787, which is highly positive. So, we may
say          that          there          is          a            relationship         between            them.

(b) Co-relation between Boys and Girls of English Medium Schools in case of positive attitude
                                               Mean      Std. Deviation          N
                                   Girls       39.32     6.884                   25
                                   Boys        37.44     6.185                   25

Correlations
                                                                            Girls_e          Boys_e
                                           Pearson Correlation              1                .911(**)
                            Girls          Sig. (2-tailed)                                   .000
                                           N                                25               25
                                           Pearson Correlation              .911(**)         1
                            Boys           Sig. (2-tailed)                  .000
                                           N                                25               25
                                ** Correlation is significant at the 0.01 level (2-tailed).
In the above table, we observed that the correlation coefficient is 0.911, which is highly positive. So, we may
say that there is a relationship between them.
© Co-relation of Girls between of Assamese Medium and English Medium Schools in case of positive attitude
                                                   Mean Std. Deviation            N
                                Assamese
                                                 35.52       6.001                 25
                                Medium
                                English
                                                 39.32       6.884                 25
                                Medium

Correlations
                                                                     GIRLS_A          GIRLS_E
                                    Pearson Correlation              1                .653(**)
                     Assamese
                                    Sig. (2-tailed)                  .                .000
                     Medium
                                    N                                25               25
                                    Pearson Correlation              .653(**)         1
                     English
                                    Sig. (2-tailed)                  .000             .
                     Medium
                                    N                                25               25
                        ** Correlation is significant at the 0.01 level (2-tailed).
In the above table, we observed that the correlation coefficient is 0.653, which is highly positive. So, we may
say that there is a relationship between them.
(d) Co-relation of Boys between of Assamese Medium and English Medium Schools in case of positive attitude
                                                  Mean Std. Deviation            N
                                 Assamese
                                                36.56        7.736                 25
                                 Medium


                                                                                                        1836 | P a g e
Ranjana Chowdhury, Amitabha Barua / International Journal of Engineering Research and
                Applications (IJERA) ISSN: 2248-9622 www.ijera.com
                 Vol. 2, Issue 5, September- October 2012, pp.1831-1838
                                  English
                                                 37.44      6.185                    25
                                  Medium
Correlations

                                                                      BOYS_A          BOYS_E
                                     Pearson Correlation              1               .927(**)
                       Assamese
                                     Sig. (2-tailed)                  .               .000
                       Medium
                                     N                                25              25
                                     Pearson Correlation              .927(**)        1
                       English
                                     Sig. (2-tailed)                  .000            .
                       Medium
                                     N                                25              25
                          ** Correlation is significant at the 0.01 level (2-tailed).
In the above table, we observed that the correlation coefficient is 0.927, which is highly positive. So, we may
say that there is a relationship between them
(e) Correlations between Assamese and English medium school in case of positive attitude
Descriptive Statistics
                                                           Mean Std. Deviation        N
                                         Assamese
                                                           72.08    12.997                   25
                                         medium
                                         English
                                                           76.76    12.778                   25
                                         medium

Correlations
                                                                                 TOTAL_A          TOTAL_E
                          Pearson Correlation                                    1                .874(**)
                          Sig. (2-tailed)                                        .                .000
          Assamese
                          Sum of Squares and Cross-products                      4053.840         3484.480
          medium
                          Covariance                                             168.910          145.187
                          N                                                      25               25
                          Pearson Correlation                                    .874(**)         1
                          Sig. (2-tailed)                                        .000             .
          English
                          Sum of Squares and Cross-products                      3484.480         3918.560
          medium
                          Covariance                                             145.187          163.273
                          N                                                      25               25
          ** Correlation is significant at the 0.01 level (2-tailed).

In the above table, we observed that the correlation coefficient is 0.874, which is highly positive. So, we may
say that there is a relationship between them
(f) Correlations between boys and girls of Assamese and English medium schools in case of positive
attitude
Descriptive Statistics
                                               Mean Std. Deviation          N
                                 Total girl        74.84     11.721                   25
                                 Total boys        74.00     13.669                   25


                                                                                                            1837 | P a g e
Ranjana Chowdhury, Amitabha Barua / International Journal of Engineering Research and
                Applications (IJERA) ISSN: 2248-9622 www.ijera.com
                 Vol. 2, Issue 5, September- October 2012, pp.1831-1838
Correlations
                                                                           TOTAL_G       TOTAL_B
                          Pearson Correlation                              1             .931(**)
                          Sig. (2-tailed)                                  .             .000
          Total girl      Sum of Squares and Cross-products                3297.360      3580.000
                          Covariance                                       137.390       149.167
                          N                                                25            25
                          Pearson Correlation                              .931(**)      1
                          Sig. (2-tailed)                                  .000          .
          Total boys      Sum of Squares and Cross-products                3580.000      4484.000
                          Covariance                                       149.167       186.833
                          N                                                25            25
          ** Correlation is significant at the 0.01 level (2-tailed).

          In the above table, we observed that the               9.     Watt, H.M.G.; Pekrun, R.; Goetz, T and
correlation coefficient is 0.931, which is highly                       Frenzel A.C. (2010): Development of
positive. So, we may say that there is a relationship                   mathematics Interest in Adolescence :
between them                                                            Influences of Gender, Family and School
                                                                        Context, Journal of Research on
References                                                              Adolescence, 20 (2), pp 507- 537 .
  1.     Alkon, I.R. , (1970): Non ineffective
         variables and mathematics achievement,
         Direction for Research, Journal of School
         Psychology, 8, pp 28- 36
  2.     Aikon , I. R. (1976): Update on attitude and
         other effective      variables in learning
         mathematics, Review of Educational
         Research 46, pp 293-311 .
  3.     Best, John W. and Kahn, James V. (1996) :
         Research in Education, 7th Edition, New
         Delhi, Prentice Hall of India Pvt Ltd.
  4.     Burak M. J. (1975) : Investigation about
         casual predominance in the relationship
         between mathematics achievement and
         attitude toward mathematics, ( Doctoral
         dissertation , Boston College, 1975),
         Dissertation Abstracts International 36 ,
         2155
  5.     Collaham W.J. (1971) :Adolescent attitude
         towards      mathematics,      Mathematics
         Teachers 64, pp 751- 755 .
  6..    Deci, E. L. (1992): The relation of interest
         to the motivation of behavior, A self-
         determination theory perspective. , New
         Jersey : Lawrence Eribaum Associates, pp
         43-70
  7.     Hidi, S. and Renninger, K. A. (2006): The
         Four-Phase model of interest development,
         Educational Psychologist, 41 (2), pp 111-
         127 .cation, Indian journal of Mathematics
         Education, Vol 16, 1996
  8.     Schiefele,U. (1991): interest , Learning,
         and Motivation, Educational Psychologist,
         26 (3 and 4), pp 299- 323


                                                                                                   1838 | P a g e

More Related Content

What's hot

mathematics and intelligence
mathematics and intelligencemathematics and intelligence
mathematics and intelligenceAbuta Ogeto
 
7103449 dislike-of-math-thesis-final-version
7103449 dislike-of-math-thesis-final-version7103449 dislike-of-math-thesis-final-version
7103449 dislike-of-math-thesis-final-versionFranco Yumul
 
Innovative Teaching Methods Used by the Teachers (A cover page and table of c...
Innovative Teaching Methods Used by the Teachers (A cover page and table of c...Innovative Teaching Methods Used by the Teachers (A cover page and table of c...
Innovative Teaching Methods Used by the Teachers (A cover page and table of c...Imie Omamalin
 
Vol 13 No 1 - August 2015
Vol 13 No 1 - August 2015Vol 13 No 1 - August 2015
Vol 13 No 1 - August 2015ijlterorg
 
Teachers` gender and primary school pupils` achievement in mathematics in kenya
Teachers` gender and primary school pupils` achievement in mathematics in kenyaTeachers` gender and primary school pupils` achievement in mathematics in kenya
Teachers` gender and primary school pupils` achievement in mathematics in kenyaAlexander Decker
 
mathematics efficacy, anxiety and students performance in introductory techno...
mathematics efficacy, anxiety and students performance in introductory techno...mathematics efficacy, anxiety and students performance in introductory techno...
mathematics efficacy, anxiety and students performance in introductory techno...mustapha adeniyi
 
Supporting STEM Education in Secondary Science Contexts
Supporting STEM Education in Secondary Science ContextsSupporting STEM Education in Secondary Science Contexts
Supporting STEM Education in Secondary Science ContextsRiska Ria Lestari
 
A causal model of selected non cognitive learner’s variables and achievement ...
A causal model of selected non cognitive learner’s variables and achievement ...A causal model of selected non cognitive learner’s variables and achievement ...
A causal model of selected non cognitive learner’s variables and achievement ...Alexander Decker
 
AN IN-DEPTH ANALYSIS OF THE COGNITIVE AND METACOGNITIVE DIMENSIONS OF AFRICAN...
AN IN-DEPTH ANALYSIS OF THE COGNITIVE AND METACOGNITIVE DIMENSIONS OF AFRICAN...AN IN-DEPTH ANALYSIS OF THE COGNITIVE AND METACOGNITIVE DIMENSIONS OF AFRICAN...
AN IN-DEPTH ANALYSIS OF THE COGNITIVE AND METACOGNITIVE DIMENSIONS OF AFRICAN...William Kritsonis
 
Research in didactics of mathematics
Research in didactics of mathematicsResearch in didactics of mathematics
Research in didactics of mathematicsifi8106tlu
 

What's hot (15)

mathematics and intelligence
mathematics and intelligencemathematics and intelligence
mathematics and intelligence
 
7103449 dislike-of-math-thesis-final-version
7103449 dislike-of-math-thesis-final-version7103449 dislike-of-math-thesis-final-version
7103449 dislike-of-math-thesis-final-version
 
Innovative Teaching Methods Used by the Teachers (A cover page and table of c...
Innovative Teaching Methods Used by the Teachers (A cover page and table of c...Innovative Teaching Methods Used by the Teachers (A cover page and table of c...
Innovative Teaching Methods Used by the Teachers (A cover page and table of c...
 
Chapter 1 done editing
Chapter 1 done editingChapter 1 done editing
Chapter 1 done editing
 
Abstract
AbstractAbstract
Abstract
 
Vol 13 No 1 - August 2015
Vol 13 No 1 - August 2015Vol 13 No 1 - August 2015
Vol 13 No 1 - August 2015
 
Final na final thesis
Final na final thesisFinal na final thesis
Final na final thesis
 
Teachers` gender and primary school pupils` achievement in mathematics in kenya
Teachers` gender and primary school pupils` achievement in mathematics in kenyaTeachers` gender and primary school pupils` achievement in mathematics in kenya
Teachers` gender and primary school pupils` achievement in mathematics in kenya
 
The effect of mathematics anxiety on the achievement of middle school student...
The effect of mathematics anxiety on the achievement of middle school student...The effect of mathematics anxiety on the achievement of middle school student...
The effect of mathematics anxiety on the achievement of middle school student...
 
mathematics efficacy, anxiety and students performance in introductory techno...
mathematics efficacy, anxiety and students performance in introductory techno...mathematics efficacy, anxiety and students performance in introductory techno...
mathematics efficacy, anxiety and students performance in introductory techno...
 
Supporting STEM Education in Secondary Science Contexts
Supporting STEM Education in Secondary Science ContextsSupporting STEM Education in Secondary Science Contexts
Supporting STEM Education in Secondary Science Contexts
 
A causal model of selected non cognitive learner’s variables and achievement ...
A causal model of selected non cognitive learner’s variables and achievement ...A causal model of selected non cognitive learner’s variables and achievement ...
A causal model of selected non cognitive learner’s variables and achievement ...
 
AN IN-DEPTH ANALYSIS OF THE COGNITIVE AND METACOGNITIVE DIMENSIONS OF AFRICAN...
AN IN-DEPTH ANALYSIS OF THE COGNITIVE AND METACOGNITIVE DIMENSIONS OF AFRICAN...AN IN-DEPTH ANALYSIS OF THE COGNITIVE AND METACOGNITIVE DIMENSIONS OF AFRICAN...
AN IN-DEPTH ANALYSIS OF THE COGNITIVE AND METACOGNITIVE DIMENSIONS OF AFRICAN...
 
Math cg
Math cgMath cg
Math cg
 
Research in didactics of mathematics
Research in didactics of mathematicsResearch in didactics of mathematics
Research in didactics of mathematics
 

Viewers also liked (20)

J25043046
J25043046J25043046
J25043046
 
Kk2518251830
Kk2518251830Kk2518251830
Kk2518251830
 
Ig2514781484
Ig2514781484Ig2514781484
Ig2514781484
 
Jo2516951697
Jo2516951697Jo2516951697
Jo2516951697
 
Ka2517671771
Ka2517671771Ka2517671771
Ka2517671771
 
Kg2518001805
Kg2518001805Kg2518001805
Kg2518001805
 
Kb2517721780
Kb2517721780Kb2517721780
Kb2517721780
 
Ju2517321735
Ju2517321735Ju2517321735
Ju2517321735
 
Jy2517561760
Jy2517561760Jy2517561760
Jy2517561760
 
Ke2517881796
Ke2517881796Ke2517881796
Ke2517881796
 
Kq2518641868
Kq2518641868Kq2518641868
Kq2518641868
 
Jf2516311637
Jf2516311637Jf2516311637
Jf2516311637
 
Kn2518431847
Kn2518431847Kn2518431847
Kn2518431847
 
Kt2518841887
Kt2518841887Kt2518841887
Kt2518841887
 
Jx2517481755
Jx2517481755Jx2517481755
Jx2517481755
 
Ib2514451452
Ib2514451452Ib2514451452
Ib2514451452
 
Bx31498502
Bx31498502Bx31498502
Bx31498502
 
Bs31473481
Bs31473481Bs31473481
Bs31473481
 
Dd31720725
Dd31720725Dd31720725
Dd31720725
 
Ibope - junho 2014
Ibope - junho 2014Ibope - junho 2014
Ibope - junho 2014
 

Similar to Kl2518311838

Finalnafinalthesis 100513074602-phpapp02 (1)
Finalnafinalthesis 100513074602-phpapp02 (1)Finalnafinalthesis 100513074602-phpapp02 (1)
Finalnafinalthesis 100513074602-phpapp02 (1)Vhanny Atanacio
 
Attitudes And Perceptions Towards Mathematics By Greek Engineering Students A...
Attitudes And Perceptions Towards Mathematics By Greek Engineering Students A...Attitudes And Perceptions Towards Mathematics By Greek Engineering Students A...
Attitudes And Perceptions Towards Mathematics By Greek Engineering Students A...Christine Williams
 
My Thesis (Draft 1) August 23, 2017 8:53pm
My Thesis (Draft 1) August 23, 2017 8:53pmMy Thesis (Draft 1) August 23, 2017 8:53pm
My Thesis (Draft 1) August 23, 2017 8:53pmRigino Macunay Jr.
 
Students and teachers’ views of difficult areas in mathematics syllabus
Students and teachers’ views of difficult areas in mathematics syllabusStudents and teachers’ views of difficult areas in mathematics syllabus
Students and teachers’ views of difficult areas in mathematics syllabusAlexander Decker
 
International Journal of Computational Engineering Research(IJCER)
 International Journal of Computational Engineering Research(IJCER)  International Journal of Computational Engineering Research(IJCER)
International Journal of Computational Engineering Research(IJCER) ijceronline
 
Welcome to International Journal of Engineering Research and Development (IJERD)
Welcome to International Journal of Engineering Research and Development (IJERD)Welcome to International Journal of Engineering Research and Development (IJERD)
Welcome to International Journal of Engineering Research and Development (IJERD)IJERD Editor
 
THE EFFECT OF POOR PERFORMANCE IN MATHEMATICS TO_054548.pptx
THE EFFECT OF POOR PERFORMANCE IN MATHEMATICS TO_054548.pptxTHE EFFECT OF POOR PERFORMANCE IN MATHEMATICS TO_054548.pptx
THE EFFECT OF POOR PERFORMANCE IN MATHEMATICS TO_054548.pptxKeanMagallon
 
Group 4 Power Point Presentation Chapter 1-5.pptx
Group 4 Power Point Presentation Chapter 1-5.pptxGroup 4 Power Point Presentation Chapter 1-5.pptx
Group 4 Power Point Presentation Chapter 1-5.pptxLaikaMaeCasilan
 
Finalnafinalthesis 100513074602-phpapp02
Finalnafinalthesis 100513074602-phpapp02Finalnafinalthesis 100513074602-phpapp02
Finalnafinalthesis 100513074602-phpapp02CHrizabel FLores
 
Assessing Students Understanding Of The Measures Of Central Tendency And Att...
Assessing Students  Understanding Of The Measures Of Central Tendency And Att...Assessing Students  Understanding Of The Measures Of Central Tendency And Att...
Assessing Students Understanding Of The Measures Of Central Tendency And Att...Scott Donald
 
An Analysis Of Knowledge In STEM Solving Algebraic Problems
An Analysis Of Knowledge In STEM  Solving Algebraic ProblemsAn Analysis Of Knowledge In STEM  Solving Algebraic Problems
An Analysis Of Knowledge In STEM Solving Algebraic ProblemsAmy Isleb
 
Guided discovery learning strategy and senior school students performance in ...
Guided discovery learning strategy and senior school students performance in ...Guided discovery learning strategy and senior school students performance in ...
Guided discovery learning strategy and senior school students performance in ...Alexander Decker
 
Students’ Perceptions and Attitude towards Mathematics Learning
Students’ Perceptions and Attitude towards Mathematics LearningStudents’ Perceptions and Attitude towards Mathematics Learning
Students’ Perceptions and Attitude towards Mathematics Learningijtsrd
 
A Study on Interest in Mathematics Interest and its Relation to Academic Achi...
A Study on Interest in Mathematics Interest and its Relation to Academic Achi...A Study on Interest in Mathematics Interest and its Relation to Academic Achi...
A Study on Interest in Mathematics Interest and its Relation to Academic Achi...ijtsrd
 

Similar to Kl2518311838 (20)

Finalnafinalthesis 100513074602-phpapp02 (1)
Finalnafinalthesis 100513074602-phpapp02 (1)Finalnafinalthesis 100513074602-phpapp02 (1)
Finalnafinalthesis 100513074602-phpapp02 (1)
 
Attitudes And Perceptions Towards Mathematics By Greek Engineering Students A...
Attitudes And Perceptions Towards Mathematics By Greek Engineering Students A...Attitudes And Perceptions Towards Mathematics By Greek Engineering Students A...
Attitudes And Perceptions Towards Mathematics By Greek Engineering Students A...
 
Chapters 1 5
Chapters 1 5Chapters 1 5
Chapters 1 5
 
October4,2010 jen thesis
October4,2010 jen thesisOctober4,2010 jen thesis
October4,2010 jen thesis
 
Final thesis-jen
Final thesis-jenFinal thesis-jen
Final thesis-jen
 
My Thesis (Draft 1) August 23, 2017 8:53pm
My Thesis (Draft 1) August 23, 2017 8:53pmMy Thesis (Draft 1) August 23, 2017 8:53pm
My Thesis (Draft 1) August 23, 2017 8:53pm
 
thesis-jen edit
 thesis-jen edit thesis-jen edit
thesis-jen edit
 
Students and teachers’ views of difficult areas in mathematics syllabus
Students and teachers’ views of difficult areas in mathematics syllabusStudents and teachers’ views of difficult areas in mathematics syllabus
Students and teachers’ views of difficult areas in mathematics syllabus
 
International Journal of Computational Engineering Research(IJCER)
 International Journal of Computational Engineering Research(IJCER)  International Journal of Computational Engineering Research(IJCER)
International Journal of Computational Engineering Research(IJCER)
 
Welcome to International Journal of Engineering Research and Development (IJERD)
Welcome to International Journal of Engineering Research and Development (IJERD)Welcome to International Journal of Engineering Research and Development (IJERD)
Welcome to International Journal of Engineering Research and Development (IJERD)
 
THE EFFECT OF POOR PERFORMANCE IN MATHEMATICS TO_054548.pptx
THE EFFECT OF POOR PERFORMANCE IN MATHEMATICS TO_054548.pptxTHE EFFECT OF POOR PERFORMANCE IN MATHEMATICS TO_054548.pptx
THE EFFECT OF POOR PERFORMANCE IN MATHEMATICS TO_054548.pptx
 
Group 4 Power Point Presentation Chapter 1-5.pptx
Group 4 Power Point Presentation Chapter 1-5.pptxGroup 4 Power Point Presentation Chapter 1-5.pptx
Group 4 Power Point Presentation Chapter 1-5.pptx
 
Misapprehension of mathematics among teachers, parents, and elementary schoo...
Misapprehension of mathematics among teachers, parents, and  elementary schoo...Misapprehension of mathematics among teachers, parents, and  elementary schoo...
Misapprehension of mathematics among teachers, parents, and elementary schoo...
 
Finalnafinalthesis 100513074602-phpapp02
Finalnafinalthesis 100513074602-phpapp02Finalnafinalthesis 100513074602-phpapp02
Finalnafinalthesis 100513074602-phpapp02
 
Assessing Students Understanding Of The Measures Of Central Tendency And Att...
Assessing Students  Understanding Of The Measures Of Central Tendency And Att...Assessing Students  Understanding Of The Measures Of Central Tendency And Att...
Assessing Students Understanding Of The Measures Of Central Tendency And Att...
 
An Analysis Of Knowledge In STEM Solving Algebraic Problems
An Analysis Of Knowledge In STEM  Solving Algebraic ProblemsAn Analysis Of Knowledge In STEM  Solving Algebraic Problems
An Analysis Of Knowledge In STEM Solving Algebraic Problems
 
Guided discovery learning strategy and senior school students performance in ...
Guided discovery learning strategy and senior school students performance in ...Guided discovery learning strategy and senior school students performance in ...
Guided discovery learning strategy and senior school students performance in ...
 
Students’ Perceptions and Attitude towards Mathematics Learning
Students’ Perceptions and Attitude towards Mathematics LearningStudents’ Perceptions and Attitude towards Mathematics Learning
Students’ Perceptions and Attitude towards Mathematics Learning
 
A Study on Interest in Mathematics Interest and its Relation to Academic Achi...
A Study on Interest in Mathematics Interest and its Relation to Academic Achi...A Study on Interest in Mathematics Interest and its Relation to Academic Achi...
A Study on Interest in Mathematics Interest and its Relation to Academic Achi...
 
Towards a Comprehensive Conception of Mathematical Proof
Towards a Comprehensive Conception of Mathematical ProofTowards a Comprehensive Conception of Mathematical Proof
Towards a Comprehensive Conception of Mathematical Proof
 

Kl2518311838

  • 1. Ranjana Chowdhury, Amitabha Barua / International Journal of Engineering Research and Applications (IJERA) ISSN: 2248-9622 www.ijera.com Vol. 2, Issue 5, September- October 2012, pp.1831-1838 Identification Of Some Of The Factors In The Formation Of Attitude Towards Mathematics Ranjana Chowdhury, Amitabha Barua Department of Computer Application Assam Engineering College Guwahati 781013, Assam Abstract This paper reveals the results of the Council of Teachers of Mathematics (1989) and investigation carried out to study some sort of National Research Council have urged educationists possible relationship that might occur in case of of the country to incorporate effective factors in the formation of attitude towards mathematics and cognitive domain of school children, [ 1,4,5,6,10] . to find the factors that are responsible for the It appears sometimes that brilliant students purpose . The investigation mainly deals with possess a good attitude towards learning “attitude - factors” related to parents together mathematics. But the same has not yet been fully with the medium of instruction and also and scientifically established. It is also observed that considering “sex- factors” as another one . For researchers in India and abroad give much emphasis this purpose, a sample of two hundred secondary on the relationship between attitude towards school students have been chosen so as to study mathematics (ATM) and achievements in such relation where the variables are chosen mathematics (AIM). above – type of “ attitude factors” together with the others mentioned above .The correlation 2. Significance of Study technique and “ t- statistics” are playing key role Some of the studies in this area are mentioned in our investigation . and thereby we estimate below: direct and indirect influence of independent Pinkrah’s, in the year 1989 studied about variables on the dependent one .Interestingly, we pupils „„Attitude towards understanding find the direct effect on the formation of attitude mathematics‟‟ and revealed that, enjoyment with towards mathematics. mathematics and liking of mathematics were Key words: Attitude –factors Statistical Correlation stronger determinants for learning the subject with / t- test less difficulty. 1. Introduction Armstrong, in the year 1993 conducted a We all know that from the time of antiquity descriptive study of the „„interrelationship of parent, mathematics has been playing a vital role in teacher and student attitude towards mathematics upgrading human culture and civilization in addition and school achievement of selected eight grade to developing science and technology. Its use in students in the Inglewood Unified School District.‟‟ expanding human knowledge and thought is A significant relationship was found between immense. For over all uplift of the human society, attitude towards mathematics of students and the mankind needs skilled and trained persons in parents, but not of students and their mathematics mathematics. Mathematics has through the ages, teachers. produced men of quality. E.T.Bell, in his books Men of Mathematics, observes- “As a group the Pal, A. in the year 1989 considered „„the great mathematicians have been men of all round dependence of achievement in mathematics on four ability, vigorous, alert, keenly interested in many variables of the effective dimension viz. (i) self things outside mathematics. . concept, (ii) anxiety, (iii) attitude and (iv) academic However, now a day instead of getting motivation‟‟. increasingly interested in learning mathematics, our He formulated 56 hypotheses with these school students have been found lacking in aptitude variables and classified the students into urban, to be As such it has become the necessity of the semi-urban and rural and male and female groups. hour to identify the causes responsible for large He found the regression equation to predict the scale failures in the subject. Otherwise within a performance in mathematics as a linear combination short span of time, skilful and trained persons in of the four affective variables. mathematics will vanish from our country. It will then be a disaster for us. Chel in the year 1990 in his study A number of researchers in India and examined „„the problem of underachievement in abroad have investigated into the relationship compulsory mathematics in Madhyamic between the effective and the cognitive domains of Examination of West Bengal‟‟. He found the teaching and learning mathematics. National following causes responsible for underachievement: 1831 | P a g e
  • 2. Ranjana Chowdhury, Amitabha Barua / International Journal of Engineering Research and Applications (IJERA) ISSN: 2248-9622 www.ijera.com Vol. 2, Issue 5, September- October 2012, pp.1831-1838 (i) Gaps in knowledge of mathematics concepts. examining the responses of 545 students. The data (ii) Difficulties in understanding mathematical represent all grade levels and subject of the language. secondary mathematics curriculum. This reliability (iii) Lack of openness and flexibility in teaching. coefficient alpha was ·97. A maximum likelihood (iv) Difficulties in mathematization of verbal factor analysis with a varimax rotation yielded four problems and interpretation of mathematical results. factors; self-confidence; value of mathematics; (v) Abstract nature of mathematics. enjoyment of mathematics; and motivation. (vi) Fear and anxiety on the part of the students. Psychometric properties were sound and the The study suggests greater motivation of instrument. Attitude toward Mathematics Inventory the students for learning mathematics, removal of (ATMI), can be recommended for use in the fear of mathematics and clearer presentation of investigation of students‟ ATM subject based on the need of the children. Pierce, R., Stacy, K., Borkortsas, A., in the year Rosaly, A., in the year 1992 had studied on „„the 2005 studied about “A scale for monitoring relationship between attitude of students towards student‟s attitudes to learning mathematics with mathematics and achievement.‟‟ The investigator technology.” This paper presents a model of how showed the following major findings: technology use can enhance mathematics (i)The attitude of high school students towards achievement, a review of other instruments and a learning mathematics and their achievement in psychometric analysis of the MTAS. It also reports mathematics were related. the responses of 350 students from six schools to (ii)Urban girls had a more positive attitude towards demonstrate the power of the MTAS to provide mathematics. Similarly, urban boys had a more useful insights for teacher and researchers. „Attitude positive attitude towards mathematics than rural to learning mathematics with technology‟ had a boys. wider range of scores from other variables studied. (iii)Girls were higher than boys in their For boys, this attitude is correlated only with achievement in mathematics. confidence in using technology, but for girls the (iv)Urban girls were higher than rural boys in only relationship found was a negative correlation mathematics . with mathematics confidence. These difference need Hariharan, D., in the year 1992 studied on „„the to be taken into account when planning instruction, [ attitude of high school students towards home work 2, 3, 4, 7, 8, 9 ] .. and their achievement in mathematics.‟‟ It is observed that though achievement in The following were showed in his thesis: mathematics seems to be positively related to (i)Girls were higher than boys in their attitude attitude towards mathematics, but little effort has towards home work. been made to investigate how that attitude is (ii)Urban students were students were higher than formed. rural students in their attitude towards home work. 3. Problems of the Investigation: (iii)Private school attitude students were higher In this study we want to identify some of than the government school students in their the factors responsible for formation of attitude of attitude towards home work. the pupils in secondary stage towards mathematics It is observed that though achievement in in relation to 1. home environment, 2. father‟s mathematics seems to be positively related to attitude towards mathematics, 3. mother‟s attitude attitude towards mathematics. But little effort has towards mathematics, 4. pupils achievement in been made to investigate how that attitude is mathematics in school internal examinations, 5. formed. medium of instruction, 6. class environment, 7. Mohammad Miyan in a trend report Survey of some social factors, 8. sex. Research in Mathematics Education edited by Buch Objective of the Study: remarks “Though attitude towards mathematics 1. To enquire into the relationship between attitude seems to be positively related to achievement, no towards mathematics and achievement in effort has been made to investigate how that attitude mathematics. is formed” . We through this study 2. To investigate into the relationship between home want to identify some of the factors responsible for environment and attitude towards mathematics. formation of attitude towards mathematics and 3. To identify relationship between father‟s attitude select the following topic for the present study. towards mathematics and pupil‟s attitude towards Tapia, M., Marsh II, George E., in the year 2004 mathematics. in the Academic Exchange Quarterly, Vol. 8, and 4. To identify relationship between mother‟s attitude Issue 2 studied about “An instrument to measure towards mathematics and pupil‟s attitude towards mathematics attitudes.” This research paper to mathematics. reports of the development of a new instrument to 5. To investigate the relationship between attitude measure students‟ ATM, and to determine the towards mathematics and pupils of Assamese and underlying dimensions of the instrument by English medium schools. 1832 | P a g e
  • 3. Ranjana Chowdhury, Amitabha Barua / International Journal of Engineering Research and Applications (IJERA) ISSN: 2248-9622 www.ijera.com Vol. 2, Issue 5, September- October 2012, pp.1831-1838 6. To establish a relationship between classroom schools from the population of standard environment and attitude towards mathematics. VIII of secondary schools of Greater Guwahati of 7. To establish a relationship between pupils belief Assam. about mathematics and attitude towards mathematics. 8. To study the attitude towards mathematics as a c. Tools to be used in the collection of data function of sex. To measure the variables undertaken and to collect the data for the study, the researcher intends Hypotheses: to use the following tools. We formulate the following hypotheses for the (i) Attitude scale towards mathematics to measure present study– the attitude towards mathematics of the pupil. H1 :There is no significant relationship (ii)To enquire about the home environment and between attitude towards mathematics and parent‟s attitude towards mathematics. achievement in mathematics of the From the parents a questionnaire is constructed in pupil. the following steps. H2 : There is no significant relationship To know the status of parents & their (a) between home environment and development of occupation, (b) educational qualification, (c) attitude towards mathematics. attitude towards mathematics. It is for guardians H3 :There is no significant relationship also for home environment. between father‟s attitude towards mathematics and (iii)To enquire about the classroom environment a pupil‟s attitude towards mathematics. questionnaire on classroom environment is H4 :There is no significant relationship constructed. between mother‟s attitude towards mathematics and (iv)To assess achievement in mathematics each pupil‟s attitude towards mathematics. pupil, data will be collected from the records of H5 :There is no significant difference between school annual examinations for promotion from the attitude towards mathematics of pupils of standard VIII to standard IX. English and Assamese medium schools. H6 :There is no significant difference between 5. System of Analysis of Data: the classroom environment and attitude towards In order to draw fruitful outcomes and mathematics. derive effective measures, the data are analysed by H7 :There is no significant relationship using sophisticated statistical methods and formulae, between attitude towards mathematics and their viz., skewness, kurtosis, correlation, regression belief about mathematics. analysis, normal distribution, binomial distribution, H8 :There is no significant relationship etc. and their graphical representation. For validity between attitude towards mathematics and sex of the and consistency, we use Hypothesis testing theory, pupils. Estimation theory, and Non-parametric tests. Linear & non-linear programming, numerical analysis & 4. Research Design and Methodology: computation will be another useful tool for our a. Sampling effective investigation. (i) Sampling space: The study will be conducted in Software Used: Greater Guwahati of Assam. SPSS (Statistical Package for Social Science), (ii) Sample: The sample consists of students of Version 13.0 standard VIII, their respective parents and guardians. 6. RESULTS & DISCUSSIONS 1(a) Positive attitude of Boys in Assamese Medium b. Selection of samples Schools We intend to use normative survey method N Mean Std. Deviation Std. Error Mean for the present study. For this purpose it is targeted to select a sample of 250 boys and 250 girls from Boys 25 36.56 7.736 1.547 both English and Assamese medium secondary Test Value = 25 95% Confidence Interval of the Difference t df Sig. (2-tailed) Mean Difference Lower Upper Assamese Medium 7.472 24 .000 11.56 8.37 14.75 Boys student 1833 | P a g e
  • 4. Ranjana Chowdhury, Amitabha Barua / International Journal of Engineering Research and Applications (IJERA) ISSN: 2248-9622 www.ijera.com Vol. 2, Issue 5, September- October 2012, pp.1831-1838 N Mean Std. Deviation Std. Error Mean In the above table the level of Significance (LOS) is 5%. Since, here calculated value of |t| > t0.05 Girls 25 35.52 6.001 1.200 (=2.26), so it is highly significant. Thus the Assamese medium boys have a positive attitude in the subject mathematics. (b) Positive attitude of Girls in Assamese Medium Schools Test Value = 25 95% Confidence Interval of the Difference t df Sig. (2-tailed) Mean Difference Lower Upper Assamese Medium 8.765 24 .000 10.52 8.04 13.00 Girls student Schools In the above table the level of Significance (LOS) is 5%. Since, here calculated value of |t| > t0.05 N Mean Std. Deviation Std. Error Mean (=2.26), so it is highly significant. Thus the Assamese medium girls have a positive attitude in Boys 25 37.44 6.185 1.237 the subject mathematics. © Positive attitude of Boys in English Medium Test Value = 25 95% Confidence Interval of the Difference t df Sig. (2-tailed) Mean Difference Lower Upper Englis Medium 10.401 24 .000 14.32 11.48 17.16 Girls student In the above table the level of Significance (d) Positive attitude of Girls in English Medium (LOS) is 5%. Since, here calculated value Schools of |t| > t0.05 (=2.26), so it is highly N Mean Std. Deviation Std. Error Mean significant. Thus the English medium boys have a positive attitude in the subject Girls 25 39.32 6.884 1.377 mathematics. Test Value = 25 95% Confidence Interval of the Difference t df Sig. (2-tailed) Mean Difference Lower Upper English Medium 10.056 24 .000 12.44 9.89 14.99 Boys student One-Sample Statistics (sample size each case 100) In the above table the level of Significance (LOS) is N Mean Std. Deviation Std. Error Mean 5%. Since, here calculated value of |t| > t0.05 (=2.26), so it is highly significant. Thus the English Assamese Medium 25 72.08 12.997 2.599 medium girls have a positive attitude in the subject English Medium 25 76.76 12.778 2.556 mathematics. One-Sample Test (e) Medium wise t-Test for positive attitude 1834 | P a g e
  • 5. Ranjana Chowdhury, Amitabha Barua / International Journal of Engineering Research and Applications (IJERA) ISSN: 2248-9622 www.ijera.com Vol. 2, Issue 5, September- October 2012, pp.1831-1838 Test Value = 50 95% Confidence Interval of the Difference t df Sig. (2-tailed) Mean Difference Lower Upper Assamese 8.495 24 .000 22.08 16.72 27.44 Medium English 10.471 24 .000 26.76 21.49 32.03 Medium And it is also clear that the English One-Sample Statistics (sample size each case 100) medium students have better positive attitude than Std. Assamese medium students N Mean Std. Error Mean Deviation (f) Sex wise t-Test for positive attitude Girls 25 74.84 11.721 2.344 Boys 25 74.00 13.669 2.734 One-Sample Test Test Value = 50 95% Confidence Interval of the Difference t df Sig. (2-tailed) Mean Difference Lower Upper Girls 10.596 24 .000 24.84 20.00 29.68 Boys 8.779 24 .000 24.00 18.36 29.64 And it is also clear that the girls have better positive attitude than boys (g) t-Test of all boys and girls for positive attitude One-Sample Statistics (sample size 200) N Mean Std. Deviation Std. Error Mean TOTAL 25 148.84 24.951 4.990 One-Sample Test Test Value = 100 95% Confidence Interval of the Difference t df Sig. (2-tailed) Mean Difference Lower Upper TOTAL 9.787 24 .000 48.84 38.54 59.14 In the above table the level of Significance (LOS) is 5%. Since, here calculated value of |t| > t 0.05 (=2.26), so it is highly significant. 2(a) Co-relation between Boys and Girls of Assamese Medium School in case of positive attitude Mean Std. Deviation N Girls 35.52 6.001 25 Boys 36.56 7.736 25 Correlations Girls_a Boys_a Pearson Correlation 1 .787(**) Girls Sig. (2-tailed) .000 1835 | P a g e
  • 6. Ranjana Chowdhury, Amitabha Barua / International Journal of Engineering Research and Applications (IJERA) ISSN: 2248-9622 www.ijera.com Vol. 2, Issue 5, September- October 2012, pp.1831-1838 N 25 25 Pearson Correlation .787(**) 1 Boys Sig. (2-tailed) .000 N 25 25 ** Correlation is significant at the 0.01 level (2-tailed). In the above table, we observed that the correlation coefficient is 0.787, which is highly positive. So, we may say that there is a relationship between them. (b) Co-relation between Boys and Girls of English Medium Schools in case of positive attitude Mean Std. Deviation N Girls 39.32 6.884 25 Boys 37.44 6.185 25 Correlations Girls_e Boys_e Pearson Correlation 1 .911(**) Girls Sig. (2-tailed) .000 N 25 25 Pearson Correlation .911(**) 1 Boys Sig. (2-tailed) .000 N 25 25 ** Correlation is significant at the 0.01 level (2-tailed). In the above table, we observed that the correlation coefficient is 0.911, which is highly positive. So, we may say that there is a relationship between them. © Co-relation of Girls between of Assamese Medium and English Medium Schools in case of positive attitude Mean Std. Deviation N Assamese 35.52 6.001 25 Medium English 39.32 6.884 25 Medium Correlations GIRLS_A GIRLS_E Pearson Correlation 1 .653(**) Assamese Sig. (2-tailed) . .000 Medium N 25 25 Pearson Correlation .653(**) 1 English Sig. (2-tailed) .000 . Medium N 25 25 ** Correlation is significant at the 0.01 level (2-tailed). In the above table, we observed that the correlation coefficient is 0.653, which is highly positive. So, we may say that there is a relationship between them. (d) Co-relation of Boys between of Assamese Medium and English Medium Schools in case of positive attitude Mean Std. Deviation N Assamese 36.56 7.736 25 Medium 1836 | P a g e
  • 7. Ranjana Chowdhury, Amitabha Barua / International Journal of Engineering Research and Applications (IJERA) ISSN: 2248-9622 www.ijera.com Vol. 2, Issue 5, September- October 2012, pp.1831-1838 English 37.44 6.185 25 Medium Correlations BOYS_A BOYS_E Pearson Correlation 1 .927(**) Assamese Sig. (2-tailed) . .000 Medium N 25 25 Pearson Correlation .927(**) 1 English Sig. (2-tailed) .000 . Medium N 25 25 ** Correlation is significant at the 0.01 level (2-tailed). In the above table, we observed that the correlation coefficient is 0.927, which is highly positive. So, we may say that there is a relationship between them (e) Correlations between Assamese and English medium school in case of positive attitude Descriptive Statistics Mean Std. Deviation N Assamese 72.08 12.997 25 medium English 76.76 12.778 25 medium Correlations TOTAL_A TOTAL_E Pearson Correlation 1 .874(**) Sig. (2-tailed) . .000 Assamese Sum of Squares and Cross-products 4053.840 3484.480 medium Covariance 168.910 145.187 N 25 25 Pearson Correlation .874(**) 1 Sig. (2-tailed) .000 . English Sum of Squares and Cross-products 3484.480 3918.560 medium Covariance 145.187 163.273 N 25 25 ** Correlation is significant at the 0.01 level (2-tailed). In the above table, we observed that the correlation coefficient is 0.874, which is highly positive. So, we may say that there is a relationship between them (f) Correlations between boys and girls of Assamese and English medium schools in case of positive attitude Descriptive Statistics Mean Std. Deviation N Total girl 74.84 11.721 25 Total boys 74.00 13.669 25 1837 | P a g e
  • 8. Ranjana Chowdhury, Amitabha Barua / International Journal of Engineering Research and Applications (IJERA) ISSN: 2248-9622 www.ijera.com Vol. 2, Issue 5, September- October 2012, pp.1831-1838 Correlations TOTAL_G TOTAL_B Pearson Correlation 1 .931(**) Sig. (2-tailed) . .000 Total girl Sum of Squares and Cross-products 3297.360 3580.000 Covariance 137.390 149.167 N 25 25 Pearson Correlation .931(**) 1 Sig. (2-tailed) .000 . Total boys Sum of Squares and Cross-products 3580.000 4484.000 Covariance 149.167 186.833 N 25 25 ** Correlation is significant at the 0.01 level (2-tailed). In the above table, we observed that the 9. Watt, H.M.G.; Pekrun, R.; Goetz, T and correlation coefficient is 0.931, which is highly Frenzel A.C. (2010): Development of positive. So, we may say that there is a relationship mathematics Interest in Adolescence : between them Influences of Gender, Family and School Context, Journal of Research on References Adolescence, 20 (2), pp 507- 537 . 1. Alkon, I.R. , (1970): Non ineffective variables and mathematics achievement, Direction for Research, Journal of School Psychology, 8, pp 28- 36 2. Aikon , I. R. (1976): Update on attitude and other effective variables in learning mathematics, Review of Educational Research 46, pp 293-311 . 3. Best, John W. and Kahn, James V. (1996) : Research in Education, 7th Edition, New Delhi, Prentice Hall of India Pvt Ltd. 4. Burak M. J. (1975) : Investigation about casual predominance in the relationship between mathematics achievement and attitude toward mathematics, ( Doctoral dissertation , Boston College, 1975), Dissertation Abstracts International 36 , 2155 5. Collaham W.J. (1971) :Adolescent attitude towards mathematics, Mathematics Teachers 64, pp 751- 755 . 6.. Deci, E. L. (1992): The relation of interest to the motivation of behavior, A self- determination theory perspective. , New Jersey : Lawrence Eribaum Associates, pp 43-70 7. Hidi, S. and Renninger, K. A. (2006): The Four-Phase model of interest development, Educational Psychologist, 41 (2), pp 111- 127 .cation, Indian journal of Mathematics Education, Vol 16, 1996 8. Schiefele,U. (1991): interest , Learning, and Motivation, Educational Psychologist, 26 (3 and 4), pp 299- 323 1838 | P a g e