Download to read offline


![VIII
4 Radioisotope Heated Thermionic Electron Source ..............................................109
4.1 Thermionic Emission...............................................................................................109
4.2 Radioisotope.............................................................................................................107
4.3 Thermal Reductive Layer.........................................................................................111
4.4 Applications .............................................................................................................112
4.4.1 Hollow Cathode ................................................................................................112
4.4.2 Plasma Rocket Engine ......................................................................................124
Conclusion & Further Work..........................................................................................139
Conclusion ..........................................................................................................................139
Further Work.......................................................................................................................141
5 APPENDICES......................................................................................................143
Appendix A: Oopic Programming Script used to simulated the ionization process
inside the discharge chamber of the Minaka thruster .........................................................143
Appendix B: Numerical Data collected to plot the degree of ionization and thrust
density performance curves of the Minaka Thruster ..........................................................161
5.1.1 Neutral Gas Temperature = 300 C....................................................................161
5.1.2 Neutral Gas Temperature= 500C......................................................................166
5.1.3 Increasing Pressure from 1e-7 to 1e-1 [Torr] ...................................................171
References .....................................................................................................................175](https://image.slidesharecdn.com/e6658598-f681-40eb-8022-9624ff4773c2-150415072440-conversion-gate01/85/Thesis-16-320.jpg)

![X
Diagram 22 Discharge chamber filled with neutral gas being ionized from its 4 sides by
radioisotope electron currents and neutral atoms and plasma being extracted from two of
its sides......................................................................................................................................32
Diagram 23 Electron ionization cross section of Xenon (5p orbit) .........................................34
Diagram 24 Electron velocity modulation using an electrostatic field....................................35
Diagram 25 Electric breakdown at atmospheric Pressure .......................................................37
Diagram 26 Vacuum dielectric breakdown .............................................................................37
Diagram 27 Breakdown voltage in xenon as a function of the product (p.d) [34] ..................39
Diagram 28 Thrust and degree of ionization achieved by for different numbers of
ionizing sides as a function of the discharge chamber length ..................................................47
Diagram 29 Thrust and degree of ionization achieved by for different numbers
of ionizing sides as a function of the discharge chamber length ..............................................47
Diagram 30 Thrust and degree of ionization achieved by for different numbers
of ionizing sides as a function of the discharge chamber length ..............................................48
Diagram 31 Thrust and degree of ionization achieved by for different numbers of
ionizing sides as a function of the discharge chamber length ..................................................48
Diagram 32 Thrust and degree of ionization achieved by for different numbers of
ionizing sides as a function of the discharge chamber length ..................................................49
Diagram 33 Thrust and degree of ionization achieved by for different numbers
of ionizing sides as a function of the discharge chamber length ..............................................49
Diagram 34 Thrust and degree of ionization achieved by for different numbers
of ionizing sides as a function of the discharge chamber length ..............................................50
Diagram 35 Thrust and degree of ionization achieved by for different numbers
of ionizing sides as a function of the discharge chamber length..............................................50
Diagram 36 Thrust and degree of ionization achieved by for different numbers
of ionizing sides as a function of the discharge chamber length ..............................................51
Diagram 37 Thrust and degree of ionization achieved by for different numbers
of ionizing sides as a function of the discharge chamber length ..............................................51](https://image.slidesharecdn.com/e6658598-f681-40eb-8022-9624ff4773c2-150415072440-conversion-gate01/85/Thesis-18-320.jpg)


![XV
Diagram 92 Power Configuration and geometry of a Radioisotope Electron Source
(RES) ........................................................................................................................................81
Diagram 93 Geometry of a Radioisotope Propulsive Cell (RPC) based on which the
thrust, radioisotope mass and excess power densities are calculated .......................................81
Diagram 94 Operation of a Radioisotope Propulsive Cell (RPC) ...........................................82
Diagram 95 Deployment of RPC panels fitted on a communication satellite .........................83
Diagram 96 geometry of the Minaka Discharge chamber .......................................................96
Diagram 97 Example of a 2D particle diagnostic plot ............................................................97
Diagram 98 Example of a 3D particle distribution diagnostic plot .........................................97
Diagram 99 Example of a plot representing the time variation of the number of
simulated particles ....................................................................................................................98
Diagram 100 Uniform ionization pattern inside the Minaka thruster discharge chamber ....100
Diagram 101 plot of electron count over time (blue line) .....................................................101
Diagram 102 uniform ion density..........................................................................................101
Diagram 103 constant ion production rate (green line) .........................................................102
Diagram 104 variation the degree of ionization achieved by Tm-171 with discharge
chamber length using different models and at different neutral gas temperatures .................104
Diagram 105 variation the thrust density of Tm-171 with discharge chamber length
using different models and at different neutral gas temperatures ...........................................105
Diagram 106 Variation of the degree of ionization and thrust density with the neutral
gas pressure.............................................................................................................................105
Diagram 107 Exponential growth profile of the ion count in electron confined
ionization model .....................................................................................................................106
Diagram 108 Linear and uninterrupted growth profile of the electron count in electron
confined ionization model ......................................................................................................107
Diagram 109 thermionic emission of a light bulb .................................................................109
Diagram 110 Emission current density versus temperature for various cathode
materials[2] .............................................................................................................................107](https://image.slidesharecdn.com/e6658598-f681-40eb-8022-9624ff4773c2-150415072440-conversion-gate01/85/Thesis-23-320.jpg)
![XVI
Diagram 111 thermal conduction between a heat source (dark grey) and an emitter
material (light grey) through a thermal reductive layer (diagonals) of a given thickness
and thermal conductivity ........................................................................................................112
Diagram 112 Simplified representation of the emitter segment of the hollow cathode
tube and of the radioisotope heat source where the emitter length, , cathode tube, ,
and radioisotope heater diameter, , are indicated..............................................................114
Diagram 113 Schematic of a conventional[2] (a) and Kabila (b) cathode showing the
cathode tube, insert, heater enclosed and RTG module in an on/off mode enclosed in a
keeper electrode ......................................................................................................................122
Diagram 114 Electrical schematic of a conventional DC-discharge ion thruster[2] (a)
and of one using a Kabila cathode (b) with the cathode heater, keeper, RTG and
discharge power supplies........................................................................................................123
Diagram 115 Converging-diverging nozzle configuration....................................................124
Diagram 116 Schematic of the Radioisotope Heated Plasma Rocket Engine .......................126
Diagram 117 Radioisotope heated thermionic heater chamber versus the thrust
generated with different neutral gases ....................................................................................131
Diagram 118 Radioisotope heated thermionic plasma rocket engine specific impulse
versus the exhaust velocity with different neutral gases ........................................................132
Diagram B1 Ion count plot for Tn=300C Ld=1cm, macro-to-real particle=1e3 and x3=1
m .............................................................................................................................................161
Diagram B2 Ion count plot for Tn=300C Ld=2cm, macro-to-real particle=1e3 and x3=1
m .............................................................................................................................................161
Diagram B3 Ion count plot for Tn=300C Ld=3cm, macro-to-real particle=1e4 and x3=1
m .............................................................................................................................................162
Diagram B4 Ion count plot for Tn=300C Ld=4cm, macro-to-real particle=1e5 and x3=1
m .............................................................................................................................................162
Diagram B5 Ion count plot for Tn=300C Ld=5cm, macro-to-real particle=1e5 and x3=1
m .............................................................................................................................................163](https://image.slidesharecdn.com/e6658598-f681-40eb-8022-9624ff4773c2-150415072440-conversion-gate01/85/Thesis-24-320.jpg)

![XVIII
Diagram B20 Ion count plot for Tn=500C Ld=10cm, macro-to-real particle=1e6 and
x3=1 m....................................................................................................................................170
Diagram B21 Ion count plot for Tn=300C and Pres= 1e-1 [Torr] Ld=1cm, macro-to-real
particle=1e3 and x3=1 m ........................................................................................................171
Diagram B22 Ion count plot for Tn=300C and Pres= 1e-2 [Torr] Ld=1cm, macro-to-real
particle=1e3 and x3=1 m ........................................................................................................171
Diagram B23 Ion count plot for Tn=300C and Pres= 1e-3 [Torr] Ld=1cm, macro-to-real
particle=1e3 and x3=1 m ........................................................................................................172
Diagram B24 Ion count plot for Tn=300C and Pres= 1e-4 [Torr] Ld=1cm, macro-to-real
particle=1e3 and x3=1 m ........................................................................................................172
Diagram B25 Ion count plot for Tn=300C and Pres= 1e-5 [Torr] Ld=1cm, macro-to-real
particle=1e3 and x3=1 m ........................................................................................................173
Diagram B26 Ion count plot for Tn=300C and Pres= 1e-6 [Torr] Ld=1cm, macro-to-real
particle=1e3 and x3=1 m ........................................................................................................173
Diagram B27 Ion count plot for Tn=300C and Pres= 1e-7 [Torr] Ld=1cm, macro-to-real
particle=1e2 and x3=1 m ........................................................................................................174](https://image.slidesharecdn.com/e6658598-f681-40eb-8022-9624ff4773c2-150415072440-conversion-gate01/85/Thesis-26-320.jpg)
![List of Tables
Table 1 Performance characteristics of different space propulsion systems ...........................12
Table 2 Radioisotope Data.......................................................................................................46
Table 2 Radioisotope Data (continued) ...................................................................................46
Table 2 Radioisotope Data (continued) ...................................................................................47
Table 2 Radioisotope Data (continued) ...................................................................................47
Table 3 Radioisotope production processes and ease..............................................................91
Table 4 Approximate lead shielding required for radioisotope sources for
at ................................................................................................................94
Table 5 Simulation Parameters for Thulium-171 induced neutral gas ionization ...................99
Table 6 Work Function and Richardson coefficients for several cathode materials[2] ........111
Table 7 Radioisotope characteristics and lead shielding required for
radioisotope sources for a target exposure of at [39]............................109
Table 8 Thermionic emission current densities for Strontium-90, Plutonium-238 and
Curium-244 using different insert materials...........................................................................109
Table 9 Power and geometric characteristics of the NSTAR-TH15 and of the NEXIS-
MAX configurations...............................................................................................................117
Table 10 Performance characteristics of the radioisotope heated hollow cathodes when
applied to the NSTAR-TH15 and NEXIS-MAX configurations ...........................................117
Table 11 ISPs and Combustion Chamber Temperatures of Conventional Rocket
Engines [2]..............................................................................................................................125
Table 12 Data of the 1 N Hydrazine Thruster configuration [51] .........................................128
Table 13 NSTAR-TH15 Data................................................................................................128
Table 14 Noble Gas Data......................................................................................................129
Table 15 Power Related Data ................................................................................................129
Table 16 Mass Flow Rate Performances ...............................................................................129
Table 17 Power Performances ...............................................................................................131](https://image.slidesharecdn.com/e6658598-f681-40eb-8022-9624ff4773c2-150415072440-conversion-gate01/85/Thesis-27-320.jpg)


![Chapter 1 Introduction
12
Table 1 Performance characteristics of different space propulsion systems
Input Power
[
Isp [s]
Solid Rocket[1] - 300
Monopropellant Rocket[1] -
Bipropellant Rocket[1] -
Electrostatic Ion thruster [2] 0.4 - 25
Arcjet[3] 1 - 1000
Hall Thruster[2] 1.5 – 4.5
MPD[3] 1 - 1000
VASIMR[4] 200
Solid Core Nuclear Thermal Rocket[5] -
Gaseous Core Nuclear Thermal Rocket[6] -
Radioisotope (Poodle’s) Thermal Rocket[7] -
1.2 ResearchObjective
Since the end of the cold war and the birth of the aerospace industry, space has
been the most important focus and the unreachable limit of researchers all around
the world. Mankind’s ability to project itself higher, faster and deeper into space is
arguably the main cause of its greatest technical, technological and scientific
achievements. However these achievements would have been impossible if
appropriate and sophisticated propulsions systems had not been developed.
Chemical propulsion systems are used to launch spacecraft into orbit and electric
propulsion systems are used to maintain them in orbit or to fare through space.
Chemical propulsion systems burn out, within minutes, most of their fuel in order
to achieve stable orbits around the earth while electric propulsion systems can
operate for months before running out of fuel. However, these last propulsion
systems must completely rely on solar energy or onboard nuclear power sources to
continuously operate for such long periods of time. These energy sources are
limited by the size of solar panels or weight of nuclear power plants which is the
reason why energy has become one of the main limiting factors in the design of
space missions. Technical innovations which led to more energy efficient
spacecraft have so far enabled the objectives of space missions to steadily grow
more ambitious hence more energy demanding but such improvements in energy](https://image.slidesharecdn.com/e6658598-f681-40eb-8022-9624ff4773c2-150415072440-conversion-gate01/85/Thesis-46-320.jpg)
![BUAA Academic Dissertation for Doctoral
13
efficiency have their limits and their growth cannot be indefinitely sustained. A
new approach towards this energetic problem was therefore required and will now
be introduced.
1.2.1 Problematic
As previously explained energy is key in solving the space propulsion question
and the traditional approach used to tackle this energetic problem has always been
to try to achieve greater energy efficiency through optimization or innovation and
the field of ion thrusters does not make exception to that rule. The different
systems of ion thrusters have each been optimized or improved through innovation
in order to increase their performance and energetic efficiency.
Regarding hollow cathodes, it was found that optimizing the length of hollow
cathode influenced the level of energy absorption [8] and that achieving a plasma
density of the order of was required to generate intense electron beams
[9]. Hollow cathodes with large length-to-radius ratio were also found to be harder
to ignite hence would require more energy. [10]
Regarding discharge chambers, it was found that increasing the magnetic strength
of the first closed magnetic contour line of a discharge chamber reduced
Maxwellian electron diffusion and subsequent loss to the anode wall and that it
also better electrostatically confined the ion population. Increasing the strength
and minimizing the area of the magnetic cusps was also found to improve primary
electron confinement and to increase the probability of an ionization collision prior
to loss at the cusp. These modifications effectively reduced the amount of energy
required to ionize a single ion of neutral gas. [11]
Regarding the ion optics, charge exchange ions were understood to play an
important role in the acceleration grids erosion due to sputtering. [12] This erosion
process greatly reduces the system’s operating life by making it less efficiency at
converting electrical energy into ion kinetic energy.
Regarding exhaust plume, the use of ion-ion recombination process in the exhaust
plume neutralization was finally found to be rather effective because this particular](https://image.slidesharecdn.com/e6658598-f681-40eb-8022-9624ff4773c2-150415072440-conversion-gate01/85/Thesis-47-320.jpg)
![Chapter 1 Introduction
14
process takes place faster than the traditional ion-electron recombination process.
Its application could extend thrusters’ lifetime by reducing plume induced damage
and drag [13] and this reduction could maintain the overall energetic requirements
of thrusters that would otherwise have been increased because of thrusters’
reduced performances.
1.2.2 A New Approach: The Self-Sufficiency Principle
The traditional approach taken towards reducing the energy consumption of space
propulsion systems is not the only way. Another approach to tackle this problem
can be found in the Self-Sufficiency Principle.
It states that:”A self-sufficient subsystem is one that does not require others to
fulfil its purpose within its system.” Self-sufficient subsystems are very useful
because they do not require any power inputs and can even output power into their
system. A subsystem can become self-sufficient in two different ways. It can
either naturally fulfil its role hence does not require any power input from its
system or can through internal means produce enough power to support its own
operation.
Applying this approach to all the subsystems of an ion thruster would effectively
cancel the energetic requirements of those subsystems by not using any energy
while still achieving the same results. Let us now consider the electrical efficiency
equation of ion thrusters [2] given below:
(1.1)
Where is the beam power, is the total power input, is the beam current,
is the beam voltage, are other power inputs into the thrusters required to
create the thrusters beam, is the discharge power, is the power associated
with the cathode keeper, is the power associated with the neutralizer keeper
and is the power associated with the acceleration grid. It can be shown that](https://image.slidesharecdn.com/e6658598-f681-40eb-8022-9624ff4773c2-150415072440-conversion-gate01/85/Thesis-48-320.jpg)

![Chapter 1 Introduction
16
process of ion thrusters. This would just like in the case of discharge chambers
using permanent magnets for plasma containment, require no additional electrical
energetic input hence the title of this doctoral thesis, Feasibility study of
radioisotope based electron sources for space applications.
1.2.3 Literature Survey
Nuclear materials and radioisotopes have been used for a long time in space
applications and propulsion systems. Nuclear energy was envisioned to power
high thrust and high specific impulse rockets that could enable fast interplanetary
space travels but safety concerns have so far stalled their deployment in space.
[14] However, radioisotopes have already been deployed since the 1960’s in space
and earth applications. They were used as heat sources in Radioisotope Heater
Units (RHU) to provide heat from a radioactive decay for electronics and other
equipment in the cold of space, in Radioisotope Thermoelectric Generators (RTG)
to convert thermal energy from radioactive decay into electrical power for polar
bases, satellites or unmanned space probes [14], in radioisotope thermionic
converters to transform thermionic electron currents into electricity [15] and also
in thermal rockets as well in which exhaust gas was heated by direct contact with a
radioisotope heat source [16].
A concept linking the use of RTGs and Electric Space Propulsion systems, i.e.:
Radioisotope Electric Propulsion (REP) systems, has also been developed and
deployed in space. [14, 17-20].
However, no similar use of radioisotopes as electron sources for space applications
has ever been expressed nor investigated although some research fields came very
close to this present research direction:, i.e.: Hollow cathodes were once
considered as potential micro-thrusters [21], radioactive fragments were inserted
into a magneto hydrodynamic (MHD) generator to increase gas ionization [22];
the alpha particles of Curium-244 were used for direct micro and nano-newton
thrust generation [23].
The fact remains that the use of decay radioisotope based plasma generators
is an unexplored and innovative research field that was initiated by the application](https://image.slidesharecdn.com/e6658598-f681-40eb-8022-9624ff4773c2-150415072440-conversion-gate01/85/Thesis-50-320.jpg)


![BUAA Academic Dissertation for Doctoral
19
2 Background
2.1 PowerGeneration
RTGs are devices that can convert heat into electricity. There are different types of
RTG and each one of them has its own operating mode and range of electric
conversion efficiencies. Static RTGs are the simplest of all RTGs. they convert
heat into electricity using the Seebeck effect which is a typical example of
electromotive forces whereby metal plates react to a temperature gradient between
them by exchanging electron see Diagram 16.
.
Diagram 16 Radioisotope Thermoelectric Generator using the Seebeck Effect
These RTGs can reach a maximal electric conversion efficiency of 10%. Dynamic
RTGs operate following thermodynamic cycles such as the Brayton or Stirling
cycles. Gas located between the hot and cold junctions drives a piston which
motion is converted into electricity. They are the most efficient type of RTG and
can reach electric conversion efficiencies as high as 30%. Other types of RTG are
still at an early stage of development. Thermophotovoltaic RTGs for instance
operate by converting infrared photons emitted by hot metallic surfaces into
electricity. These RTGs can reach relatively good electric conversion efficiencies
and have demonstrated maximal values of up to 20%[24].](https://image.slidesharecdn.com/e6658598-f681-40eb-8022-9624ff4773c2-150415072440-conversion-gate01/85/Thesis-53-320.jpg)
![Chapter 2 Background
20
Static RTGs will be used in this study because their relative simplicity will keep
them lightweight and compact. Although electric conversion efficiencies of 6.3%
have already been reached [25] a conservative value of 5% will be used instead.
Assuming that the radioisotope specific power is known, the electric power
generated by a RTG can directly be calculated using the following equation:
(2.1)
where is the thermal conversion efficiency, is the radioisotope mass and
is the radioisotope specific heat. Radioisotope specific heats have already
been tabulated [26] but they can also be calculated using the following equation
[24] at the condition that the radioisotope in question is primarily an or
emitter:
⁄ (2.2)
where is the radioisotope decay energy, is the radioisotope decay constant,
is Avogadro’s number and is the atomic weight. The decay constant is
given by:
⁄⁄ (2.3)
where ⁄ is the half life of the radioisotope. Eq. 2.2 only provides the specific
heat generated by the decay of the mother nuclide but it should be used with great
care because some radioisotopes have highly energetic daughter nuclides and
using Eq. 2.2 would result in high inaccuracies. Lead-210, for example, has a
calculated specific heat of but its actual specific heat is times
larger, i.e.: [26], due to the highly energetic decay heat of its daughter
nuclides.](https://image.slidesharecdn.com/e6658598-f681-40eb-8022-9624ff4773c2-150415072440-conversion-gate01/85/Thesis-54-320.jpg)
![BUAA Academic Dissertation for Doctoral
21
2.2 Radiation Shielding Requirement
Some radioisotopes emit radiations when they decay and these radiations, which
can take numerous forms, i.e.: gamma and x-rays, can have a negative impact on
human physiology and can also damage spacecraft instruments as illustrated in
Diagram 17. They must therefore be attenuated down to acceptable levels using an
appropriate shielding.
Diagram 17 Radiation shielding illustration
The shielding thickness required to achieve a given shielded exposure at a certain
distance of a given radioisotope heat source can be calculated using the radiation
shielding equation [27]:
(2.4)
where is the shielded exposure, is the unshielding exposure, is the linear
attenuation coefficient and is the radiation shielding thickness. Assuming a set
shielded exposure, the unshielded exposure of a given radioisotope is given by
[28]:
(2.5)](https://image.slidesharecdn.com/e6658598-f681-40eb-8022-9624ff4773c2-150415072440-conversion-gate01/85/Thesis-55-320.jpg)
![Chapter 2 Background
22
where is the gamma factor, i.e.: the exposure of a given radionuclide from a
distance of 1 meter per unit decay, and is the equivalent activity, i.e.: the
decay rate equivalent to a certain quantity of radioisotope generating a specific
amount of thermal power. Values of the gamma factor for different radioisotopes
are readily available in the literature[29]. The equivalent activity is itself given by:
(2.6)
where is the specific activity of a radioisotope and is the equivalent
radioisotope mass, i.e.: the radioisotope mass required to generate a given amount
of thermal power. The specific activity of a radioisotope is given by:
⁄ (2.7)
and the equivalent radioisotope mass is given by:
⁄ (2.8)
where is the target thermal power that the radioisotope is supposed to
generate. The linear attenuation coefficient introduced in Eq. 2.4 is given by[27]:
(2.9)
where is the mass attenuation coefficient and is the density of the shielding
material. The mass attenuation coefficient varies as a function of the irradiation,
i.e.: X or gamma rays, energy and the selected shielding material. Values of mass](https://image.slidesharecdn.com/e6658598-f681-40eb-8022-9624ff4773c2-150415072440-conversion-gate01/85/Thesis-56-320.jpg)
![BUAA Academic Dissertation for Doctoral
23
attenuation coefficients are readily available in the literature[30, 31]. Solving Eq.
2.4 finally yields the radiation shielding thickness required to achieve a given
shielded exposure at a certain distance of a radioisotope heat source of a given
thermal power:
⁄ ⁄ (2.10)](https://image.slidesharecdn.com/e6658598-f681-40eb-8022-9624ff4773c2-150415072440-conversion-gate01/85/Thesis-57-320.jpg)


![BUAA Academic Dissertation for Doctoral
27
Diagram 19 radioisotope electron current emitted from one side of a cubic volume of
unit dimensions
3.3 ElectronVelocity.
Beta minus radioisotope electrons were assumed to convert most of their decay
energy into kinetic energy because of their extremely small inertia:
⁄ (3.5)
where is the electron particle’s mass and is its velocity. Rearranging Eq. 3.5
gives the particle velocity:
√ ⁄ (3.6)
The radioisotope decay energy may not be directly substituted to the kinetic
energy and must first be altered in order to account for the electron Maxwellian
energy distribution. A mean decay energy equivalent to a third of the radioisotope
decay energy must be used in order to calculate the velocity of decay
radioisotope electrons[32]:
⁄ (3.7)
where is the mean decay energy. Eq. 3.6 gives the velocity of particles
travelling at non relativistic velocities however many decay radioisotope
electrons travel at relativistic velocities due to their high decay energies and low
inertias. A new expression is required to calculate the velocity of electrons
travelling seemingly faster than the speed of light and the relativistic kinetic
energy equation can be used to this end. It is given by:](https://image.slidesharecdn.com/e6658598-f681-40eb-8022-9624ff4773c2-150415072440-conversion-gate01/85/Thesis-61-320.jpg)


![Chapter 3 decay radioisotope electron source
34
3.5 ElectronVelocity Modulation
The degree of ionization can be optimized by maximizing Eq. 3.20 and this can
only be achieved by maximizing the electron ionization cross section since the
maximal number of ionizing sides and radioisotope activity per side are fixed for a
given geometric configuration and radioisotope.
The electron ionization cross section of xenon illustrated in Diagram 23 [33] is a
function of the incident electron energy and the maximal ionization cross section
appear to occur at a relatively low electron energy, i.e.: 30 , which is
equivalent to a velocity of ⁄ . However the energy of most
decay radioisotope electrons is of the order of several kilo and even
megaelectronvolts and they must therefore be decelerated in order to maximize the
electron ionization cross section and consequently the ionization potential of
radioisotopes.
Diagram 23 Electron ionization cross section of Xenon (5p orbit)
Electrons are subatomic particles that can only be influenced by gravitational,
magnetic and electric fields but only the latter ones can practically be used to
modulate electrons’ velocities without altering their trajectories.](https://image.slidesharecdn.com/e6658598-f681-40eb-8022-9624ff4773c2-150415072440-conversion-gate01/85/Thesis-68-320.jpg)


![BUAA Academic Dissertation for Doctoral
37
generate an electric arc. Electric breakdown can occurs in a gaseous environment
but also in vacuum as illustrated in Diagrams 25 and 26.
Diagram 25 Electric breakdown at atmospheric Pressure
Diagram 26 Vacuum dielectric breakdown
This phenomenon occurs at a breakdown voltage given by Paschen’s Law [34]:
⁄⁄⁄ (3.27)](https://image.slidesharecdn.com/e6658598-f681-40eb-8022-9624ff4773c2-150415072440-conversion-gate01/85/Thesis-71-320.jpg)
![Chapter 3 decay radioisotope electron source
38
Where is the length of the gap that separates both electrodes, is the gas
pressure, , and are three constants specific to the gas being used. Eq. 3.27
can be simplified by introducing a new constant given by:
⁄⁄ (3.28)
and becomes:
⁄ (3.29)
Electric breakdowns must be prevented to extend the operating life of electrodes.
Eq. 3.29 can be used to plot Paschen curves that give the breakdown voltage of
different gases as a function of the product and the Paschen curve of xenon
illustrated in Diagram 27 was plotted using the following values 19.3 and 0.376
for the constants and [34].](https://image.slidesharecdn.com/e6658598-f681-40eb-8022-9624ff4773c2-150415072440-conversion-gate01/85/Thesis-72-320.jpg)
![BUAA Academic Dissertation for Doctoral
39
Diagram 27 Breakdown voltage in xenon as a function of the product (p.d) [34]
It appears that the largest values of breakdown voltage are obtained for extremely
small and large values of the product . This means that gas breakdowns are less
likely to occur in a vacuum and high pressure environment. Small gap distances
and pressures prevent gas breakdown by reducing the quantity of particles
available to initiate an avalanche breakdown whilst large gap distances and
pressures limit gas breakdown by increasing the particle load that must be carried
by a given voltage. It should however be noted that breakdown voltages increase
linearly for large values of and exponentially for smaller ones. Ion thrusters’
discharge chambers are operated at very low pressures, i.e.: , can
safely be approximated by a vacuum. These kinds of pressure will yield extremely
high breakdown voltages because they belong to the lower end of the Paschen’s
curve where the breakdown voltage grows exponentially with reduced pressures.
Vacuum breakdown voltages are given by:](https://image.slidesharecdn.com/e6658598-f681-40eb-8022-9624ff4773c2-150415072440-conversion-gate01/85/Thesis-73-320.jpg)
![Chapter 3 decay radioisotope electron source
40
(3.30)
where is a constant that depends on the electrode’s material and is usually of the
order of ⁄ [35]. Neutral gas electric breakdowns will therefore be rather
unlikely since gap could easily sustain a potential of several hundreds of
volts.
3.7 PowerGeneration
The use of radioisotopes as electron sources in this plasma generator could prove
to be more energy efficient than traditional ion thrusters’ and their properties could
further be exploited through the application of the Self-Sufficiency Principle. This
present beta minus decay radioisotope plasma generator could achieve a state of
self-sufficiency by powering its EVM using the decay heat of its radioisotope
electron source which can only be achieved using a RTG. The radioisotope mass
required by Eq. 2.1 is given in this case by:
(3.31)
where is the radioisotope volume that is given by:
(3.32)
Where is the thickness of the radioisotope electron source that is taken here as
unity.](https://image.slidesharecdn.com/e6658598-f681-40eb-8022-9624ff4773c2-150415072440-conversion-gate01/85/Thesis-74-320.jpg)
![BUAA Academic Dissertation for Doctoral
41
3.8 Application: Ion thruster
This decay radioisotope electron source can be used to generate plasma.
Plasma generators have numerous applications and could be used as a plasma
source for most space propulsion systems. Ion thrusters were selected as the first
application of this new technology and the results achieved through its use will
now be displayed and discussed.
3.8.1 Calculations
Once plasma has been generated, ions must be extracted in order to produce a
useful thrust. This can be accomplished by establishing an electrostatic field
between the anode wall and an acceleration grid. This potential difference, equal
to the beam voltage, will draw ions out of the discharge chamber through the
apertures of the acceleration grid in order to generate a beam current that will
create the thrust that propels the spacecraft. The thrust generated by a DC
discharge ion thruster is given by:
√ ⁄ (3.33)
where is the propellant atomic mass. The maximum beam voltage depends on
the breakdown voltage of the gas and acceleration grid material. As seen earlier
the neutral gas is not likely to breakdown because of its low vacuum pressure.
Acceleration grids are often made out of molybdenum which has a voltage
breakdown ranging between and ⁄ . This gives a maximal beam
voltage of to for a thick acceleration grid. A beam voltage of
will however be used because such voltage was found to yield good
performances [36]. The beam current is given by:
⁄ (3.34)](https://image.slidesharecdn.com/e6658598-f681-40eb-8022-9624ff4773c2-150415072440-conversion-gate01/85/Thesis-75-320.jpg)
![Chapter 3 decay radioisotope electron source
42
where is the ion density, is the acoustic velocity, is the grid surface area
and is the grid transparency. The ion density depends on the degree of
ionization obtained in Eq. 3.20 and is given by:
(3.35)
The neutral density could take any value however larger values will prevent stable
plasma to be sustained because they increase the rate of recombination. Typical
values of the order of were found to enable stable discharge chamber
plasma[37]. The acoustic velocity is given by:
√ ⁄ (3.36)
where is the Boltzmann’s constant, is the electron temperature and is the
ion mass. Electrons typically have a temperature of inside discharge
chambers[37] which gives a typical acoustic velocity of ⁄ for discharge
chamber xenon ions. The grid surface area is given by:
(3.37)
A typical value of 0.8 will be used for the grid transparency [2]. The beam power,
i.e.: the power required to extract ions, is given by:
(3.38)](https://image.slidesharecdn.com/e6658598-f681-40eb-8022-9624ff4773c2-150415072440-conversion-gate01/85/Thesis-76-320.jpg)


![BUAA Academic Dissertation for Doctoral
45
easily be found to be equal to ( ). The generated excess
power was obtained by subtracting the beam power given in Eq. 3.38 from the
remaining power given in Eq. 3.39, i.e.: when the remain power
exceeded the beam power. A Beam voltage of equivalent to the one used
on the NSTAR thruster[50] was used to derive these results. Diagram 76 illustrates
the minimal electric conversion efficiency required to operate the - decay
radioisotope electron source thruster application with a discharge length of
using different radioisotopes. These values were obtained by first equating the
beam and remain powers respectively obtained in Eqs. 3.38 and 3.39 and by then
solving for the electric conversion efficiency calculated from Eq. 2.1, i.e.:
. All thrust, radioisotope mass and generated excess power densities
previously obtained were ultimately compiled in diagrams 77 to 85. Radioisotopes
were arranged into 3 categories depending on their thrust density performances.
Additional metrics called the specific thrust and excess power were finally
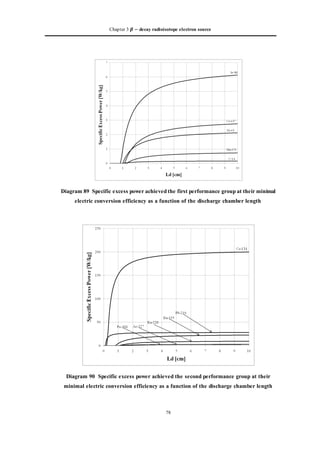
introduced in diagrams 86 to 91. The specific thrust and excess power are
equivalent to the thrust level and generated excess power achieved per kilogram of
radioisotope material. These metrics were obtained by simply dividing the values
of thrust and excess power densities obtained by the ones of radioisotope mass
density. These results were also arranged into the previous 3 performance
categories.](https://image.slidesharecdn.com/e6658598-f681-40eb-8022-9624ff4773c2-150415072440-conversion-gate01/85/Thesis-79-320.jpg)
![Chapter 3 decay radioisotope electron source
46
3.8.2.1.1.1.1.1
3.8.2.1.1.1.1.2 Table 2 Radioisotope Data
Characteristics
atomic number
Decay Energy
half-life
density
mass attenuation coefficient [38]
Gamma Ray Dose Constant
[29]
Radioisotope Specific Heat [26] *
*calculated values
3.8.2.1.1.1.1.3
3.8.2.1.1.1.1.4 Table 2 Radioisotope Data (continued)
Characteristics
atomic number
Decay Energy
half-life
density
mass attenuation coefficient [39]
Gamma Ray Dose Constant
[29]
Radioisotope Specific Heat [26]
*calculated values](https://image.slidesharecdn.com/e6658598-f681-40eb-8022-9624ff4773c2-150415072440-conversion-gate01/85/Thesis-80-320.jpg)
![BUAA Academic Dissertation for Doctoral
47
3.8.2.1.1.1.1.5
3.8.2.1.1.1.1.6 Table 2 Radioisotope Data (continued)
Characteristics
atomic number
Decay Energy
half-life
density
mass attenuation coefficient [38]
Gamma Ray Dose Constant [29]
Radioisotope Specific Heat [26] *
*calculated values
3.8.2.1.1.1.1.7
3.8.2.1.1.1.1.8 Table 2 Radioisotope Data (continued)
Characteristics
atomic number
Decay Energy
half-life
density
mass attenuation coefficient [38]
Gamma Ray Dose Constant [29]
Radioisotope Specific Heat [26] * * *
*calculated values](https://image.slidesharecdn.com/e6658598-f681-40eb-8022-9624ff4773c2-150415072440-conversion-gate01/85/Thesis-81-320.jpg)


![BUAA Academic Dissertation for Doctoral
89
requiring great power supply such as earth observation and telecommunication
satellites could greatly benefit from its use.
No special description of the ISP of the Minaka thruster was given because its
beam voltage was chosen to be equal to the one of the NSTAR thruster, i.e.:1100
[V], in order to obtain comparable results. Other conventional ion thrusters use
similar beam voltages for performance reasons. Larger beam voltages hence
specific impulses could be achieved by the Minaka thruster because the excess
power that it generates could be used to increase its thrust however doing so would
have resulted in severe long performances reduction due to material wear and
erosion.
3.8.3.7 Applications
The application of the MINAKA thruster mainly depends on the required mission
duration and each type of duration, i.e.: long or short, brings different advantages.
Mission durations are set by the selected radioisotope’s half-life. A 6 year mark
will arbitrarily be chosen and radioisotopes with half-lives exceeding this mark
will be preferred for long duration missions whilst those with shorter half-lives
should be used on short duration missions.
These last missions which are similar to the ones of Automated Transfer Vehicles
(ATV) or Earth Observation Satellites (EOS) could be accomplished by MINAKA
thrusters using either , , , , , or .
These radioisotopes are characterized by high thrust densities and specific excess
power generations. High thrust densities are important for those two applications
because ATVs and EOSs require great thrust levels to respectively, deliver cargo
or tug payloads to higher orbits, and sustain a stable orbits in the higher drag
environment that are lower earth orbits. Their higher specific excess power
generation would enable them to cover significant portions of their power
requirements and even be completely self-powered.
Longer duration missions such as the ones of space probes and communication
satellites could be accomplished by MINAKA thrusters using either
, , , or . Although these thrusters these radioisotope](https://image.slidesharecdn.com/e6658598-f681-40eb-8022-9624ff4773c2-150415072440-conversion-gate01/85/Thesis-125-320.jpg)


![Chapter 3 decay radioisotope electron source
94
3.8.3.10.1.1.1.1 Table 4 Approximate lead shielding required for radioisotope sources for [ ] at
Radioisotope
Decay
type
Decay Energy
(keV)
Half-Life
(yr)
Compound form
Melting Point
(°K)
Watt per gram Curies per watt
Pb Shield
Required (in.)
Ca (pure)
CsCl 918 0.12 207 4.6
76.7 90 Sm (pure)
[40]
Ni (pure)
45 21.8 Ac (pure) 1323 1.74 45.3 0.01
Pb (pure)
46 5.8 Ra (pure) 973 0.0741 2200 0.0
21 14.35 2673 0.0127 1.73e4 0.0
CsCl
Eu (pure)
Th (pure)
Pm (pure)
Os (pure)
Sb (pure)
Tm (pure)
* radiation shielding calculated over entire decay chains, i.e.: including gamma decays of daughter nuclides](https://image.slidesharecdn.com/e6658598-f681-40eb-8022-9624ff4773c2-150415072440-conversion-gate01/85/Thesis-130-320.jpg)
![BUAA Academic Dissertation for Doctoral
95
3.8.4 Validation of the Simplistic model using Numerical Simulation
3.8.4.1 Introduction
The performance characteristics obtained using the simplistic ionization model
developed in section 3 could be used to obtain an approximate picture of the
performance of the Minaka Thruster but are not fully reliable because they omit
several plasma physical phenomena.
A better understanding of the operation of the thruster could be obtained thanks to
numerical simulations and the aim of this section is to create a simple numerical
model that will be used to validate or negate the results obtained by the simplistic
ionization model.
The commercial plasma simulator, Oopic Pro version 2.0.2, will be used to this
end. It was developed Tech-X Corporation and is based on the plasma simulator,
Xoopic, an well-known object oriented PIC code written in C++ developed by the
Plasma Theory and Simulation Group at the University of California, Berkeley.
3.8.4.2 Model Construction & Parameters
Oopic enables two types of geometry, Cartesian and cylindrical. The axes x1, x2
and x3 of the simulation respectively refer to the x, y and z axes in a Cartesian
geometry and z, r and in a cylindrical geometry. The x3 axis hence z and axes
is the simulator axis of symmetric and is therefore always equal to unit. All units
used in the simulation are expressed in the meters, kilograms, seconds (MKS)
system.
The selected geometry matches the cubic volume of the Minaka thruster’s
discharge chamber as illustrated in Diagram 98. The x1 and x2 axes can be
modified in the simulator to suit a required geometry however the x3 axis being
the axis of symmetry cannot be altered and will always remain equal to ].
Caution must therefore be used when setting the radioisotope electron currents.
The value provided in the simulator should be amended to taken the invariable
length of the x3 axis into account in order to return sound values.](https://image.slidesharecdn.com/e6658598-f681-40eb-8022-9624ff4773c2-150415072440-conversion-gate01/85/Thesis-131-320.jpg)


![BUAA Academic Dissertation for Doctoral
99
the simplistic ionization model presented in section 3 by giving a gradually more
realistic picture of the ionization process taking place inside the Minaka Thruster.
The performance characteristics of a Minaka thruster using a Thullium-171 will be
numerically simulated and then compared to the ones obtained using the simplistic
ionization model developed in section 3, see diagrams 43 and 59.
The key simulation parameters are summarized below in table 5.
3.8.4.3.1.1.1.1 Table 5 Simulation Parameters for Thulium-171 induced neutral gas ionization
Parameter Values
Electron Current Density [I/ ] 1e-5
Electron Velocity 3.25e6
Neutral Gas Pressure assuming
a typical neutral density of [ ]
And temperature of 300 [
6e-5
This numerical model is relatively simple. There are electric nor magnetic fields
involved, no electrostatic confinements and radioisotope electrons can therefore
freely cross and exit the discharge chamber from one boundary to another while
ionizing the background neutral gas.
It quickly became evident that many of the assumptions and predictions made
during the development of the simplistic ionization model were correct. It can first
be seen from diagram 102 that the geometry of the Minaka led to perfectly
uniform ionization pattern. Electrons simultaneously enter the discharge chamber
and progressively fill it until saturation is achieved after what the electron density
inside the discharge chamber remains constant as it can be seen from diagram 103.
This occurs because all electrons have achieved a state of equilibrium from which
electrons entering the discharge chamber perfectly match those exiting it. This](https://image.slidesharecdn.com/e6658598-f681-40eb-8022-9624ff4773c2-150415072440-conversion-gate01/85/Thesis-135-320.jpg)


![Chapter 3 decay radioisotope electron source
102
Diagram 105 constant ion production rate (green line)
The ionizing process inside the discharge chamber of the Minaka thruster was
subsequently simulated for different values of discharge chamber length and
temperatures to plot new performance curves for Thulium-171. A new neutral gas
density value was calculated for a constant typical gas temperature of [ ] in
order to account for the change in pressure using the following expression:
(3.40)
Where is the neutral gas temperature. The new degree of ionization and thrust
density plots of Thullium-171 which include curves numerically simulated and
calculated using the simplistic ionization model are illustrated in diagrams 106 and
107. The simulated data plots used to generate these curves are listed appendix B.](https://image.slidesharecdn.com/e6658598-f681-40eb-8022-9624ff4773c2-150415072440-conversion-gate01/85/Thesis-138-320.jpg)


![BUAA Academic Dissertation for Doctoral
109
4 Radioisotope Heated Thermionic Electron Source
The development of a radioisotope heated thermionic electron source will now be
outlined then its applications will be explained.
4.1 Thermionic Emission
Thermionic emissions occur when a given emitting materials is brought to a
sufficiently high temperature. Once the material work function, i.e.: electron
emission energy, is achieved some materials will start emission significant
electron currents as illustrated in Diagram 111.
Diagram 111 thermionic emission of a light bulb
These emissions are described by the Richardson-Dushmann equation[41]:
⁄
(4.1)
where is a constant that is ideally equal to ⁄ , is the
temperature in kelvins, is the work function and is the Boltzmann’s constant.
Eq. (4.1) is not always applicable because its parameter may vary due to surface
and microscopic characteristics. This problem was later solved by substituting it](https://image.slidesharecdn.com/e6658598-f681-40eb-8022-9624ff4773c2-150415072440-conversion-gate01/85/Thesis-145-320.jpg)

![BUAA Academic Dissertation for Doctoral
111
Table 6 Work Function and Richardson coefficients for several cathode materials[2]
⁄ ⁄
Molybdenum
Tantalum
Tungsten](https://image.slidesharecdn.com/e6658598-f681-40eb-8022-9624ff4773c2-150415072440-conversion-gate01/85/Thesis-147-320.jpg)

![BUAA Academic Dissertation for Doctoral
107
Diagram 112 Emission current density versus temperature for various cathode
materials[2]
4.2 Radioisotope
Radioisotope decays are exothermic and can induce radioisotope surface
temperatures of the order of several hundreds and even thousands of degree.
Diagram 112 shows that consequent thermionic electron emissions could be
initiated through direct contact with such radioisotope heat sources and this new
method would have the advantage of not requiring any electricity because
radioisotopes naturally decay.
Suitable radioisotopes should therefore be selected to guarantee the good operation
of this radioisotope heated hollow cathode and those currently used to power
RTGs would be the most appropriate ones because they combine high decay heats,
low gamma emissions and long half lives. High decay heats would minimize the
quantity of radioisotopes, low gamma emissions would minimize the thickness of
the radiation shielding and long half lives would enable the operation of this
hollow cathode over the duration of most space missions. Strontium-90 ( ,
Plutonium-238 ( and Curium-244 ( are such radioisotopes. Tables 7
and 8 give the characteristics of the selected radioisotopes, their shielding
requirements and emission current densities.](https://image.slidesharecdn.com/e6658598-f681-40eb-8022-9624ff4773c2-150415072440-conversion-gate01/85/Thesis-149-320.jpg)

![BUAA Academic Dissertation for Doctoral
109
Table 7 Radioisotope characteristics and lead shielding required for radioisotope sources for a target exposure of [ ] at [39]
Radioisotope
Decay
type
Decay
Energy
Half-Life
[yr]
Compound
form
Melting Point Density
[
Watt
per gram
Curies per
watt
Pb Shield
Required
546 28.0 2313 4.6 0.22 148 6.0
5593 87.7 2673 10.0 0.39 30 0.1
5901 18.1 2453 9.0 2.27 29 2.0
Table 8 Thermionic emission current densities for Strontium-90, Plutonium-238 and Curium-244 using different insert materials
Surface
Temperature
[K]
Thermionic Emission Current ⁄
[42]
[43]
[44]
*average values.](https://image.slidesharecdn.com/e6658598-f681-40eb-8022-9624ff4773c2-150415072440-conversion-gate01/85/Thesis-151-320.jpg)


![BUAA Academic Dissertation for Doctoral
117
Table 9 Power and geometric characteristics of the NSTAR-TH15 and of the NEXIS-MAX configurations
Parameters NSTAR - TH15 NEXIS-Max
emitter length, , [45] [45]
Hollow Cathode tube diameter, , [45] [45]
Thruster Diameter, , [46] 65 [47]
Thruster’s mass, , [kg] [36] 37.5 [48]
discharge cathode keeper current, , [A] [46] [47]
discharge cathode keeper voltage, , [49] [47]
RTG conversion efficiency, , [] 5.0% 5.0%
Total Engine Power, , [50] [47]
Table 10 Performance characteristics of the radioisotope heated hollow cathodes when applied to the NSTAR-TH15 and NEXIS-MAX
configurations
Performance Characteristics NSTAR - TH15 NEXIS-MAX
Specific Power, ,
Density, ,
Required Radioisotope Diameter, , [cm]
Tube Diameter Factor, ⁄ ,
Overall Diameter Ratio, ⁄ ,
Required Radioisotope Mass, , 10.9
Mass Ratio, ⁄ , []
Power saved, ,
Overall Power Saving Ratio, ⁄ , 0.5%](https://image.slidesharecdn.com/e6658598-f681-40eb-8022-9624ff4773c2-150415072440-conversion-gate01/85/Thesis-159-320.jpg)


![Chapter 4 Radioisotope Heated Thermionic Electron Source
122
(b)
Diagram 115 Schematic of a conventional[2] (a) and Kabila (b) cathode showing the
cathode tube, insert, heater enclosed and RTG module in an on/off mode enclosed in a
keeper electrode
4.4.1.3.6 Power Supply Configuration
The power supply configuration of Kabila cathodes differs from the one of
conventional hollow cathodes. Diagram 116 illustrates the power supply
configuration of a conventional DC discharge chamber (a) and of one that uses a
Kabila cathode (b). They are almost similar at the sole exception of the heater
supply. A RTG supply was substituted to it in order to power the keeper supply
and so doing render the hollow cathode self-sufficient because no external power
was needed anymore to support its operation.](https://image.slidesharecdn.com/e6658598-f681-40eb-8022-9624ff4773c2-150415072440-conversion-gate01/85/Thesis-164-320.jpg)
![BUAA Academic Dissertation for Doctoral
123
(a) (b)
Diagram 116 Electrical schematic of a conventional DC-discharge ion thruster[2] (a)
and of one using a Kabila cathode (b) with the cathode heater, keeper, RTG and
discharge power supplies
4.4.1.3.7 Advantages & Disadvantages
Saving power is the main advantage of this hollow cathode. 3% and 0.5% overall
power savings were respectively achieved by the NSTAR-TH15 and NEXIS-
MAX benchmark configurations. This hollow cathode also has the advantage of
being scalable. Small and medium size ion thrusters achieved better energetic
performances thanks to their lower power requirements and radioisotopes of high
densities and specific powers yielded better results.
Radioisotope heated hollow cathodes also have disadvantages. They tend to be
voluminous, heavy and potentially hazardous. First the volume occupied by the
hollow cathode must not only include the cathode tube and the radioisotope heat
source but also the RTG module and lifting mechanism. Second the mass of the
radioisotope heat source is very large and will probably cause important mass
increments. Finally radiations emitted by radioisotopes are very harmful and could
either harm nearby operators or damage surrounding equipments.](https://image.slidesharecdn.com/e6658598-f681-40eb-8022-9624ff4773c2-150415072440-conversion-gate01/85/Thesis-165-320.jpg)

![BUAA Academic Dissertation for Doctoral
125
where is the earth gravitational acceleration. The exhaust velocity of an ideal
rocket operated in a vacuum is given by the following expression:
√ (4.14)
where is the ratio of specific heat, is the specific gas constant and
combustion chamber’s temperature. High combustion chamber temperatures
appear to directly impact the ISP. The ISPs and combustion chamber temperatures
of conventional rocket engines are given in below in table 11.
Table 11 ISPs and Combustion Chamber Temperatures of Conventional Rocket
Engines [2]
Rocket Engine Combustion Chamber Temperature ISP
Monopropellant
Solid propellant
Bipropellant
These combustion chamber temperatures are obtained through chemical reaction
but plasmas could also be used to bring propellant to such temperatures and could
potentially reach better performances. Temperature is defined as the degree of
particle agitation and plasma particles achieve much greater temperatures than the
ones of neutral gases because their ions and electrons are already separated hence
can move much more freely. All matter eventually transits to a state of plasma as
they are heated up because the degree of agitation of neutral particles is so high
that the collision between them breaks the molecular bonds that link ions and
electrons. Neutral gas heating is not the only way to generate plasma and gases can
easily be ionized through collisions with an electron current of the right energy.](https://image.slidesharecdn.com/e6658598-f681-40eb-8022-9624ff4773c2-150415072440-conversion-gate01/85/Thesis-167-320.jpg)
![Chapter 4 Radioisotope Heated Thermionic Electron Source
126
Diagram 118 illustrates the schematic of this radioisotope heated plasma rocket.
As previously explained, its geometry is similar to the one of conventional rockets
at the exception of its combustion chamber. It was replaced by a radioisotope
heated thermionic chamber where neutral gas is transformed into plasma through
electron impact ionization. The chamber is composed of an Emitter material,
radioisotope heat source as well as of a radioisotope Thermoelectric Generator
(RTG) and shielding layer which were respectively added to convert residual
decay heat into electricity and attenuate the effect of hazardous radioisotope
radiations. The operation of the components of this rocket will subsequently be
explained and discussed.
Diagram 118 Schematic of the Radioisotope Heated Plasma Rocket Engine
4.4.2.1.2 Mass flow rate
The heating chamber of the plasma rocket transforms neutral gas into plasma
similarly to the insert of a hollow cathode. Assuming that the neutral gas
temperature inside an hollow cathode is equal to [2], the mass flow rate
through a thermionic emitter is given by the cathode flow. Dividing this cathode
flow by the insert diameter gives the mass flow rate density:](https://image.slidesharecdn.com/e6658598-f681-40eb-8022-9624ff4773c2-150415072440-conversion-gate01/85/Thesis-168-320.jpg)
![BUAA Academic Dissertation for Doctoral
127
̇
̇
(4.15)
where ̇ and respectively are the mass flow rate & surface area of a typical
hollow cathode insert. The radioisotope thermionic heating chamber’s diameter
can be found by dividing the require target mass flow rate by the mass flow rate
density:
̇
̇
(4.16)
where ̇ is the target mass flow rate. These two equations can be used to size the
heating chamber of the radioisotope heated thermionic plasma rocket engine.
4.4.2.2 Results
The performance of this radioisotope heated thermionic plasma rocket engine were
assessed using the configuration of the hollow cathode of the 15th
throttle of
NSTAR thruster and the configuration of a 1 N Hydrazine Thruster developed by
AEDS Astrium [51] which was operated on both spacecraft of the Pleiades-HR-1
constellation [52]. Tables 12 to 15 give the data of the 1 N Hydrazine thruster,
hollow cathode of the NSTAR-TH15, noble gases used and of the power
configuration of the thruster and spacecraft. The performances of the plasma
rocket engine are given in tables 16, 17 and Diagrams 119 and 120. All the
equations developed in this paper and the exhaust velocity of an ideal rocket, ISP
equations were used with the data provided in tables 12 to 14 to obtain the
performances of the plasma rocket engine listed in tables 16, 17 and plotted in
Diagrams 119 and 120. Tables 16 provides the mas flow rate and geometric
performances achieved by different neutral gases operated at the combustion
chamber temperature achieved by this plasma rocket engine, i.e.: [2].
Table 17 provides the power savings and mass requirements achieved by different](https://image.slidesharecdn.com/e6658598-f681-40eb-8022-9624ff4773c2-150415072440-conversion-gate01/85/Thesis-169-320.jpg)
![Chapter 4 Radioisotope Heated Thermionic Electron Source
128
neutral gases and then compares them with the 1 N Hydrazine benchmark thruster.
The heating chamber diameter obtained in table 17 is then plotted against the
required thrust in diagram 119 and the Specific impulses achieved by the neutral
gases for different gas exhaust velocities is illustrated in diagram 120.
Table 12 Data of the 1 N Hydrazine Thruster configuration [51]
1 N Hydrazine Thruster Data
thrust
Isp
Nominal mass flowrate
thrust
Table 13 NSTAR-TH15 Data
NSTAR Data TH-15
InsertDiameter [2]
NSTAR Cathode Flow [46]
HollowCathode Neutral Gas Temperature [2]
Emitter Length [45]](https://image.slidesharecdn.com/e6658598-f681-40eb-8022-9624ff4773c2-150415072440-conversion-gate01/85/Thesis-170-320.jpg)
![BUAA Academic Dissertation for Doctoral
129
Table 14 Noble Gas Data
Noble Gas Data Helium Neon Argon Krypton Xenon
Universal Gas Constant -
Molar Mass
Specific Gas Constant
Specific Heat Ratio -
Table 15 Power Related Data
Power Data
Thruster - CatalystBed Heater [51]
Thruster - Valve 16 V DC [51]
Thruster - Valve 28 V DC [51]
Thruster - Valve 28 V DC [51]
Thruster - Total Power
Pleiades-HR-1 - Power Generation - EOL [52]
Pleiades-HR-1 - Mean Power Generation [52]
Pleiades-HR-1 - Instrument Power Requirement [52]
Pleiades-HR-1 - Number of 1 N HydrazineThrusters [52]
Table 16 Mass Flow Rate Performances
Mass Flow Rate Performances Helium Neon Argon Krypton Xenon
Exhaust Velocity
ISP
mass flow rate per orifice
Insert Area
mass flow rate density
Heating Chamber Area [cm^2]
heating Chamber Diameter [cm]](https://image.slidesharecdn.com/e6658598-f681-40eb-8022-9624ff4773c2-150415072440-conversion-gate01/85/Thesis-171-320.jpg)

![BUAA Academic Dissertation for Doctoral
131
Table 17 Power Performances
Mass Flow Rate Performances
Helium
Neon Argon
Krypton Xenon
Selected Radioisotope
Curium-
244
Curium-
244
Curium-
244
Curium-
244
Curium-
244
RTG conversion efficiency
Radiosiotope specific power
[Wt/kg]
Radioiosotope density
[g/cm^3]
Required Radioisotope Mass
Required Radioisotope
Diameter [cm]
Overall Power Saving []
Mean Power Saving []
Instruments Power Saving []
Diagram 119 Radioisotope heated thermionic heater chamber versus the thrust
generated with different neutral gases](https://image.slidesharecdn.com/e6658598-f681-40eb-8022-9624ff4773c2-150415072440-conversion-gate01/85/Thesis-173-320.jpg)

![BUAA Academic Dissertation for Doctoral
133
better geometric performances. This can be achieved in two different ways. First
the discharge current cathode mass flow was calculated to generate a self-
sustained discharge inside the emitter. However thanks to the use of radioisotopes
such mechanism is not required anymore because heat is continuously being
supplied to sustain thermionic emissions. Neutral gas densities could therefore be
increased without fearing that its temperature may decrease or that the thermionic
emission may be interrupted. Second the diameter of the insert material could be
reduced to improve the geometric performance of the plasma rocket engine. The
values used were based on a continuous operation of the NSTAR thruster hollow
cathode over a period of several years. However hydrazine thrusters are only
required for attitude control and correction and will not be subjected to the same
requirements as the NSTAR thruster’s. Much lower insert diameters are therefore
expected on this new plasma rocket engine and this would yield better geometric
performances. Very little radioisotope is required to power the valves of the rocket
engine but a greater quantity would in fact be needed to quickly initiate thermionic
emissions. The dimensions of the heating chamber nevertheless remain extremely
high when compared with conventional hydrazine thruster. A 400 N hydrazine
thruster approximately has a nozzle diameter [51] while the best performing
radioisotope heated thermionic plasma rocket engine currently requires a heater
chamber of 12 cm to produce the same mass flow conditions as a 1 N hydrazine
thruster.
4.4.2.3.3 Power Consideration
This rocket engine brings considerable energetic benefits by saving a not
negligible amount of power equivalent to the sum of its valves’ power. During
operation it is self-sufficient and therefore does not require any power input from
the spacecraft and can even supply power to the spacecraft when switched off. A
single rocket engine can provide of electric power and each spacecraft of
the Pleiades HR1 constellation operates four of them. This is equal to of
additional power could be used to supply up to of the spacecraft total power
generation, of its mean power generation and even of the power](https://image.slidesharecdn.com/e6658598-f681-40eb-8022-9624ff4773c2-150415072440-conversion-gate01/85/Thesis-175-320.jpg)

![BUAA Academic Dissertation for Doctoral
135
exothermic process. Monopropellant rockets use chemical reactions to raise the
gas temperature whilst radioisotope heated thermionic plasma rocket engines
accomplish it through gas ionization. The radioisotope heat source needs to remain
in contact with the emitter throughout the operation of the plasma rocket engine
that is switched on and off by disconnecting the radioisotope heat source similarly
to radioisotope heated hollow cathodes. [53]
4.4.2.3.6 Advantages & Disadvantages
The Kabila rocket has several advantages. First it can save a non negligible
amount of power, i.e.: up to 32% of the power required by the instruments of one
of the spacecraft of the Pleiades-HR-1 constellation. Second it can achieve very
high specific impulses exceeding the ones of solid and bipropellant rocket engines,
i.e.: 529 seconds. Its propellant is extremely abundant, i.e.: helium, can be easily
stored and it can also be restarted. Noble gases do not required special thermal
conditioning as opposed to bipropellants and can therefore be stored for longer
periods of time and at no additional energy cost. It also achieved specific impulses
superior to the ones of bi and solid propellant rocket engines but as opposed to the
latter its combustion process can be initiated, interrupted or even operated in pulse
modes as easily as mono and bipropellant rockets, this adding to its precision and
maneuverability.
The Kabila rocket would greatly benefit existing spacecraft by extending their
operation duration and range, lowering their operating cost and facilitating their
routine maneuvers. The rocket can generate great power and fuel savings by on
one hand acting as an independent power source and by removing the need of the
use of power-demanding cryogenic cooling systems to achieve ISPs similar to or
exceeding the ones of liquid propellant systems and by on the other generating far
greater ISPs. This would enable communication satellites, earth observation
satellites and space probes to increase the extent of their payload but also their
operating lives and ranges. This would result in a greater profit generation in the
case of communication and commercial earth observation satellites and in more
versatile and powerful applications for all types of earth observation satellites and
space probes by for instance enabling the latter to operate in regions yet to be](https://image.slidesharecdn.com/e6658598-f681-40eb-8022-9624ff4773c2-150415072440-conversion-gate01/85/Thesis-177-320.jpg)


![BUAA Academic Dissertation for Doctoral
143
5 APPENDICES
Appendix A: Oopic Programming Script used to simulated the
ionization process inside the discharge chamber of the Minaka
thruster
MinakaWithElectronsConfinement
{
Simulation of the neutral ionization inside the Minaka propulsive cell with an
electrostatic confinement
}
// Specifies all the variables used during the simulation
Variables
{
Jmax=100 // number of grid in the x1 direction per metre
Kmax=100 // number of grid in the x2 direction per metre
RP=1 // Relative Permittivity of Material
ld=0.01 //discharge chamber lenght (m)
Irad= 1e-5*(ld*100)^2*1/ld // Radioisotope electron current [A] adjusted to take
the x3 symmetric axis [1 (m)] into consideration
EVel=3.25e6 // electron drift velocity [m/s]
NeuPres=6e-5 // neutral gas pressure [Torr]
MacPar=1e3 // Macroparticles density
}](https://image.slidesharecdn.com/e6658598-f681-40eb-8022-9624ff4773c2-150415072440-conversion-gate01/85/Thesis-183-320.jpg)

![BUAA Academic Dissertation for Doctoral
145
}
// Specifies the Monte Carlo Collision Model
MCC
{
gas = Xe // Specifies the Gas type
pressure = NeuPres // Specifies the Gas pressure in Torr
eSpecies = electron // Specifies the electron species that create ionization
iSpecies = xenon // Specifies the Ion species created from ionization
}
// Specifies ion species paramaters
Species
{
name = xenon // Specifies the name of the species
m = 2.18e-25 // Specifies the species' mass [kg]
q = 1.6e-19 // Specifies the charge [C]
subcycle = 10 //Number of field advances per particle advance
collisionModel=2 // Specifies the collision model as the one of an
electron
}](https://image.slidesharecdn.com/e6658598-f681-40eb-8022-9624ff4773c2-150415072440-conversion-gate01/85/Thesis-185-320.jpg)
![Chapter 5 Appendices
146
// Specifies secondary electron species paramaters
Species
{
name = secelectrons // Specifies the name of the species
m = 9.11E-31 // Specifies the species' mass [kg]
q = -1.6e-19 // Specifies the charge [C]
collisionModel=1 // Specifies the collision model as the one of an electron
}
// Specifies electron species paramaters
Species
{
name=electron // Specifies electrons as the species used
collisionModel=1 // Specifies the collision model as the one of an electron
}
// Specifies all electron emission boundaries
BeamEmitter](https://image.slidesharecdn.com/e6658598-f681-40eb-8022-9624ff4773c2-150415072440-conversion-gate01/85/Thesis-186-320.jpg)
![BUAA Academic Dissertation for Doctoral
147
{
j1=0 // Specifies x1 index for first Beam Emitter endpoint
k1=0 // Specifies x2 index for Beam Emitter boundary endpoint
j2=0 // Specifies x1 index for second Beam Emitter endpoint
k2=Kmax // Specifies x2 index for second Beam Emitter endpoint
normal=1 // Specifies the orientation of the Beam Emitter
speciesName=electron // Specifies the name of the emitted species
I=Irad // Specifies the current [A]
np2c=MacPar // Specifies the number of electrons per macroparticles
v1drift=EVel // Specifies the drift Velocity [m/s]
Secondary
{
secondary = 0.5
secSpecies = secelectrons
iSpecies = xenon
}
}
BeamEmitter
{](https://image.slidesharecdn.com/e6658598-f681-40eb-8022-9624ff4773c2-150415072440-conversion-gate01/85/Thesis-187-320.jpg)
![Chapter 5 Appendices
148
j1=0 // Specifies x1 index for first boundary endpoint
k1=0 // Specifies x2 index for first boundary endpoint
j2=Jmax // Specifies x1 index for second boundary endpoint
k2=0 // Specifies x2 index for second boundary endpoint
name=lower // Specifies the name of the boundary
normal=1 // Specifies the orientation of the boundary
speciesName=electron // Specifies the name of the emitted species
I=Irad // Specifies the current [A]
np2c=MacPar // Specifies the number of electrons per macroparticles
v2drift=EVel // Specifies the drift Velocity [m/s]
Secondary
{
secondary = 0.5
secSpecies = secelectrons
iSpecies = xenon
}
}
BeamEmitter
{
j1=0 // Specifies x1 index for first boundary endpoint](https://image.slidesharecdn.com/e6658598-f681-40eb-8022-9624ff4773c2-150415072440-conversion-gate01/85/Thesis-188-320.jpg)
![BUAA Academic Dissertation for Doctoral
149
k1=Kmax // Specifies x2 index for first boundary endpoint
j2=Jmax // Specifies x1 index for second boundary endpoint
k2=Kmax // Specifies x2 index for second boundary endpoint
name=upper // Specifies the name of the boundary
normal=-1 // Specifies the orientation of the boundary
speciesName=electron // Specifies the name of the emitted species
I=Irad // Specifies the current [A]
np2c=MacPar // Specifies the number of electrons per macroparticles
v2drift=EVel // Specifies the drift Velocity [m/s]
Secondary
{
secondary = 0.5
secSpecies = secelectrons
iSpecies = xenon
}
}
BeamEmitter
{
j1=Jmax // Specifies x1 index for first boundary endpoint](https://image.slidesharecdn.com/e6658598-f681-40eb-8022-9624ff4773c2-150415072440-conversion-gate01/85/Thesis-189-320.jpg)
![Chapter 5 Appendices
150
k1=0 // Specifies x2 index for first boundary endpoint
j2=Jmax // Specifies x1 index for second boundary endpoint
k2=Kmax // Specifies x2 index for second boundary endpoint
name=right // Specifies the name of the boundary
normal=-1 // Specifies the orientation of the boundary
speciesName=electron // Specifies the name of the emitted species
I=Irad // Specifies the current [A]
np2c=MacPar // Specifies the number of electrons per macroparticles
v1drift=EVel // Specifies the drift Velocity [m/s]
Secondary
{
secondary = 0.5
secSpecies = secelectrons
iSpecies = xenon
}
}
// Specifies all conducting boundaries
Conductor
{
reflection= 1 //Specifies that all particles will be fully reflected by the Beam
Emitter](https://image.slidesharecdn.com/e6658598-f681-40eb-8022-9624ff4773c2-150415072440-conversion-gate01/85/Thesis-190-320.jpg)


![BUAA Academic Dissertation for Doctoral
153
MinakaWithoutElectronsConfinement
{
Simulation of the neutral ionization inside the Minaka propulsive cell without an
electrostatic confinement
}
Variables
{
Jmax=100 // number of grid in the x1 direction per metre
Kmax=100 // number of grid in the x2 direction per metre
RP=1 // Relative Permittivity of Material
ld=0.01 //discharge chamber lenght (m)
Irad= 1e-5*(ld*100)^2*1/ld // Radioisotope electron current [A] adjusted to take
the x3 symmetric axis [1 (m)] into consideration
EVel=3.25e6 // electron drift velocity [m/s]
NeuPres=6e-5 // neutral gas pressure [Torr]
MacPar=1e3 // Macroparticles density
}
// Specifies all the elements used during the simulation
Region
{](https://image.slidesharecdn.com/e6658598-f681-40eb-8022-9624ff4773c2-150415072440-conversion-gate01/85/Thesis-193-320.jpg)

![BUAA Academic Dissertation for Doctoral
155
// Specifies the Monte Carlo Collision Model
MCC
{
gas = Xe // Specifies the Gas type
pressure = NeuPres // Specifies the Gas pressure in Torr
eSpecies = electron // Specifies the electron species that create ionization
iSpecies = xenon // Specifies the Ion species created from ionization
}
// Specifies ion species paramaters
Species
{
name = xenon // Specifies the name of the species
m = 2.18e-25 // Specifies the species' mass [kg]
q = 1.6e-19 // Specifies the charge [C]
subcycle = 10 //Number of field advances per particle advance
collisionModel=2 // Specifies the collision model as the one of an
electron
}
// Specifies secondary electron species paramaters
Species](https://image.slidesharecdn.com/e6658598-f681-40eb-8022-9624ff4773c2-150415072440-conversion-gate01/85/Thesis-195-320.jpg)
![Chapter 5 Appendices
156
{
name = secelectrons // Specifies the name of the species
m = 9.11E-31 // Specifies the species' mass [kg]
q = -1.6e-19 // Specifies the charge [C]
collisionModel=1 // Specifies the collision model as the one of an electron
}
// Specifies electron species paramaters
Species
{
name=electron // Specifies electrons as the species used
collisionModel=1 // Specifies the collision model as the one of an electron
}
EmitPort
{
//reflection=1
j1=0 // Specifies x1 index for first Beam Emitter endpoint
k1=0 // Specifies x2 index for Beam Emitter boundary endpoint](https://image.slidesharecdn.com/e6658598-f681-40eb-8022-9624ff4773c2-150415072440-conversion-gate01/85/Thesis-196-320.jpg)
![BUAA Academic Dissertation for Doctoral
157
j2=0 // Specifies x1 index for second Beam Emitter endpoint
k2=Kmax // Specifies x2 index for second Beam Emitter endpoint
normal=1 // Specifies the orientation of the Beam Emitter
speciesName=electron // Specifies the name of the emitted species
I=Irad // Specifies the current [A]
np2c=MacPar // Specifies the number of electrons per macroparticles
v1drift=EVel // Specifies the drift Velocity [m/s]
Secondary
{
secondary = 0.5
secSpecies = secelectrons
iSpecies = xenon
}
}
EmitPort
{
//reflection=1
j1=0 // Specifies x1 index for first boundary endpoint
k1=0 // Specifies x2 index for first boundary endpoint
j2=Jmax // Specifies x1 index for second boundary endpoint
k2=0 // Specifies x2 index for second boundary endpoint
name=lower // Specifies the name of the boundary](https://image.slidesharecdn.com/e6658598-f681-40eb-8022-9624ff4773c2-150415072440-conversion-gate01/85/Thesis-197-320.jpg)
![Chapter 5 Appendices
158
normal=1 // Specifies the orientation of the boundary
speciesName=electron // Specifies the name of the emitted species
I=Irad // Specifies the current [A]
np2c=MacPar // Specifies the number of electrons per macroparticles
v2drift=EVel // Specifies the drift Velocity [m/s]
Secondary
{
secondary = 0.5
secSpecies = secelectrons
iSpecies = xenon
}
}
EmitPort
{
//reflection=1
j1=0 // Specifies x1 index for first boundary endpoint
k1=Kmax // Specifies x2 index for first boundary endpoint
j2=Jmax // Specifies x1 index for second boundary endpoint
k2=Kmax // Specifies x2 index for second boundary endpoint
name=upper // Specifies the name of the boundary
normal=-1 // Specifies the orientation of the boundary](https://image.slidesharecdn.com/e6658598-f681-40eb-8022-9624ff4773c2-150415072440-conversion-gate01/85/Thesis-198-320.jpg)
![BUAA Academic Dissertation for Doctoral
159
speciesName=electron // Specifies the name of the emitted species
I=Irad // Specifies the current [A]
np2c=MacPar // Specifies the number of electrons per macroparticles
v2drift=EVel // Specifies the drift Velocity [m/s]
Secondary
{
secondary = 0.5
secSpecies = secelectrons
iSpecies = xenon
}
}
EmitPort
{
//reflection=1
j1=Jmax // Specifies x1 index for first boundary endpoint
k1=0 // Specifies x2 index for first boundary endpoint
j2=Jmax // Specifies x1 index for second boundary endpoint
k2=Kmax // Specifies x2 index for second boundary endpoint
name=right // Specifies the name of the boundary
normal=-1 // Specifies the orientation of the boundary](https://image.slidesharecdn.com/e6658598-f681-40eb-8022-9624ff4773c2-150415072440-conversion-gate01/85/Thesis-199-320.jpg)
![Chapter 5 Appendices
160
speciesName=electron // Specifies the name of the emitted species
I=Irad // Specifies the current [A]
np2c=MacPar // Specifies the number of electrons per macroparticles
v1drift=EVel // Specifies the drift Velocity [m/s]
Secondary
{
secondary = 0.5
secSpecies = secelectrons
iSpecies = xenon
}
}
}](https://image.slidesharecdn.com/e6658598-f681-40eb-8022-9624ff4773c2-150415072440-conversion-gate01/85/Thesis-200-320.jpg)


![BUAA Academic Dissertation for Doctoral
171
5.1.3 Increasing Pressure from 1e-7 to 1e-1 [Torr]
Diagram B21 Ion count plot for Tn=300C and Pres= 1e-1 [Torr] Ld=1cm, macro-to-real
particle=1e3 and x3=1 m
Diagram B22 Ion count plot for Tn=300C and Pres= 1e-2 [Torr] Ld=1cm, macro-to-real
particle=1e3 and x3=1 m](https://image.slidesharecdn.com/e6658598-f681-40eb-8022-9624ff4773c2-150415072440-conversion-gate01/85/Thesis-211-320.jpg)
![Chapter 5 Appendices
172
Diagram B23 Ion count plot for Tn=300C and Pres= 1e-3 [Torr] Ld=1cm, macro-to-real
particle=1e3 and x3=1 m
Diagram B24 Ion count plot for Tn=300C and Pres= 1e-4 [Torr] Ld=1cm, macro-to-real
particle=1e3 and x3=1 m](https://image.slidesharecdn.com/e6658598-f681-40eb-8022-9624ff4773c2-150415072440-conversion-gate01/85/Thesis-212-320.jpg)
![BUAA Academic Dissertation for Doctoral
173
Diagram B25 Ion count plot for Tn=300C and Pres= 1e-5 [Torr] Ld=1cm, macro-to-real
particle=1e3 and x3=1 m
Diagram B26 Ion count plot for Tn=300C and Pres= 1e-6 [Torr] Ld=1cm, macro-to-real
particle=1e3 and x3=1 m](https://image.slidesharecdn.com/e6658598-f681-40eb-8022-9624ff4773c2-150415072440-conversion-gate01/85/Thesis-213-320.jpg)
![Chapter 5 Appendices
174
Diagram B27 Ion count plot for Tn=300C and Pres= 1e-7 [Torr] Ld=1cm, macro-to-real
particle=1e2 and x3=1 m](https://image.slidesharecdn.com/e6658598-f681-40eb-8022-9624ff4773c2-150415072440-conversion-gate01/85/Thesis-214-320.jpg)
![BUAA Academic Dissertation for Doctoral
175
References
[1] G. P. Sutton, O. Biblarz, Rocket propulsion elements : an introduction to the
engineering of rockets[G], 7 ed., JOHN WILEY & SONS, Canada, 2001.
[2] D.M. Goebel, I. Katz, fundamentals of Electric Propulsion: Ion and Hall
Thrusters [G], JPL SPACE SCIENCE AND TECHNOLOGY SERIES, (2008).
[3] K. Kuriki, K. Uematsu, S. Morimoto, MPD arcjet performance with various
propellants[A], in: 16th International Electric Propulsion Conference[C],
American Institute of Aeronautics and Astronautics, 1982.
[4] C. Leonard, L. Benjamin, O. Chris, B. Maxwell, M. Greg, I. Andrew, C. Mark,
G. Tim, S. Jared, D. Franklin Chang, D. Chang, B. Edgar, VASIMR Performance
Results[A], in: 46th AIAA/ASME/SAE/ASEE Joint Propulsion Conference &
Exhibit[C], American Institute of Aeronautics and Astronautics, 2010.
[5] K. Boyer, Nuclear rockets[A], in: 4th Annual Meeting and Technical
Display[C], American Institute of Aeronautics and Astronautics, 1967.
[6] R. Mcclellan, Gaseous nuclear fission rockets[A], in: 18th Joint Propulsion
Conference[C], American Institute of Aeronautics and Astronautics, 1982.
[7] L. Robert, Fundamental Analysis of Radioisotope Propulsion[G], in: Space
2006, American Institute of Aeronautics and Astronautics, 2006.
[8] G.J.M. Hagelaar, D.B. Mihailova, J. Van Dijk, Analytical model of a
longitudinal hollow cathode discharge [J], Journal of Physics D: Applied Physics,
43 (2010).
[9] H. Chuaqui, M. Favre, L. Soto, E.S. Wyndham, High current electron beam
generation in a vacuum transient hollow cathode discharge [J], IEEE Transactions
on Plasma Science, 21 (1993) 778-783.
[10] I. Katz, I.G. Mikellides, D.M. Goebel, J.E. Polk, Insert heating and ignition in
inert-gas hollow cathodes [J], IEEE Transactions on Plasma Science, 36 (2008)
2199-2206.](https://image.slidesharecdn.com/e6658598-f681-40eb-8022-9624ff4773c2-150415072440-conversion-gate01/85/Thesis-215-320.jpg)
![References
176
[11] A. Sengupta, Magnetic confinement in a ring-cusp ion thruster discharge
plasma [J], Journal of Applied Physics, 105 (2009).
[12] Z. Lingwei, L. Yu, L. Juan, G. Zuo, J. Haocheng, W. Haixing, T. Haibin,
Numerical Simulation of Characteristics of CEX Ions in Ion Thruster Optical
System [J], Chinese Journal of Aeronautics, 23 (2010) 15-21.
[13] L. Popelier, A. Aanesland, S. Mazouffre, P. Chabert, Extraction and
acceleration of ions from an ion-ion plasma - Application to space propulsion [A],
in: 5th International Conference on Recent Advances in Space Technologies[C],
RAST 2011, June 9, 2011 - June 11, 2011, IEEE Computer Society, Istanbul,
Turkey, 2011, pp. 708-711.
[14] R. McLaren, M. Ragheb, Nuclear propulsion choices for space exploration[A],
in: 1st International Nuclear and Renewable Energy Conference, INREC'10[C],
IEEE Computer Society, Amman, Jordan, 2010.
[15] G. Miskolczy, D.P. Lieb, Radioisotope thermionic converters for space
applications[A], in: Proceedings of the 25th Intersociety Energy Conversion
Engineering Conference - IECEC '90[C], August 12, 1990 - August 17, 1990, Publ
by IEEE, Reno, NV, USA, 1990, pp. 222-226.
[16] H.R. Williams, R.M. Ambrosi, N.P. Bannister, A Mars hopping vehicle
propelled by a radioisotope thermal rocket: Thermofluid design and materials
selection[A], Proceedings of the Royal Society A: Mathematical, Physical and
Engineering Sciences[C], 467 (2011) 1290-1309.
[17] G.L. Bennett, R.J. Hemler, A. Schock, Status report on the U.S. space nuclear
program [J], Acta Astronautica, 38 (1996) 551-560.
[18] G.R. Schmidt, D.H. Manzella, H. Kamhawi, T. Kremic, S.R. Oleson, J.W.
Dankanich, L.A. Dudzinski, Radioisotope electric propulsion (REP): A near-term
approach to nuclear propulsion [J], Acta Astronautica, 66 (2010) 501-507.
[19] L.S. Mason, Realistic specific power expectations for advanced radioisotope
power systems [J], Journal of Propulsion and Power, 23 (2007) 1075-1079.](https://image.slidesharecdn.com/e6658598-f681-40eb-8022-9624ff4773c2-150415072440-conversion-gate01/85/Thesis-216-320.jpg)
![BUAA Academic Dissertation for Doctoral
177
[20] E. Mainardi, The MAUS nuclear space reactor with ion propulsion system [J],
Nuclear Instruments and Methods in Physics Research, Section A: Accelerators,
Spectrometers, Detectors and Associated Equipment, 561 (2006) 331-335.
[21] A.N. Grubisic, S.B. Gabriel, Thrust production mechanisms in hollow
cathode microthrusters [A], in: 2010 IEEE Aerospace Conference[C], March 6,
2010 - March 13, 2010, IEEE Computer Society, Big Sky, MT, United states,
2010, pp. Aerospace and Electronics Systems Society.
[22] Y. Watanabe, J. Appelbaum, I. Maya, Stability of MHD plasmas ionized by
nuclear fragments [A], in: Proceedings of the 26th Intersociety Energy
Conversion Engineering Conference [C]- IECEC '91, August 4, 1991 - August 9,
1991, Publ by IEEE, Boston, MA, USA, 1991, pp. 87-92.
[23] C. Bruno, M. Rosa-Clot, Curium-244 alpha emission for a nano- and micro-
Newton thruster [J], Acta Astronautica, 38 (1996) 231-234.
[24] A. Sanchez-Torres, Radioisotope Power Systems for Space Applications[G],
in: P.N. Singh (Ed.) Radioisotopes - Applications in Physical Sciences, InTech,
2011.
[25] L.S. Mason, Realistic specific power expectations for advanced radioisotope
power systems[J], Journal of Propulsion and Power, 23 (2007) 1075-1079.
[26] B.C. Blanke, J.H. Birden, K.C. Jordan, E.L. Murphy, NUCLEAR
BATTERY-THERMOCOUPLE TYPE SUMMARY REPORT[R], in: AEC
Research and Development REPORT, MONSANTO RESEARCH
CORPORATION, 1962.
[27] External Radiation Protection - Shielding - X and Gamma Radiation, in:
D.o.E. Safety (Ed.) Radiation Protection Training Manual & Study Guide,
University of Maryland · Division of Administration & Finance · Maryland, 1994.
[28] H.J. Bicehouse, Module 4 Basics of Radiation Protection [PDF Document].
Retrieved from Lecture Notes Online Website:
http://www.rinsc.ri.gov/healthphysics/](https://image.slidesharecdn.com/e6658598-f681-40eb-8022-9624ff4773c2-150415072440-conversion-gate01/85/Thesis-217-320.jpg)
![References
178
[29] Gamma Ray Dose Constants, in: I. Integrated Environmental Management
(Ed.), Integrated Environmental Management, Inc. Available from:
http://www.iem-inc.com/information/tools/gamma-ray-dose-constants.
[30] J.H. Hubbell, S.M. Seltzer, Radiation Research 136, 147[DB/OL], in,
National Institute of Standards and Technology, Gaithersburg, MD, 1993.
[31] American National Standard for Gamma-Ray Attenuation Coefficients and
Buildup Factors for Engineering Materials - ANSI/ANS-6.4.3-1991[DB/OL], in,
1991.
[32] J.G. J. Magill, Nuclear Energetics & Radioactivity and Nuclear Reactions [G],
in: RADIOACTIVITY RADIONUCLIDES RADIATION, Springer, 2005.
[33] W. Lotz, Electron-Impact Ionization Cross-Sections and Ionization Rate
Coefficients for Atoms and Ions[J], Astrophysical Journal Supplement, 14 (1967).
[34] L.F. Berzak, S.E. Dorfman, S.P. Smith, Paschen's Law in Air and Nobles
Gases (2006). Unpublished manuscript. Retrieved from: http://www-
eng.lbl.gov/~shuman/XENON/REFERENCES&OTHER_MISC/paschen_report.p
df
[35] N. Zouache, A. Lefort, Electrical breakdown of small gaps in vacuum[A],
IEEE Transactions on Dielectrics and Electrical Insulation[C], 4 (1997) 358-364.
[36] J. Polk, R. Kakuda, J. Anderson, J. Brophy, V. Rawlin, M. Patterson, J. Sovey,
J. Hamley, Validation of the NSTAR ion propulsion system on the Deep Space
One mission - Overview and initial results[A], in: 35th Joint Propulsion
Conference and Exhibit[C], American Institute of Aeronautics and Astronautics,
1999.
[37] R.E. Wirz, DISCHARGE PLASMA PROCESSES OF RING-CUSP ION
THRUSTERS[D], in, CALIFORNIA INSTITUTE OF TECHNOLOGY, Pasadena,
California, 2005, pp. 239.
[38] [cited 2014 May 3rd]; Available from:
http://physics.nist.gov/PhysRefData/XrayMassCoef/ElemTab/z82.html](https://image.slidesharecdn.com/e6658598-f681-40eb-8022-9624ff4773c2-150415072440-conversion-gate01/85/Thesis-218-320.jpg)
![BUAA Academic Dissertation for Doctoral
179
[39] [cited 2014 May 3rd]; Available from:
http://physics.nist.gov/PhysRefData/XrayMassCoef/ElemTab/z82.html
[40] G.L. Kulcinski, Lecture 5:Basic Elements of Static RTG’s [PDF document].
Retrieved from Lecture Notes Online Website:
http://fti.neep.wisc.edu/neep602/SPRING00/neep602.html
[41] O.W. Richardson, Electron Theory of Matter[J], Philips Magazine, 23 (1912).
[42] A. Ohashi, K. Ueki, Improvement of a 90Sr radioisotope battery[J], Radiation
Physics and Chemistry, 51 (1998) 687.
[43] G.H. Rinehart, Design characteristics and fabrication of radioisotope heat
sources for space missions[J], Progress in Nuclear Energy, 39 (2001) 305-319.
[44] V. Radchenko, B. Andreichikov, H. Wanke, V. Gavrilov, B. Korchuganov, R.
Rieder, M. Ryabinin, T. Economou, Curium-244 alpha-sources for space
research[A], in: 4th Topical Meeting on the Industrial Radiation and Radioisotope
Measurement Applications (IRRMA'99)[C], October 3, 1999 - October 7, 1999,
Elsevier Ltd, Raleigh, NC, USA, 2000, pp. 821-824.
[45] K.K. Jameson, D.M. Goebel, R. Watkins, Hollow Cathode and Thruster
Discharge Chamber Plasma Measurements Using High-Speed Scanning Probes[A],
in: IEPC-2005-269 (Ed.) the 29th International Electric Propulsion Conference[C],
Princeton University, 2005.
[46] D. Herman, A.D. Gallimore, Discharge Chamber Plasma Structure of a 30 cm
NSTAR-type Ion Engine[A], in: 40th AIAA/ASME/SAE/ASEE Joint Propulsion
Conference and Exhibit[C], American Institute of Aeronautics and Astronautics,
2004.
[47] G. Dan, J. Polk, A. Sengupta, Discharge Chamber Performance of the NEXIS
Ion Thruster[A], in: 40th AIAA/ASME/SAE/ASEE Joint Propulsion Conference
and Exhibit[C], American Institute of Aeronautics and Astronautics, 2004.
[48] R. Thomas, P. James, An Overview of the Nuclear Electric Xenon Ion System
(NEXIS) Activity[A], in: 40th AIAA/ASME/SAE/ASEE Joint Propulsion](https://image.slidesharecdn.com/e6658598-f681-40eb-8022-9624ff4773c2-150415072440-conversion-gate01/85/Thesis-219-320.jpg)
![References
180
Conference and Exhibit[C], American Institute of Aeronautics and Astronautics,
2004.
[49] J. Polk, J. Anderson, J. Brophy, V. Rawlin, M. Patterson, J. Sovey, J. Hamley,
An overview of the results from an 8200 hour wear test of the NSTAR ion
thruster[A], in: 35th Joint Propulsion Conference and Exhibit[C], American
Institute of Aeronautics and Astronautics, 1999.
[50] J.R. Brophy, R.Y. Kakuda, J.Polk, al., Ion Propulsion System (NSTAR) DS1
Technology Validation Report[R], in, JPL.
[51] [cited 2014 March 29th]; Available from:
http://cs.astrium.eads.net/sp/spacecraft-propulsion/hydrazine-thrusters/1n-
thruster.html.
[52] [cited 2014 March 29th]; Available from:
https://directory.eoportal.org/web/eoportal/satellite-missions/p/pleiades.
[53] K. Mboyi, J. X. Ren, Y. Liu, Development of a Radioisotope Heated Hollow
Cathode[A], in: 2014 International Conference on Aerospace Engineering[C],
Applied Mechanics and Materials, Moscow (Russia), in press.](https://image.slidesharecdn.com/e6658598-f681-40eb-8022-9624ff4773c2-150415072440-conversion-gate01/85/Thesis-220-320.jpg)


![BUAA Academic Dissertation for Doctoral
183
AUTHOR PROFILE
Kalomba Mboyi
The author is a Belgian citizen born in DRC on the 20th
of November 1988. He
graduated from Bath University in the United Kingdom with a MEng in Aerospace
Engineering and is currently pursuing a PhD in Aerospace Propulsion Theory and
Engineering at Beihang University. His research interests are advanced space
propulsion systems and radioisotope based propulsion systems. He developed his
PhD research period the Radion thruster concept to which the MINAKA and
Kabila classes of space propulsion systems belong.
Research Outcomes
ACCEPTED SCI JOURNAL PAPER:
1) K. Mboyi, J. X. Ren, Y. Liu, Development of the Kabila Rocket, a
Radioisotope Heated Thermionic Plasma Rocket, Chinese Journal of
Aeronautics[J], in press, 2014.
PUBLISHED EI/CONFERENCE:
2) K. Mboyi, J. X. Ren, Y. Liu, Development of a Radioisotope Heated Hollow
Cathode[A], in: 2014 International Conference on Aerospace Engineering[C],
Applied Mechanics and Materials, Moscow (Russia), in press.](https://image.slidesharecdn.com/e6658598-f681-40eb-8022-9624ff4773c2-150415072440-conversion-gate01/85/Thesis-223-320.jpg)

This document presents research on the feasibility of using radioisotope-based electron sources for space applications. It introduces two new types of space propulsion systems: the Minaka thruster and Kabila thruster. The Minaka thruster uses clusters of self-powered radioisotope cells to generate micro-newtons of thrust. It applies the principle of self-sufficiency to power the radioisotope electron sources. The Kabila thruster uses a hollow cathode with a radioisotope heat source instead of a conventional heater. It was found to save up to 3% in overall power compared to conventional ion thrusters. Both systems aim to overcome the energetic limitations of traditional space propulsion through novel use of radioisotopes


![991 fork[1]](https://cdn.slidesharecdn.com/ss_thumbnails/nswk3mbrnkk8ddrdbmgg-signature-3e49a9720aafd161ec5213fc5cb0fac76e0a38578f2089fb876ad1cc6de4bad4-poli-140825181333-phpapp02-thumbnail.jpg?width=640&height=640&fit=bounds)


![1298 angel[1]](https://cdn.slidesharecdn.com/ss_thumbnails/isjwj6yosrmq2ftvlpnl-signature-fabe374f978bfb273f92443e2c8243d3e294d623a7c677008fe136d7284f57a9-poli-140825181534-phpapp01-thumbnail.jpg?width=640&height=640&fit=bounds)

![1159 voronka[1]](https://cdn.slidesharecdn.com/ss_thumbnails/u6ur9dkkroaacb6r2m1z-signature-fabe374f978bfb273f92443e2c8243d3e294d623a7c677008fe136d7284f57a9-poli-140825181532-phpapp01-thumbnail.jpg?width=640&height=640&fit=bounds)


![1386 voronka[1]](https://cdn.slidesharecdn.com/ss_thumbnails/qkt2almft6oweros0u9t-signature-af3363fef01d0d7c45588ce8355ebf87395936210cee8c9809ea3a5b098ac2cc-poli-140825181820-phpapp01-thumbnail.jpg?width=640&height=640&fit=bounds)
