Download as PDF, PPTX
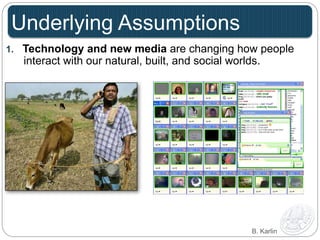
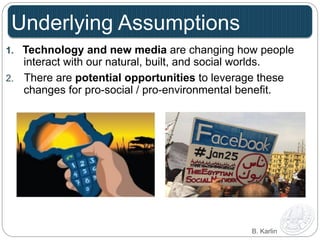
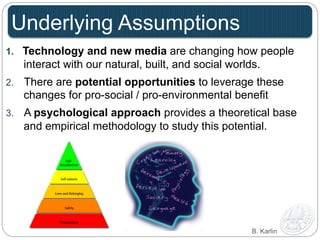
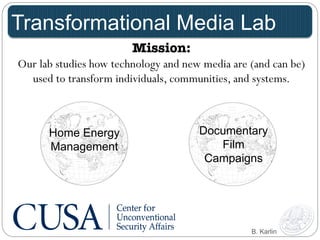
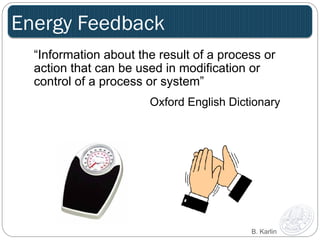
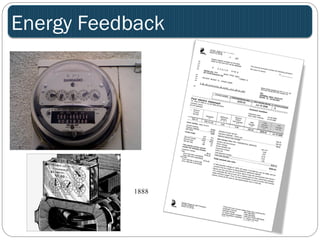
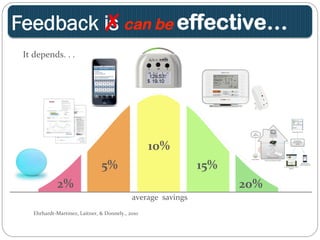
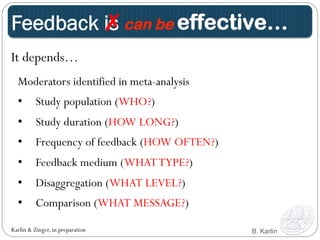
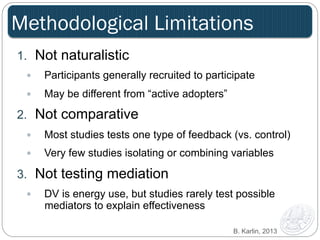
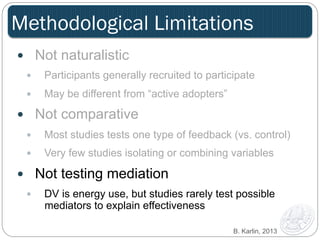
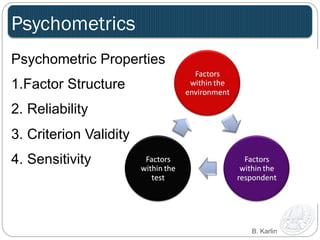
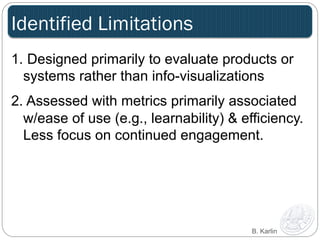
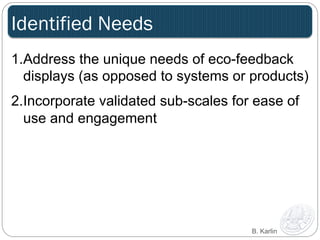
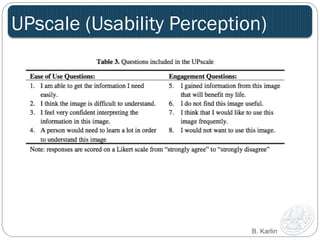
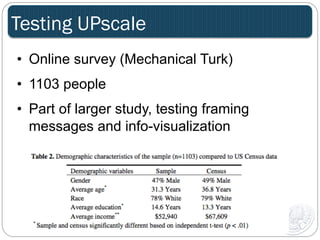
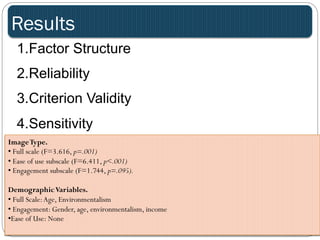

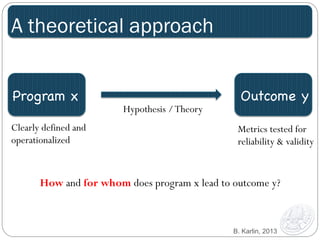

The document discusses the Usability Perception Scale (UPscale) developed to evaluate eco-feedback displays, emphasizing the impact of technology and new media on environmental behaviors. It highlights the effectiveness of feedback in promoting energy savings while addressing methodological limitations in existing studies. Additionally, it outlines the scale's psychometric properties, factor structures, and the importance of addressing unique needs for eco-feedback systems.


